QuantumTrend Filter

QuantumTrend Filter: 다중 요인 추세 확인 도구

QuantumTrend Filter로 더 명확한 추세 통찰력을 확보하세요! 이 강력한 MetaTrader 5 지표는 입증된 기술 지표 모음의 데이터를 종합하여 트레이더가 시장 추세를 식별하고 확인하는 데 도움을 주도록 세심하게 설계되었습니다. 추측을 멈추고 더 정보에 입각한 거래 결정을 내리십시오.

작동 방식

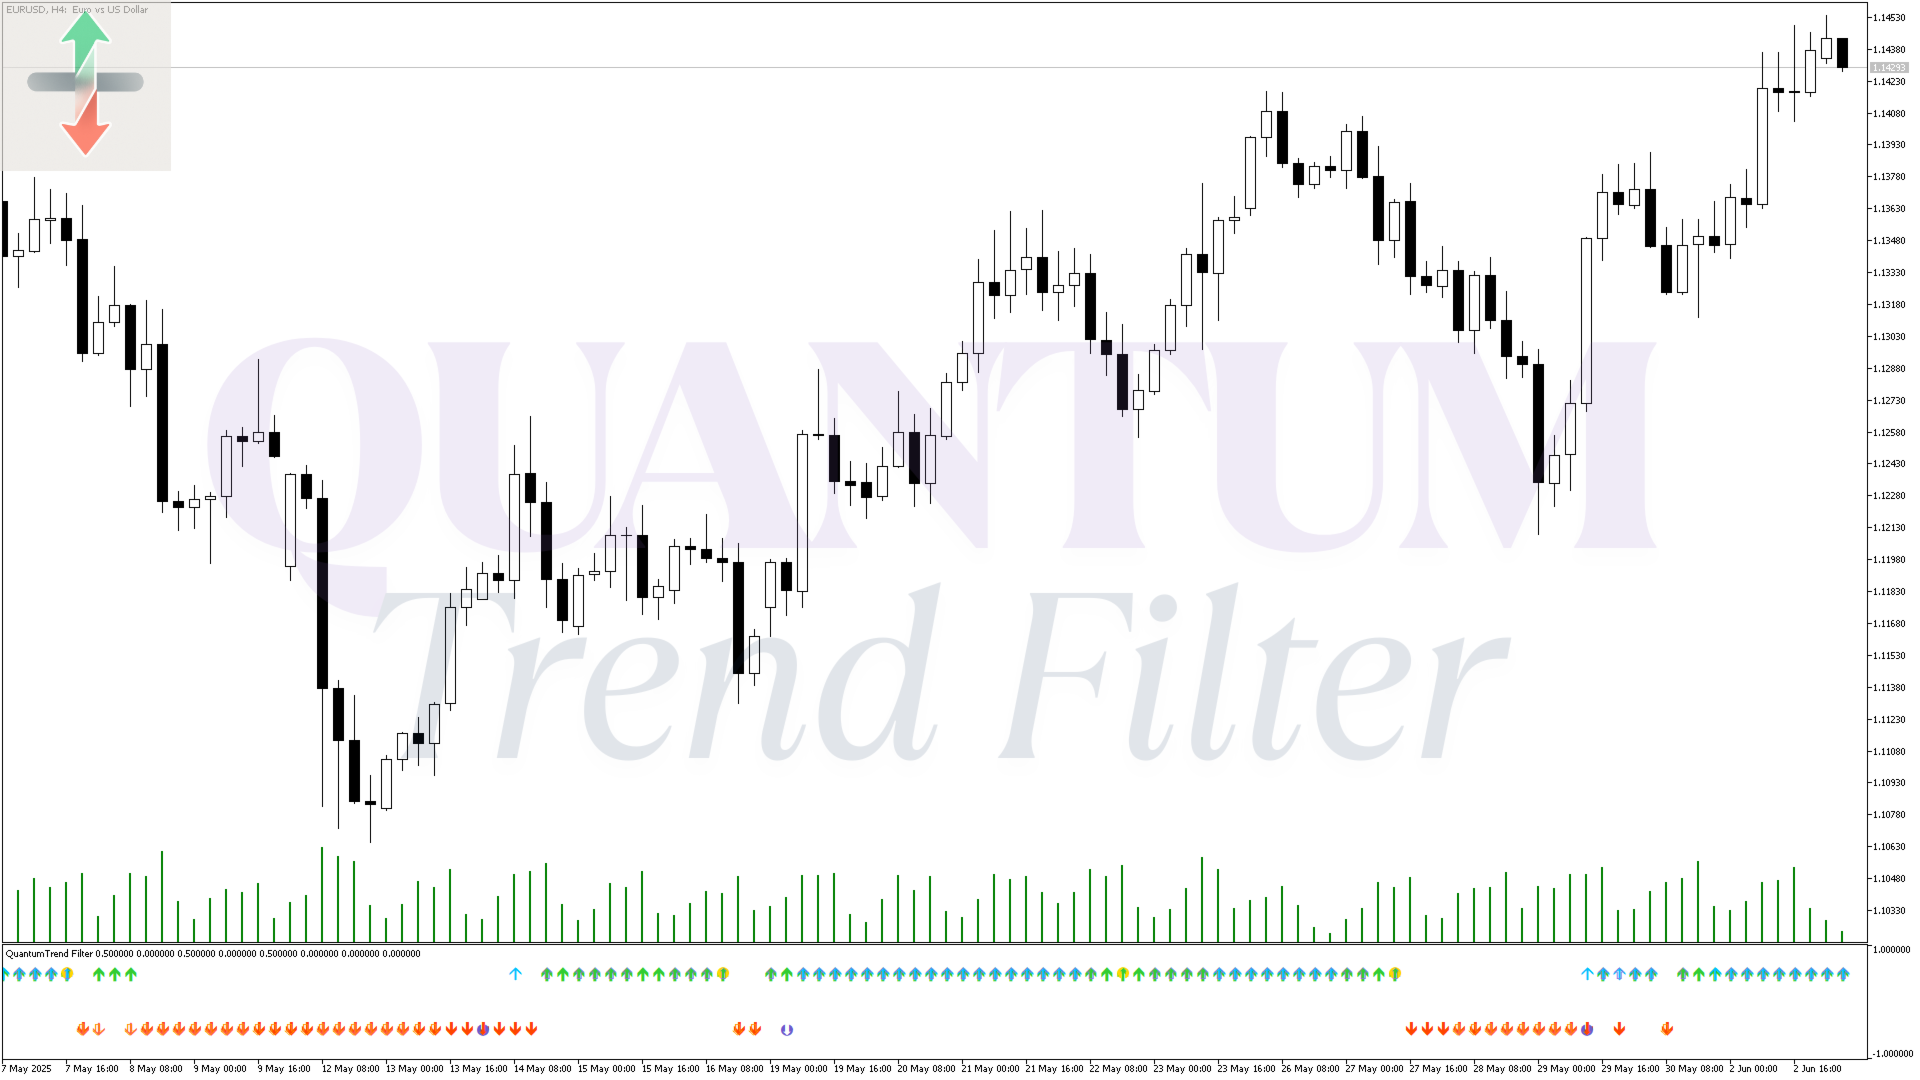
QuantumTrend Filter는 여러 시장 데이터 스트림을 동시에 분석하여 작동합니다. 이동 평균(FasterMA, SlowerMA), MACD, RSI, 모멘텀, DeMarker, ADX 및 Force Index의 신호를 통합합니다. 그런 다음 이러한 분석은 차트에 직접 명확한 시각적 화살표 신호로 통합됩니다(참고: 화살표는 별도의 지표 창에 고정 레벨 +0.5(상승 신호) 및 -0.5(하락 신호)로 표시됨). 다양한 기준에 따라 잠재적인 상승 또는 하락 조건을 나타냅니다.

  • 모멘텀 신호 ( Bullish / Bearish 화살표): 모멘텀 지표를 기반으로 생성됩니다(Bullish의 경우 100 초과, Bearish의 경우 100 이하).
  • 교차 신호 ( CrossBull / CrossBear 화살표): RSI(50 초과/미만), MACD(메인 라인 대 시그널 라인) 및 ADX(DI+ 대 DI-)의 일치를 필요로 하는 합류 신호입니다.
  • 추세 신호 ( TrendBull / TrendBear 화살표): DeMarker(0.5 초과/미만) 및 Force Index(양수/음수) 조건에서 파생됩니다.
  • MA 신호 ( MABull / MABear 화살표): 이 독특한 신호는 다음 바에서 해당 상태의 잠재적 반전 직전에 MA 상태의 지속성을 나타내는 특정 3-바 패턴을 식별합니다. 'i' 바에서 MABull 신호의 경우, FasterMA는 'i-1' 바에서 SlowerMA보다 높았고, 'i' 바에서도 여전히 높으며, FasterMA는 'i+1' 바에서 SlowerMA보다 낮습니다. 이는 'i' 바에 대한 신호가 'i+1' 바가 마감된 후에 확인됨을 의미하며, 이 특정 신호 유형에 대해 1-바 지연을 제공합니다. 알림은 이러한 MA 신호에 연결됩니다.

주요 이점

  • 다중 지표 확인: 여러 유명 지표의 강점을 결합하여 보다 신뢰할 수 있는 추세 식별.
  • 명확한 시각적 신호: 다양한 유형의 상승 및 하락 조건에 대해 별개의 화살표를 표시하여 차트 해석을 단순화합니다.
  • 포괄적인 분석: 추세, 모멘텀 및 거래량 관련 가격 행동 측면을 평가합니다.
  • 사용자 정의 가능한 매개변수: 거래 스타일과 선호하는 자산에 맞게 모든 기본 지표 기간 및 MA 방법을 완전히 사용자 정의할 수 있습니다.
  • 내장 알림: 특정 MA 기반 신호에 대한 사운드 알림을 수신합니다.

이상적인 사용법 및 팁

QuantumTrend Filter는 다목적이며 다양한 거래 전략에 적용할 수 있습니다. 다음은 몇 가지 권장 사항입니다.

  • 시간대: 보다 안정적인 추세 신호를 위해 M15 이상을 권장합니다. 더 낮은 시간대를 사용할 수 있지만 더 빈번하고 신뢰성이 낮은 신호가 발생할 수 있습니다.
  • 자산: 외환 쌍, 상품, 지수 및 암호화폐에 적합합니다.
  • 확인 도구: 신호 검증을 위해 기존 거래 전략 또는 기타 기술 분석 도구와 함께 사용하십시오.
  • 매개변수 조정: 입력 매개변수를 실험하여 선택한 상품의 변동성 및 특성에 가장 적합한 설정을 찾으십시오. 예를 들어, 더 긴 MA 기간 또는 RSI 기간이 더 높은 시간대에 적합할 수 있습니다.
  • 신호 해석: 다양한 유형의 화살표가 합류하는 지점에 주의하십시오. 예를 들어, CrossBull 및 TrendBull 화살표와 함께 나타나는 Bullish 모멘텀 화살표는 단일 화살표보다 강력한 표시를 제공합니다. MABull / MABear 신호는 MA에 의해 정의된 현재 마이크로 추세의 잠재적 종료를 나타내는 특정 패턴 인식입니다.

입력 매개변수

  • FasterMA (기본값: 5): 더 빠른 이동 평균의 기간.
  • SlowerMA (기본값: 15): 더 느린 이동 평균의 기간.
  • MA1_Type (기본값: MODE_EMA): 더 빠른 MA의 방법 (예: 지수, 단순).
  • MA2_Type (기본값: MODE_EMA): 더 느린 MA의 방법.
  • MACD_Fast (기본값: 8): MACD 빠른 EMA 기간.
  • MACD_Slow (기본값: 17): MACD 느린 EMA 기간.
  • MACD_Signal (기본값: 9): MACD 신호 SMA 기간.
  • RSI (기본값: 21): RSI 기간.
  • Momentum (기본값: 14): 모멘텀 기간.
  • DeMarker (기본값: 14): DeMarker 기간.
  • ADX (기본값: 14): ADX 기간.
  • ForceIndex (기본값: 14): Force Index 기간.
  • SoundAlert (기본값: true): MA 신호에 대한 사운드 알림 활성화/비활성화.

면책 조항: 금융 시장 거래에는 상당한 위험이 따릅니다. 과거 성과는 미래 결과를 나타내지 않습니다. 항상 위험 관리 도구를 사용하고 책임감 있게 거래하십시오.

추천 제품
다중 시간대 이동 평균선 지표 다중 시간대 이동 평균선 지표를 사용하여 시장 추세를 더 깊이 이해하십시오. 이 강력한 MQL5 도구를 사용하면 하나의 차트에서 5가지 다른 시간대의 이동 평균선을 동시에 시각화할 수 있습니다. 여러 지표 인스턴스로 작업 공간을 복잡하게 만들지 않고도 다양한 관점에서 가격 역학에 대한 포괄적인 통찰력을 얻을 수 있습니다. 주요 기능: 다중 시간대 분석: 하나의 차트에 다른 시간대(예: M15, H1, H4, D1, W1)의 최대 5개의 이동 평균선을 표시합니다. 사용자 정의 기간: 표시되는 모든 선에 대해 원하는 이동 평균 기간을 쉽게 설정할 수 있습니다. 다양한 MA 유형: 단순(SMA), 지수(EMA), 평활(SMMA), 선형 가중(LWMA)을 포함한 광범위한 이동 평균 유형 중에서 선택하십시오. 조정 가능한 시간대: 모니터링하려는 5가지 시간대를 선택하여 비교할 수 없는 유연성을 제공합니다. 깔끔한 시각화: 여러 추세 관점을 한눈에 확인하여 시간대
Overview TriParity AfterShock PRO Scanner는 MetaTrader 5용 재량형 대시보드 인디케이터입니다. 본 설명에서 triad는 세 개의 통화쌍 또는 종목 간의 관계를 의미합니다. Scanner는 여러 triad와 여러 시간 주기를 하나의 패널에서 검토하며, 트레이더가 관찰 목록을 보다 구조적으로 정리할 수 있도록 돕습니다. 그 목적은 차트 과부하를 줄이고, 후보를 나란히 비교하며, 더 자세히 검토할 가치가 있는 조건을 강조하는 것입니다. 이 제품은 삼각 차익거래를 실행하지 않습니다. 진정한 삼각 차익거래는 세 개의 레그를 거의 동시에 실행해야 하며, 매우 낮은 지연 시간과 매우 작은 거래 비용이 필요합니다. Scanner는 패리티 조정 이후에도 일시적으로 남아 있을 수 있는 왜곡 상태를 재량적으로 검토하기 위해 설계되었습니다. Functions Scanner는 선택된 triad를 여러 시간 주기에 걸쳐 분석하고 NOWCAST를 통해 현재 상태를 표시
Fibrillar
Vitalii Zakharuk
It is very easy to use the Fibrillar indicator, since the simplest is to look at the chart and act according to the indications of the colored arrows. The algorithm takes into account the measurement of prices, and this method also focuses on measuring each of the price drops (H / C, H / O, LC, LO) - which gives more detailed information, but also more averaged. When calculating this indicator, logarithmic gains are first calculated at the closing price, which allows you to filter out the tren
Multi Timeframe Chart
Bekono Owona Roger Blaise
MTFC (Multi Timeframe Chart) – See 2 Timeframes on ONE Chart! "Trade Smarter, Not Harder – Eliminate Timeframe Switching Forever!" Imagine having the power to see any higher timeframe (M5, M15, H1, H4, D1, MN1, etc.) directly on your current chart.   No more flipping between charts, no more guesswork—just   pure trading clarity   in one place. That’s exactly what the   MTFC Indicator   delivers! 1. The Problem It Solves As traders, we know   context is king . But constantly switching between c
CombinerPRO 는 MetaTrader 5용으로 설계된 고급 지표로, 바이너리 옵션, OTC 시장, 파생 자산, 암호화폐 및 외환 거래에 이상적입니다. 여러 기술 필터를 결합하여 CALL 및 PUT 신호를 정밀하게 생성하며, 외부 지표와의 통합을 지원합니다. 실시간 통계 패널과 백테스트 기능을 통해 전략의 효율성을 극대화할 수 있습니다. 주요 기능 ️ 다중 필터 기반 신호 생성 : 이동 평균, RSI, ADX, ATR, 캔들 크기 필터를 결합하여 신뢰도 높은 CALL 및 PUT 신호 생성 ️ iCustom 외부 지표 통합 : 최대 2개의 외부 지표를 추가 검증 필터로 연결 가능 ️ 실시간 통계 패널 : 성공률, 실패율, 최대 6단계 마틴게일 전략 퍼포먼스를 실시간으로 표시 ️ 과거 캔들 백테스트 : 기본 288개의 캔들 분석을 통해 전략 유효성 검증 ️ 신호 간 시간 제어 : 과도한 진입 방지를 위한 신호 간 최소 시간 간격 설정 ️ 다중 시장 호환성 : OTC,
The Market Structures Pro indicator finds and displays 5 (five) patterns of the Smart Money Concepts (SMC) system on the chart, namely: Break Of Structures (BoS)       Change of character (CHoCH) Equal Highs & Lows Premium, Equilibrium and Discount zones with Fibo grid High-high, Low-low, High-low and Low-high extremes Patterns are displayed for two modes - Swing and Internal and are easily distinguished by color on the chart. Internal mode features higher contrast colors, finer lines, and smal
ChartExpert Buy vs Sell Power Visualizer
Everton Fernando Da Silva Messias
매수 vs 매도 세기 시각화 지표 (Buy vs Sell Power Strength Visualizer) "매수 vs 매도 세기 시각화 지표"는 MetaTrader 5 전용 독점 지표로, 시장의 매수와 매도 압력을 직관적인 시각적 경험으로 변환합니다. 매수 세기와 매도 세기를 그래프로 표시하고, 어떤 힘이 우세한지에 따라 차트 배경색을 변경합니다:   초록색   → 매수 세기 우세 (매수 압력)   빨간색   → 매도 세기 우세 (매도 압력)   검은색   → 힘의 균형 트렌드를 빠르게 파악하고 더 확신 있는 결정을 내리고자 하는 트레이더에게 완벽한 도구입니다!   주요 이점 : 시장 세기 즉시 시각화 (복잡한 계산 불필요) 간편한 설정 (주요 매개변수 1개만 조정) 역동적인 배경색으로 차트 이해도 향상 내장된 복제 방지 기능 ️   사용자 정의 가능한 매개변수 : PeriodBuySell   (지표 기간 - 기본값: 13)   사용 방법
BW Indicators
Sergei Gurov
A tool for creating Bill Williams indicators Our tool provides the ability to set Bill Williams indicators on a chart with a mouse click. - The Awesome Oscillator (AO) indicator helps to assess the driving force of the trend. - Alligator indicator — determines the current state of the trend and possible entry and exit points. - Fractals indicator — helps to identify significant levels  - Accelerator Oscillator (AC) indicator — shows the change in trend acceleration. - Market Facilitation Index
FREE
Risk Trend
Vitalii Zakharuk
The Risk Trend indicator simplifies the decision-making process by recognizing reversals using a built-in algorithm and then confirming signals at support/resistance levels. Implements a type of technical analysis based on the idea that the market is cyclical in nature. Thus, the indicator tracks the market trend with great reliability, ignoring sharp market fluctuations and noise around the average price. The indicator can be used both for pips on small periods and for long-term trading.
Gabus Niveles
Gabriel Antonio Diaz Quevedo
Niveles G: Institutional Levels & Volume Profile Map The Edge of Professional Trading Niveles G is not just another indicator; it is a comprehensive mapping tool that automates the identification of high-relevance institutional zones. Professional traders and algorithms don't react to random prices—they react to specific liquidity anchors. Niveles G plots these anchors automatically, keeping your chart clean and your strategy focused. Why These Levels Are Crucial? In trading, these levels repres
Strength Radar2
Erick Guimaraes Dos Santos
Strength Radar 02 – Take Your Trading to the Next Level! Hello, trader! If you're looking for a tool to level up your game in forex, Strength Radar 02 is exactly what you need! Developed with passion and expertise, this indicator turns currency strength analysis into something simple and powerful. With it, you'll have a clear view of the real-time performance of AUD, CAD, CHF, EUR, GBP, NZD, JPY, and USD , using indicators like MA, MACD, RSI , and more — all fully customizable your way! Ima
Supply and Demand Monster
Tsog Erdene Borjigon Enkhkhudulmur
Supply and demand zones are at the heart of   supply and demand trading . These zones are areas that show  liquidity at a specific price.  The supply zone is also called the distribution zone, while the demand zone is called the accumulation zone.   Our indicator automatically draw supply and demand zones in Metatrader 5. It give opportunity to understand trading zone and avoiding risk.
This indicator builds upon the previously posted Nadaraya-Watson smoothers. Here we have created an envelope indicator based on Kernel Smoothing with integrated alerts from crosses between the price and envelope extremities. Unlike the Nadaraya-Watson estimator, this indicator follows a contrarian methodology. Please note that by default this indicator can be subject to repainting. Users can use a non-repainting smoothing method available from the settings. The triangle labels are designed so
Rocket Trend
Andriy Sydoruk
The Rocket Trend indicator is trending. The indicator draws two-color points connected by lines along the chart. This is a trend indicator, it is an algorithmic indicator. It is easy to work and understand when a blue circle appears, you need to buy, when a red one appears, sell. The indicator is used for scalping and pipsing, and has proven itself well. Rocket Trend is available for analyzing the direction of the trend for a specific period of time. Ideal for novice traders learning the laws o
The Absorption & Exhaustion Detector Professional indicator is a sophisticated volume analysis tool designed to identify critical market turning points by analyzing the relationship between price movement and cumulative volume delta (CVD). This indicator helps traders spot when price movements lack volume confirmation, indicating potential absorption or exhaustion zones. KEY FEATURES Real-time Cumulative Volume Delta (CVD) calculation and normalization Price-volume divergence gap measurement dis
FiveStarFX Gold Reversal Edge Professional automated trading solution designed for structured execution and controlled risk management in the Gold market. Built for traders who value discipline, precision, and consistency. Key Features Fully automated trading One trade at a time (controlled exposure) Fixed Stop Loss and Take Profit Smart Break-Even protection Profit lock with buffer Step-based trailing management Spread protection system Works on any broker Trade Management The E
FREE
Go Binary
Fabio Oliveira Magalhaes
The main idea of this product is to generate statistics based on signals from 5 different strategies for the Binary Options traders, showing how the results would be and the final balance based on broker's payout. Strategy 1: The calculation is secret. Strategy 2: The signal is based on a sequence of same side candles (same color). Strategy 3: The signal is based on a sequence of interspersed candles (opposite colors). Strategy 4: The signal consists of the indicators bollinger (we have 3 type
DhanrangSMC
Dharagauri Niteshkumar Rangani
SMC Indicator for MT5 – Trade Like Institutions Unlock the power of institutional trading with the Smart Money Concepts (SMC) Indicator for MetaTrader 5 . Designed for traders who want to go beyond retail strategies, this advanced tool helps you identify market structure shifts, order blocks, liquidity zones, and fair value gaps with precision and clarity. Key Features: Automatic Market Structure Detection : Instantly spot Breaks of Structure (BOS), CHoCH, and trend shifts. Multi-Timeframe
Visual Range Directional Force Indicator
AL MOOSAWI ABDULLAH JAFFER BAQER
Range Directional Force Indicator – Designed for You to Optimize! The Range Directional Force Indicator is a cutting-edge tool designed to empower traders by visualizing market dynamics and directional strength. Built to offer insights into market trends and reversals, this indicator is an invaluable asset for traders seeking precision in their strategies. However, it is important to note that this indicator is not optimized, leaving room for you to tailor it to your unique trading preferences.
Indicator MTF Qristalium Arrows is a semi - automatic trading system. It works on all currency pairs.  The indicator uses three rules: 1) we trade only on the trend, 2)"buy when everyone sells and sell when everyone buys", 3) the Price always goes against the crowd.  Indicator MTF Arrows Qristalium filter rules across multiple time frames using the built-in indicators. If the trend matches on the selected time intervals, the indicator will give an arrow to enter the market. Then you make you
Xtrade Trend Detector
Dago Elkana Samuel Dadie
Xtrade Trend Detector is an indicator capable of finding the best opportunities to take a position in any stock market. Indeed, it is a great tool for scalpers but also for Daytraders. You could therefore use it to identify areas to trade, it fits easily on a chart. I use it to detect trends on Big timeframes and take positions on Small timeframes. Don't hesitate to give me a feedback if you test it.
"Blow It Up!" – The Trading Indicator That Questions Your Life Choices Tired of boring indicators? Meet your new market companion that delivers:   "YOLO BUY!" arrows   when you should probably panic   Explosive rectangle confetti   (because why not?)   200+ soul-crushing quotes   like   "Your stop loss is imaginary"   and   "This isn’t trading, it’s donating to whales"   Random alerts that roast your strategy This Indicator is like Therapy   – Because daytrading shouldn’t feel
SR Regression MT5 – Advanced Trend, Support/Resistance & MTF Sentiment Indicator SR Regression MT5 is a professional multi-functional trading indicator designed for traders who want to combine trend analysis, dynamic support/resistance detection, breakout signals and multi-timeframe sentiment confirmation in one powerful tool. What It Does Automatically draws Linear Regression Channels (small, medium, large trend periods) Detects and merges Support & Resistance levels Generates Buy/Sell break
Fibaction
Abdelkhalek Orabi
Indicator Name: Fibaction – price action candle Detector Description: Fibo Signal Boxes is a powerful Smart Money Concept (SMC)-inspired indicator that auto-detects price action candles. bullish hammers and shooting stars, then draws precise Fibonacci entry zones and multiple take-profit levels directly on the chart. as for the SL personally i use 40 pips rules  Key Features: Detects bullish hammer and shooting star reversal candles. Automatically draws Fibonacci entry and TP boxes. as
Boom Spike System
Claudio Zumerle
Introducing a cutting-edge trading indicator, specifically designed to predict and signal upcoming spikes in Boom 1000 and Boom 500 markets. This innovative tool provides traders with timely alerts, enabling them to capitalize on market movements with precision. Key Features: Accurate Spike Prediction : The indicator utilizes advanced algorithms to identify potential spike occurrences in Boom 1000 and Boom 500 markets. User-Friendly Signals : The indicator generates clear buy signals, allowing t
Multiple TimeFrame MACD Confluency Tool
Kelvin Souza Da Costa Oliveira
Multiple Timeframe MACD indicator. This indicator was built for making multiple timeframe analysis possible in MT5 using MACD Indicator. MACD Indicator traditionally shows two lines and one histogram. MACD Line(Yellow) is calculated by subtracting 12period EMA(fast) from 26period EMA (slow). Signal Line(Blue) is created by a 9period EMA from MACD Line. Histogram is just the difference between MACD and Signal lines. Histogram is colored based on the difference between its value and the previous h
Moving Average Multicurrency Scanner MT5을 소개합니다. 이 최첨단 지표는 다양한 시간대에서 여러 통화 쌍을 모니터링하여 거래 경험을 향상시키도록 설계되었습니다. 이 도구는 이동 평균을 사용하여 추세를 식별하고 정보에 기반한 거래 결정을 내리는 트레이더에게 이상적입니다. Moving Average Multicurrency Scanner MT5을 사용하면 시장 움직임을 손쉽게 분석하고 적시에 신호를 받아 실시간으로 거래 기회를 활용할 수 있습니다. 여러 시간대와 통화 쌍을 원활하게 조정하여 거래 전략을 사용자 정의할 수 있는 능력을 상상해 보세요. MQL 제품 설치 가이드 | MT4/MT5에서 구매한 MQL 제품 업데이트 | 일반 문제 해결 가이드 | 지표 설정 / 가이드 주요 기능 버퍼 통합: 신호 기반 거래 전략을 활용할 수 있도록 지표 값을 접근 가능한 버퍼로 노출합니다. 시각적 화살표 신호: 신호 캔들에서 차트에 직접 Plots 명확한 매수/매도
Gold Targets 5
Sergei Linskii
골드 타겟은 최고의 추세 지표입니다. 지표의 고유한 알고리즘은 기술 및 수학적 분석 요소를 고려하여 자산 가격의 움직임을 분석하고 가장 수익성이 높은 진입점을 결정하며 화살표 및 가격 수준(BUY Entry / SELL Entry) 형태로 신호를 발행합니다. 주문을 엽니다. 표시기는 또한 손절매 가격 수준과 이익 실현을 위한 5가지 가격 수준을 즉시 표시합니다. 주의:   표시기는 사용이 매우 쉽습니다. 한 번의 클릭으로 차트에 표시기를 설치하고 신호 및 가격 수준에 따라 거래하세요. 차트에서는 지표가 설치된 시간대에 관계없이 4개의 시간대(M30 H1 H4 D1)에서 추세 상태가 표시됩니다. 지표의 장점: 1. 표시기는 높은 정확도의 신호를 생성합니다. 2. 표시 신호는 다시 그려지지 않습니다. 가격이 각 라인을 넘으면 소리 알림(알림 및 메시지)이 장착됩니다. 3. 모든 브로커의 MetaTrader 5 거래 플랫폼에서 거래할 수 있습니다. 4. 모든 자산(통화, 금속, 암
Discover and exploit statistical market behavior with a powerful probabilistic pattern analyzer This indicator is a complete solution for studying and trading probabilistic candle patterns . It analyzes historical bullish and bearish sequences to detect high-probability patterns that repeat in the market.  With its pattern editor, built-in strategies and backtesting features, traders can research, test, optimize and operate pattern-based strategies directly on the chart. Main Features -> Advance
Matrix Currency
Augusto Martins Lopes
Matrix Currency – Multi-Timeframe Analysis Tool The Matrix Currency is an advanced indicator designed to analyze currency strength in the Forex market. It provides efficient monitoring and strategic support for traders seeking clear and actionable insights. Key Features Multi-Timeframe Analysis : Simultaneously monitors multiple timeframes (from M1 to MN1) with real-time updates, displayed in an intuitive matrix format. Alert System : Customizable notifications via pop-up, email, and mobile devi
FREE
이 제품의 구매자들이 또한 구매함
SuperScalp Pro
Van Minh Nguyen
5 (14)
SuperScalp Pro – 고급 다중 필터 스캘핑 인디케이터 시스템 SuperScalp Pro는 클래식 Supertrend와 여러 지능형 확인 필터를 결합한 고급 스캘핑 인디케이터 시스템입니다. 해당 인디케이터는 M1부터 H4까지 모든 타임프레임에서 효율적으로 작동하며, 특히 XAUUSD, BTCUSD 및 주요 외환 통화쌍에 적합합니다. 독립형 시스템으로 사용하거나 기존 거래 전략에 유연하게 통합할 수 있습니다. 이 인디케이터는 11개 이상의 필터를 통합하며, 빠른/느린 EMA, 추세 판별용 3개의 EMA, EMA 기울기(EMA slope), RSI, ADX, 거래량(Volume), VWAP, 볼린저 밴드 돌파(Bollinger Bands Breakout) 및 MACD 다이버전스 필터 등을 포함합니다. 스마트 캔들 필터는 캔들 종가를 확인하여 약한 신호를 제거하고, 3 EMA와 MACD 다이버전스 필터를 결합한 추세 인식 메커니즘은 더 높은 승률의 신호를 선별하는 데 도움을 줍니
Azimuth Pro
Ottaviano De Cicco
5 (6)
LAUNCH PROMO Azimuth Pro price is initially set at 299$ for the first 100 buyers. Final price will be 499$ . THE DIFFERENCE BETWEEN RETAIL AND INSTITUTIONAL ENTRIES ISN'T THE INDICATOR — IT'S THE LOCATION. Most traders enter at arbitrary price levels, chasing momentum or reacting to lagging signals. Institutions wait for price to reach structured levels where supply and demand actually shift. Azimuth Pro maps these levels automatically: swing-anchored VWAP, multi-timeframe structure lines, an
Divergence Bomber
Ihor Otkydach
4.9 (86)
이 지표를 구매하신 분께는 다음과 같은 혜택이 무료로 제공됩니다: 각 거래를 자동으로 관리하고, 손절/익절 수준을 설정하며, 전략 규칙에 따라 거래를 종료하는 전용 도우미 툴 "Bomber Utility" 다양한 자산에 맞게 지표를 설정할 수 있는 셋업 파일(Set Files) "최소 위험", "균형 잡힌 위험", "관망 전략" 모드로 설정 가능한 Bomber Utility의 셋업 파일 이 전략을 빠르게 설치, 설정, 시작할 수 있도록 돕는 단계별 영상 매뉴얼 주의: 위의 모든 보너스를 받기 위해서는 MQL5 개인 메시지 시스템을 통해 판매자에게 연락해 주세요. 독창적인 커스텀 지표인 “Divergence Bomber(다이버전스 봄버)”를 소개합니다. 이 지표는 MACD 다이버전스(괴리) 전략을 기반으로 한 올인원(All-in-One) 거래 시스템입니다. 이 기술 지표의 주요 목적은 가격과 MACD 지표 간의 다이버전스를 감지하고, **향후 가격이 어느 방향으로 움직일지를 알려주는
Power Candles MT5
Daniel Stein
5 (7)
Power Candles – 모든 시장을 위한 강도 기반 진입 신호 Power Candles 는 Stein Investments의 검증된 강도 분석을 가격 차트에 직접 제공합니다. 가격 움직임에만 반응하는 대신, 각 캔들은 실제 시장 강도를 기준으로 색상화되어 모멘텀 형성, 강도 가속, 명확한 추세 전환을 즉시 파악할 수 있습니다. 모든 시장을 위한 단일 로직 Power Candles는 모든 거래 심볼 에서 자동으로 작동합니다. 현재 심볼이 Forex인지 비-Forex 시장인지 자동으로 감지하여 내부적으로 적절한 강도 모델을 적용합니다. Forex 및 Gold 는 FX Power Delta 값을 사용합니다 (절대값 범위 최대 100) 지수, 크립토 및 CFD 는 IX Power Strength 값을 사용합니다 (절대값 범위 최대 50) 필요한 강도 계산은 Power Candles에 완전히 내장되어 있습니다. 캔들 색상이나 신호 로직을 위해 추가 인디케이터는 필요하지 않습니다. 가격
Entry In The Zone and SMC Multi Timeframe is a real-time market analysis tool developed based on Smart Money Concepts (SMC). It is designed to analyze market structure, price direction, reversal points, and key zones across multiple timeframes in a systematic way. The system displays Points of Interest (POI) and real-time No Repaint signals, with instant alerts when price reaches key zones or when signals occur within those zones. It functions as both an Indicator and a Signal System (2-in-1), c
Power Bar MT5
Daniel Stein
실제 자금을 투입하기 전에 어떤 전략이 내 심볼에서 효과적인지 확인하세요. Power Bar는 모든 심볼과 모든 타임프레임에서 극단적인 가격 바 를 감지한 다음, 3가지 다른 트레이딩 전략을 즉시 백테스트하여 승률, 수익 팩터, 손익을 나란히 비교할 수 있습니다. 모든 것이 하나의 인터랙티브 패널에 담겨 있습니다. 추측 없음. 커브 피팅 없음. 오직 데이터뿐입니다. Power Bar가 특별한 이유 대부분의 인디케이터는 신호를 주고 그것이 효과가 있는지는 추측에 맡깁니다. Power Bar는 한 걸음 더 나아갑니다 - 모든 신호를 세 가지 전략 에 대해 테스트하고 통계를 보여줍니다. FlipFlop, Momentum, Reversal을 원클릭으로 전환하고 숫자가 즉시 변하는 것을 확인하세요. FlipFlop - 항상 포지션 유지. 신호에 진입하고, 반대 신호에 청산. 당사의 연구에 따르면 US30, US500, DAX와 같은 추세가 있는 지수에서 가장 효과적입니다. Momentum
이 지표를 구매하면 제 프로페셔널 트레이드 매니저를 무료로 드립니다. 우선 이 거래 시스템이 리페인팅, 리드로잉 및 레이그 인디케이터가 아니라는 점을 강조하는 것이 중요합니다. 이는 수동 및 로봇 거래 모두에 이상적인 것으로 만듭니다. 온라인 강좌, 설명서 및 프리셋 다운로드. "스마트 트렌드 트레이딩 시스템 MT5"은 새로운 및 경험이 풍부한 트레이더를 위해 맞춤형으로 제작된 종합적인 거래 솔루션입니다. 10개 이상의 프리미엄 인디케이터를 결합하고 7개 이상의 견고한 거래 전략을 특징으로 하여 다양한 시장 조건에 대한 다목적 선택이 가능합니다. 트렌드 추종 전략: 효과적인 트렌드 추이를 타기 위한 정확한 진입 및 손절 관리를 제공합니다. 반전 전략: 잠재적인 트렌드 반전을 식별하여 트레이더가 범위 시장을 활용할 수 있게 합니다. 스캘핑 전략: 빠르고 정확한 데이 트레이딩 및 단기 거래를 위해 설계되었습니다. 안정성: 모든 인디케이터가 리페인팅, 리드로잉 및 레이그가 아니므로 신뢰
OmniSync Projection
Antonio-alin Teculescu
5 (1)
Chronos Fractal Engine is an innovative price projection indicator for MetaTrader 5, designed to transform your technical analysis by intelligently identifying and projecting historical price patterns. Built upon an advanced correlation algorithm and the fractal principles of the market, this powerful tool visualizes potential future price movements, giving you a unique edge in your trading decisions. What is Chronos Fractal Engine? At its core, the Chronos Fractal Engine employs a sophisticat
Meridian Pro
Ottaviano De Cicco
5 (1)
Meridian Pro: Professional Multi-Timeframe Trend Matrix for MT5 Overview Meridian Pro is a multi-timeframe trend matrix by Merkava Labs that compresses directional state, strength, momentum condition and matrix agreement into one compact panel. One adaptive engine, applied consistently from M1 to W1. No per-symbol tuning. No indicator stacking. One structured readout across every asset and every timeframe. Launch Offer — Get Meridian Pro for USD 99 (introductory). Regular price: USD 149. 1. Why
RelicusRoad Pro MT5
Relicus LLC
5 (24)
RelicusRoad Pro: 퀀트 시장 운영 체제 70% 할인 평생 이용권 (한정 시간) - 2,000명 이상의 트레이더와 함께하세요 왜 대부분의 트레이더는 "완벽한" 지표를 가지고도 실패할까요? 진공 상태에서 단일 개념 만으로 거래하기 때문입니다. 문맥 없는 신호는 도박입니다. 지속적인 승리를 위해서는 컨플루언스(중첩) 가 필요합니다. RelicusRoad Pro는 단순한 화살표 지표가 아닙니다. 완전한 퀀트 시장 생태계 입니다. 독점적인 변동성 모델링을 사용하여 가격이 이동하는 "공정 가치 로드"를 매핑하고, 단순 노이즈와 실제 구조적 돌파를 구분합니다. 추측은 그만두세요. 기관급 로드 로직으로 거래를 시작하세요. 핵심 엔진: "Road" 알고리즘 시스템의 중심에는 시장 상황에 실시간으로 적응하는 동적 변동성 채널인 Road Algo 가 있습니다. 세이프 라인(평형) 과 가격이 수학적으로 반전될 가능성이 높은 확장 레벨 을 투영합니다. Simple Road: 일반적인 시장을 위
FX Trend MT5 NG
Daniel Stein
5 (4)
FX Trend NG: 차세대 멀티 마켓 트렌드 인텔리전스 개요 FX Trend NG 는 다중 시간 프레임 기반의 전문 트렌드 분석 및 시장 모니터링 도구입니다. 몇 초 만에 전체 시장 구조를 파악할 수 있도록 설계되었습니다. 여러 차트를 일일이 전환할 필요 없이, 어떤 종목이 추세에 있는지, 어디에서 모멘텀이 약화되고 있는지, 그리고 어떤 시간 프레임이 서로 정렬되어 있는지 즉시 확인할 수 있습니다. 출시 기념 특별 혜택 – FX Trend NG 를 $30 (6개월) 또는 $80 평생 라이선스 로 이용할 수 있습니다. 이미 Stein Investments 고객이신가요? -> 메시지를 보내 전용 고객 그룹에 참여하세요. 설정이나 사용 방법이 필요하신가요? -> Stein Investments 공식 페이지 를 방문하세요. 1. FX Trend NG가 특별한 이유 3단계 추세 로직 – 단순한 Buy / Sell이 아닙니다 • 대부분의 지표는 Buy 또는 Sell 두 가지 상태만 제
Atomic Analyst MT5
Issam Kassas
3.94 (31)
우선적으로 언급할 점은이 거래 지표가 다시 그리지 않고 지연되지 않으며 이를 통해 수동 및 로봇 거래 모두에 이상적이라는 점입니다. 사용자 매뉴얼: 설정, 입력 및 전략. Atomic Analyst는 가격의 강도와 모멘텀을 활용하여 시장에서 더 나은 이점을 찾는 PA Price Action Indicator입니다. 고급 필터를 장착하여 잡음과 거짓 신호를 제거하고 거래 잠재력을 높이는 데 도움이 됩니다. 복잡한 지표의 다중 레이어를 사용하여 Atomic Analyst는 차트를 스캔하고 복잡한 수학적 계산을 간단한 신호와 색상으로 변환하여 초보 트레이더가 이해하고 일관된 거래 결정을 내릴 수 있도록합니다. "Atomic Analyst"는 새로운 및 경험이 풍부한 트레이더를위한 종합적인 거래 솔루션입니다. 프리미엄 지표와 최고 수준의 기능을 하나의 거래 전략에 결합하여 모든 종류의 트레이더에 대한 다재다능한 선택지가되었습니다. 인트라데이 거래 및 스캘핑 전략 : 빠르고 정확한 일일
Btmm state engine pro
Garry James Goodchild
5 (3)
BTMM State Engine Pro is a MetaTrader 5 indicator for traders who use the Beat The Market Maker approach: Asian session context, kill zone timing, level progression, peak formation detection, and a multi-pair scanner from a single chart. It combines cycle state logic with a built-in scanner dashboard so you do not need the same tool on many charts at once. What it does Draws the Asian session range; session times can follow broker server offset or be set in inputs. Tracks level progression (L
RFI levels PRO MT5
Roman Podpora
3.67 (3)
이 지표는 추세 반전 지점과 가격 반등 영역을 정확하게 보여줍니다.       주요 투자자들   . 새로운 트렌드가 형성되는 곳을 파악하고 최대한 정확하게 의사결정을 내리며 모든 거래를 완벽하게 통제합니다. TREND LINES PRO   지표와 함께 사용할 때 최대의 잠재력을 발휘합니다.  VERSION MT4 지표가 보여주는 내용: 새로운 추세의 시작 시 활성화되는 반전 구조 및 반전 수준. 최소한의 위험 대비 수익률을 갖는 이익 실현   (TAKE PROFIT)   및   손절매(STOP LOSS)   레벨 표시       RR 1:2   . 지능형 손실 감소 로직이 적용된 손절매 기능. 지정된 지표에서 두 가지 추세 유형에 대한 반전 패턴을 표시합니다. 지표: 트렌드를 따라   트렌드 라인 프로   (글로벌 트렌드 변화) 트렌드 프로   (빠른 트렌드 변화) 간단하고 효과적입니다       스캐너       실시간 추세 (신규). 다중 시간 프레임 도구 필터링. 표시하다  
FX Power MT5 NG
Daniel Stein
5 (31)
FX Power: 통화 강세 분석으로 더 스마트한 거래 결정을 개요 FX Power 는 어떤 시장 상황에서도 주요 통화와 금의 실제 강세를 이해하기 위한 필수 도구입니다. 강한 통화를 매수하고 약한 통화를 매도함으로써 FX Power 는 거래 결정을 단순화하고 높은 확률의 기회를 발견합니다. 트렌드를 따르거나 극단적인 델타 값을 사용해 반전을 예측하고자 한다면, 이 도구는 귀하의 거래 스타일에 완벽히 적응합니다. 단순히 거래하지 말고, FX Power 로 더 스마트하게 거래하세요. 1. FX Power가 거래자에게 매우 유용한 이유 통화와 금의 실시간 강세 분석 • FX Power 는 주요 통화와 금의 상대적 강세를 계산하고 표시하여 시장 역학에 대한 명확한 통찰력을 제공합니다. • 어떤 자산이 앞서고 있고 어떤 자산이 뒤처지는지 모니터링하여 보다 현명한 거래 결정을 내릴 수 있습니다. 포괄적인 멀티 타임프레임 뷰 • 단기, 중기 및 장기 타임프레임에서 통화와 금의 강세를
Crystal Heikin Ashi Signals
Muhammad Jawad Shabir
5 (2)
Crystal Heikin Ashi Signals - Professional Trend & Signal Detection Indicator Advanced Heikin Ashi Visualization with Intelligent Signal System for Manual & Automated Trading Final Price: $149 ---------> Price goes up $10 after every 10 sales . Limited slots available — act fast . Overview Crystal Heikin Ashi Signals is a professional-grade MetaTrader 5 indicator that combines pure Heikin Ashi candle visualization with an advanced momentum-shift detection system. Designed for both manual traders
Trend Screener Pro MT5
STE S.S.COMPANY
4.84 (103)
트렌드 표시기, 트렌드 트레이딩 및 필터링을 위한 획기적인 고유 솔루션, 하나의 도구 안에 내장된 모든 중요한 트렌드 기능! Forex, 상품, 암호 화폐, 지수 및 주식과 같은 모든 기호/도구에 사용할 수 있는 100% 다시 칠하지 않는 다중 시간 프레임 및 다중 통화 표시기입니다. Trend Screener는 차트에 점이 있는 화살표 추세 신호를 제공하는 효율적인 지표 추세 추종 지표입니다. 추세 분석기 표시기에서 사용할 수 있는 기능: 1. 트렌드 스캐너. 2. 최대 이익 분석이 있는 추세선. 3. 추세 통화 강도 측정기. 4. 경고가 있는 추세 반전 점. 5. 경고가 있는 강력한 추세 점. 6. 추세 화살표 Trend Screener Indicator가 있는 일일 분석 예, 일일 신호 성능...등은 여기에서 찾을 수 있습니다. 여기를 클릭하십시오. LIMITED TIME OFFER : Trend Screener Indicator는 50$ 및 평생 동안만 사용할 수 있습니다.
Currency Strength Dashboard Pro
Anastasia Danilova
5 (1)
Currency Strength Dashboard Pro MetaTrader 5 를 위한 실시간 통화 강도 분석 전문 대시보드 입니다. 이 지표는 8개의 주요 통화 (EUR, USD, GBP, JPY, CHF, AUD, CAD, NZD)의 강도를 계산하고, 28개의 통화쌍 을 동시에 여러 시간 프레임에서 분석하여 표시합니다. 이 대시보드는 트레이더가 추가 계산이나 여러 차트 간 전환 없이 한눈에 시장 전체 상황을 파악 할 수 있도록 해줍니다. 계산 방법 이 지표는 고급 수학적 통화 강도 분석 방법 을 기반으로 합니다. 이는 유사한 지표에서 널리 사용되는 RSI 기반 방법 보다 더 정확하고 객관적인 결과를 제공합니다. 이 방법은 28개의 모든 통화쌍 간의 관계를 동시에 분석 하여 시장에서 실제로 형성되는 힘의 균형을 보다 명확하고 편향 없이 보여줍니다. 실시간 대시보드 메인 테이블에는 8개의 통화 에 대한 전체 데이터가 표시됩니다. Rank (순위) — 전체 강도 기준 통화 순위, 1
Gann Made Easy MT5
Oleg Rodin
5 (1)
Gann Made Easy 는 mr.의 이론을 사용하여 최고의 거래 원칙을 기반으로 하는 전문적이고 사용하기 쉬운 Forex 거래 시스템입니다. W.D. 간. 이 표시기는 Stop Loss 및 Take Profit Levels를 포함하여 정확한 BUY 및 SELL 신호를 제공합니다. PUSH 알림을 사용하여 이동 중에도 거래할 수 있습니다. 구매 후 거래 방법 안내 및 유용한 추가 지표를 무료로 받으시려면 저에게 연락주세요! 아마도 Gann 거래 방법에 대해 이미 여러 번 들었을 것입니다. 일반적으로 Gann의 이론은 초보자 거래자뿐만 아니라 이미 거래 경험이 있는 사람들에게도 매우 복잡한 것입니다. Gann의 거래 방식은 이론적으로 적용하기 쉽지 않기 때문입니다. 나는 그 지식을 연마하고 Forex 지표에 최고의 원칙을 적용하기 위해 몇 년을 보냈습니다. 표시기는 적용하기가 매우 쉽습니다. 차트에 첨부하고 간단한 거래 권장 사항을 따르기만 하면 됩니다. 지표는 지속적으로 시장 분석
ARICoins
Temirlan Kdyrkhan
ARICoin is a powerful trading companion designed to generate high-probability entry signals with dynamic TP/SL/DP levels based on volatility. Built-in performance tracking shows win/loss stats, PP1/PP2 hits, and success rates all updated live. Key Features: Buy/Sell signals with adaptive volatility bands Real-time TP/SL/DP levels based on ATR Built-in MA Filter with optional ATR/StdDev volatility Performance stats panel (Success, Profit/Loss, PP1/PP2) Alerts via popup, sound, push, or email Cust
HFT Spike Detector
OMG FZE LLC
5 (2)
[ My Products ] , [ My Channel ]   ,  [ LIVE SIGNAL ] HFT Spike Detector HFT Spike Detector는 HFT로 인해 발생하는 급격한 가격 변동을 실시간으로 분석하고 측정하기 위해 개발된 전문적인 틱 모니터링 도구입니다. 목적은 브로커로 인해 발생하는 비정상적인 슬리피지, 유동성 공백 및 밀리초 단위 가격 스파이크를 수치 데이터로 감지할 수 있도록 하는 것입니다. 실시간 틱 흐름과 체결 조건을 분석하기 때문에 백테스트로는 정확하게 평가할 수 없습니다. 이 EA는 자동화를 위해 준비된 세트 파일과 함께 사용할 수 있도록 구매할 수 있습니다:  VolumeHedger EA 작동 원리 이 Expert Advisor는 들어오는 모든 틱을 실시간으로 분석하고: 가격 변화 속도 초당 틱 밀도 슬리피지 크기 같은 방향의 마이크로 흐름 측정하여 차트의 패널에 표시합니다. 이를 통해 스프레드를 제외한 실제 실행 품질을 확인할 수
Market Structure Order Block Dashboard MT5 는 MetaTrader 5용 MT5 인디케이터 로, 시장 구조 및 ICT / Smart Money Concepts에 기반합니다: HH/HL/LH/LL , BOS , ChoCH 뿐 아니라 Order Blocks , Fair Value Gaps (FVG) , 유동성 (EQH/EQL, sweeps), 세션 / Kill Zones , 그리고 Volume Profile 을 통합하여 콤팩트한 컨플루언스 대시보드를 제공합니다. 중요: 본 제품은 분석 도구 입니다. 자동 매매를 실행하지 않습니다( EA가 아님 ). 구매자 보너스 구매 후 제 스토어에서 보너스 인디케이터 2개 를 (선택하여) 무료로 받을 수 있습니다. 보너스 수령 방법: 1) 본 제품에 대한 솔직한 리뷰를 남겨주세요. 2) MQL5 메시지로 BONUS MSOB + 선택한 인디케이터 2개 이름 을 보내주세요. 주요 기능 시장 구조: HH/HL/LH/LL
FX Levels MT5
Daniel Stein
5 (13)
FX Levels: 모든 시장을 위한 뛰어난 정확도의 지지와 저항 간단 요약 통화쌍, 지수, 주식, 원자재 등 어떤 시장이든 믿을 만한 지지·저항 레벨을 찾고 싶나요? FX Levels 는 전통적인 “Lighthouse” 기법과 첨단 동적 접근을 결합해, 거의 보편적인 정확성을 제공합니다. 실제 브로커 경험을 반영하고, 자동화된 일별 업데이트와 실시간 업데이트를 결합함으로써 FX Levels 는 가격 반전 포인트를 파악하고, 수익 목표를 설정하며, 자신 있게 트레이드를 관리할 수 있게 돕습니다. 지금 바로 시도해 보세요—정교한 지지/저항 분석이 어떻게 여러분의 트레이딩을 한 단계 끌어올릴 수 있는지 직접 확인하세요! 1. FX Levels가 트레이더에게 매우 유용한 이유 뛰어난 정확도의 지지·저항 존 • FX Levels 는 다양한 브로커 환경에서도 거의 동일한 존을 생성하도록 설계되어, 데이터 피드나 시간 설정 차이로 인한 불일치를 해소합니다. • 즉, 어떤 브로커를 사용하
Trend indicator AI mt5
Ramil Minniakhmetov
5 (16)
트렌드 인공 지능 지표는 실행 가능한 진입 점 및 반전 경고와 추세 식별을 결합하여 상인의 시장 분석을 향상시킬 훌륭한 도구입니다. 이 표시기는 사용자가 자신감과 정밀도로 외환 시장의 복잡성을 탐색 할 수 있도록 지원합니다 기본 신호 외에도 트렌드 인공 지능 지표는 풀백 또는 되돌림 중에 발생하는 2 차 진입 점을 식별하여 거래자가 기존 트렌드 내에서 가격 수정을 활용할 수 있도록합니다. 중요한 장점: ·작동 4 및 5 *명확한 구매 또는 판매 신호 *다시 칠하지 않습니다 *모든 자산에서 작동 나는 전보 사기에 개 또는 세트를 판매하지 않도록주의. 모든 설정은 블로그에 여기에 무료.  중요! 지침 및 보너스를 얻기 위해 구입 후 즉시 저에게 연락! 진짜 가동 감시는 뿐 아니라 나의 다른 제품 여기에서 찾아낼 수 있습니다: https://www.mql5.com/en/users/mechanic/seller&nbsp ; 설정 및 입력: 모든 자산에 대해 기본 설정을 권
Grabber System MT5
Ihor Otkydach
4.83 (23)
탁월한 기술적 지표인 Grabber를 소개합니다. 이 도구는 즉시 사용 가능한 “올인원(All-Inclusive)” 트레이딩 전략으로 작동합니다. 하나의 코드 안에 강력한 시장 기술 분석 도구, 매매 신호(화살표), 알림 기능, 푸시 알림이 통합되어 있습니다. 이 인디케이터를 구매하신 모든 분들께는 다음의 항목이 무료로 제공됩니다: Grabber 유틸리티: 오픈 포지션을 자동으로 관리하는 도구 단계별 영상 매뉴얼: 설치, 설정, 그리고 실제 거래 방법을 안내 맞춤형 세트 파일: 인디케이터를 빠르게 자동 설정하여 최고의 성과를 낼 수 있도록 도와줍니다 다른 전략은 이제 잊어버리세요! Grabber만이 여러분을 새로운 트레이딩의 정점으로 이끌어 줄 수 있습니다. Grabber 전략의 주요 특징: 거래 시간 프레임: M5부터 H4까지 거래 가능한 자산: 어떤 자산이든 사용 가능하지만, 제가 직접 테스트한 종목들을 추천드립니다 (GBPUSD, GBPCAD, GBPCHF, AUDCAD, AU
Quantum TrendPulse
Bogdan Ion Puscasu
5 (22)
SuperTrend   ,   RSI   ,   Stochastic   의 힘을 하나의 포괄적인 지표로 결합하여 트레이딩 잠재력을 극대화하는 궁극의 트레이딩 도구   인 Quantum TrendPulse를   소개합니다. 정밀성과 효율성을 추구하는 트레이더를 위해 설계된 이 지표는 시장 추세, 모멘텀 변화, 최적의 진입 및 종료 지점을 자신 있게 식별하는 데 도움이 됩니다. 주요 특징: SuperTrend 통합:   주요 시장 추세를 쉽게 따라가고 수익성의 물결을 타세요. RSI 정밀도:   매수 과다 및 매도 과다 수준을 감지하여 시장 반전 시점을 파악하는 데 적합하며 SuperTrend 필터로 사용 가능 확률적 정확도:   변동성이 큰 시장에서 숨겨진 기회를 찾기 위해 확률적 진동   을 활용하고 SuperTrend의 필터로 사용 다중 시간대 분석:   M5부터 H1 또는 H4까지 다양한 시간대에 걸쳐 시장을 최신 상태로 유지하세요. 맞춤형 알림:   맞춤형 거래 조건이 충족되면
Bill Williams Advanced
Siarhei Vashchylka
5 (11)
Bill Williams Advanced is designed for automatic chart analysis using Bill Williams' "Profitunity" system. The indicator analyzes four timeframes at once. Manual (Be sure to read before purchasing) Advantages 1. Analyzes the chart using Bill Williams' "Profitunity" system. Signals are displayed in a table in the corner of the screen and on the price chart. 2. Finds all known AO and AC signals, as well as zone signals. Equipped with a trend filter based on the Alligator. 3. Finds "Divergence Bar
CGE Trading Suite
Carl Gustav Johan Ekstrom
5 (1)
CGE Trading Suite delivers the analytical edge typically reserved for professional trading desks. The platform integrates a full suite of analytical tools into one seamless workflow: dynamic grid mapping, liquidity behavior analysis, ECM, trend lines, MIDAS, trade cycles, and directional channel projections. Together, these provide a unified view of market structure and momentum. Directional clarity is further enhanced by the capital flow index, which measures currency basket strength to identif
ARIPoint
Temirlan Kdyrkhan
ARIPoint is a powerful trading companion designed to generate high-probability entry signals with dynamic TP/SL/DP levels based on volatility. Built-in performance tracking shows win/loss stats, PP1/PP2 hits, and success rates all updated live. Key Features: Buy/Sell signals with adaptive volatility bands Real-time TP/SL/DP levels based on ATR Built-in MA Filter with optional ATR/StdDev volatility Performance stats panel (Success, Profit/Loss, PP1/PP2) Alerts via popup, sound, push, or email Cu
Smart Stop Indicator – 차트 위에서 직접 작동하는 지능형 스톱로스 시스템 개요 Smart Stop Indicator는 감이나 추측이 아닌 명확하고 체계적인 방식으로 스톱로스를 설정하고 싶은 트레이더를 위한 맞춤형 솔루션입니다. 이 도구는 클래식 프라이스 액션 논리(고점, 저점 구조)와 현대적인 브레이크아웃 인식을 결합하여 실제로 가장 논리적인 다음 스톱 레벨을 정확히 식별합니다. 추세, 박스권, 빠른 브레이크아웃 상황 등 어떤 시장에서도 인디케이터는 최적의 SL 구역과 상태(“new”, “broken”, “valid”)를 차트에 직접 표시합니다. 새로운 기능으로 SL 거리의 %ADR 표시가 추가되었습니다. 핵심 기능 자동 시장구조 기반 스톱 설정 • 시장 구조와 실시간 가격 움직임을 기반으로 의미 있는 스톱로스 레벨을 자동으로 탐지합니다. 스마트 브레이크아웃 감지 • 빠른 방향 변화나 돌파 상황에서도 불필요한 조기 스톱 조정을 강요하지 않으며 유연하게 반응합
제작자의 제품 더 보기
DMS Fibo
Diogo Mitsunaga Dos Santos
Fibonacci retracements are trend lines drawn between two significant points, usually between absolute lows and absolute highs, plotted on a chart. Intersecting horizontal lines are placed at the Fibonacci levels. Fibonacci retracements are useful tools that help traders identify support and resistance levels. With the information gathered, they can place orders, identify stop-loss levels, and set price targets. Although useful, traders often use other indicators to make more accurate assessments
Efficient Distance Pro
Diogo Mitsunaga Dos Santos
이피션트 디스턴스 프로: 동적 자동 조정 채널로 트렌드를 탐색하세요 빠른 시장에서는 뒤쳐지고 변동성이 적은 시장에서는 실패하는 정적 이동 평균으로 추측하는 것을 멈추십시오. 이피션트 디스턴스 프로는 시장 역학에 대한 더 명확한 시각을 제공하도록 설계된 고급 리페인트 없는 채널 지표입니다. 실시간으로 변동성에 적응하여 독특하게 계산된 기준선 주위에 동적 채널을 생성하여 더 큰 확신을 가지고 높은 확률의 진입 및 청산 지점을 식별하는 데 도움을 줍니다. 작동 방식 지표의 핵심은 이피션트 디스턴스 라인 입니다. 전통적인 이동 평균과 달리, 그 계산은 가격 변동성에 의해 가중됩니다. 조용한 시장에서는 부드러운 평균처럼 작동합니다. 변동성이 큰 시장에서는 더 반응성이 좋아져 가격 움직임을 더 가깝게 따라갑니다. 이 핵심 라인은 기울기에 따라 색상이 변경되어 즉각적인 추세 방향 피드백을 제공합니다. 핵심 라인 주위에는 두 개의 변동성 밴드 가 있습니다. 이 밴드들은 최근 가격 변동성(표준 편차
필터:
리뷰 없음
리뷰 답변