Flying Volume

1

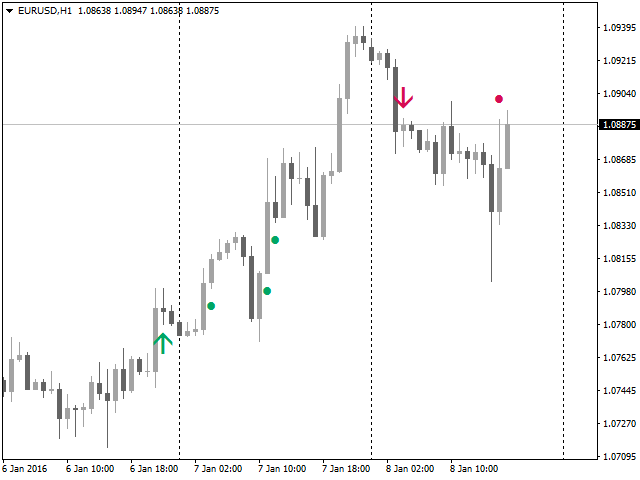
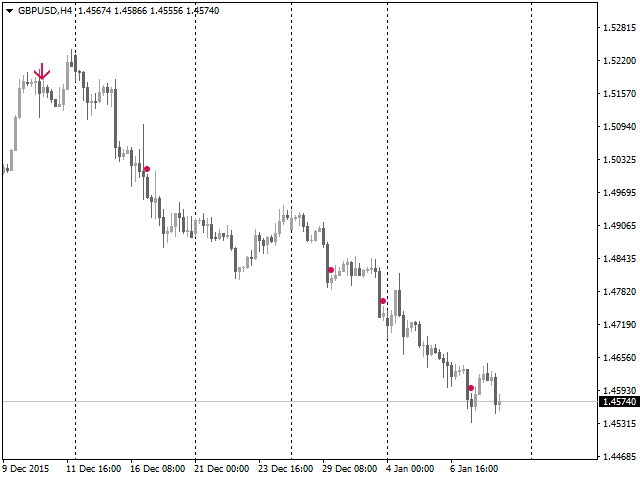
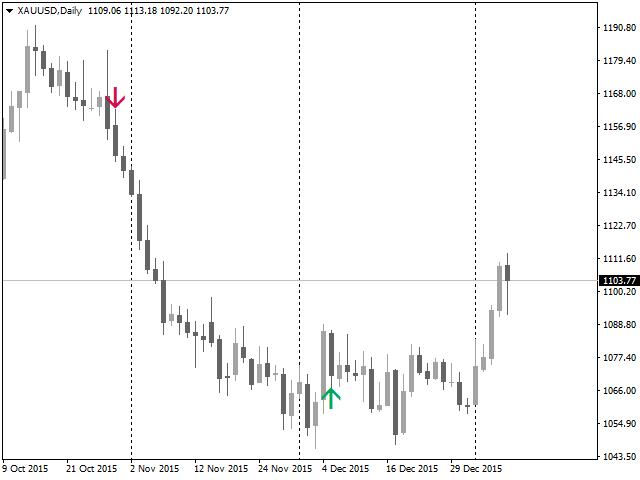
The Flying Volume indicator is a specialized volume indicator. It deciphers the volume data after heavy proprietary number crunching. When a main signal is found Flying Volume will look for possible continuation points. The main signal is shown by arrows, the continuation points by dots.

Volume indicators are most often used on higher timeframes.


Features

  • Main Buy or Sell signals
  • Continuation signals
  • No repainting
  • One signal per bar


Settings

Flying Volume default settings are good enough most of the time. Feel free to fine tune them to your needs.

  • Period - The averaging period for signal calculation. Set higher for less and (arguably) better signals.
  • Continuation points? - Set to true to show continuation points.
  • Color Palette - pick Color Palette for 'Dark' or 'Light' Backgrounds.
  • Colo(u)rs - you know what to do.
  • Show Alerts - set to true to do alerts.
  • Show Screen Alerts - set to true to show screen alerts.
  • Email Alerts - set to true to email alerts.
  • Push Alert Notifications - set to true to push alerts.


Loose ends

Flying Volume is not resource hungry.

Do not hesitate to contact me. Let me know what you think of Flying Volume. Only with your help, I can create better tools for MT4.
추천 제품
MT4용 Crypto_Forex 지표 "추세 진입 히스토그램", 리페인트 없음. - 추세 진입 히스토그램 지표는 Entry_bar가 나타나면 추세 방향 진입 신호를 찾는 데 사용할 수 있습니다. - 이 지표는 가격과 거래량을 모두 고려하여 계산하는 고유한 특징을 가지고 있습니다. - 추세 진입 히스토그램은 두 가지 색상으로 제공됩니다. 빨간색은 약세 추세, 파란색은 강세 추세입니다. - 안정적인 추세(동일한 색상의 히스토그램 막대가 최소 10개 연속 표시)가 나타나면 Entry_bar가 표시될 때까지 기다리세요. - 진입 신호는 히스토그램에서 반대 색상의 열 하나와 초기 추세 색상의 다음 열입니다(그림 참조). - 숏 목표가를 사용하세요. 현재 추세에 따라 차트에서 가장 가까운 고가/저가를 사용하세요. - 지표에는 모바일 및 PC 알림 기능이 내장되어 있습니다. 사용 방법: - 매수 신호: 안정적인 강세 추세(파란색 히스토그램 막대) + 히스토그램의 빨간색 막대 1개 + 파란색 막
Fibo Linear Channel
Igor Semyonov
4 (1)
Colored indicator of the linear channel based on the Fibonacci sequence. It is used for making trading decisions and analyzing market sentiment. The channel boundaries represent strong support/resistance levels, as they are the Fibonacci proportion levels. Users can select the number of displayed lines of channel boundaries on the chart by means of the input parameters. Attaching multiple instances of the indicator to the chart with different calculation periods leads to displaying a system of c
This is a simple PriceTMA bands, non repaint! it can be used for a trend following system or sometimes reversals. as a main signal or a filter for others strategies, it depends on the trader main strategy. calculations for this indicator are a combined Algorithm between moving averages "MA" and average true range"ATR". good luck with your trading! i hope it is helpful Cheers
Jerk Trend
Ivan Simonika
Jerk Trend is a new product that allows you to identify the current market phase (uptrend, downtrend or flat). Represents a typical investor strategy that usually indicates a trend change from bearish to bullish. A tool that allows you to determine the direction and strength of a trend. Unlike most indicators, Jerk Trend finds longer-term trends and gives fewer false signals. This indicator displays arrows of different colors depending on the current state of the market and thus signals the us
Arbitrage Macd
Muhammed Emin Ugur
Arbitrage MACD: Your Key to Analyzing Market Trends The Arbitrage MACD is a cutting-edge indicator designed to assist traders and investors in analyzing market trends with greater precision and confidence. MACD, which stands for Moving Average Convergence Divergence, is a well-known and widely used tool in the financial world, and the "Arbitrage MACD" takes its functionality to the next level. This innovative indicator offers a comprehensive analysis of the relationship between two moving ave
Implement
Vitalii Zakharuk
5 (1)
Implement analyzes market dynamics for pivot points. If you want to learn how to spot the correct reversals for consistently likely profitable trading, buy this indicator. Shows favorable moments of entering the market in stripes. Ready-made trading system. The principle of operation of the indicator is to automatically determine the current state of the market when placed on a chart, analyze historical data based on historical data and display instructions for further actions on the trader's
Your swiss army knife to ancipate price reversals This indicator anticipates price reversals analyzing bullish and bearish pressure in the market. The buying pressure is the sum of all the accumulation bars over a certain number of days, multiplied by the volume. The selling pressure is the sum of all of the distribution over the same number of bars, multiplied by the volume. It gives you a measure of the buying pressure as a percentage of the total activity, which value should fluctuate from 0
FREE
Fasb1a
Li Qiang Tang
欢迎来到本产品界面 指标,简单可观,直接加载即可,对于趋势有一定的把握及反转。 本指标可在Taxcr EA工具中使用,作为开初始单依据,单次运用,非循环开单!伙伴们可以去了解 axcr EA工具。 IWelcome to the product interface Indicators, simple and considerable, can be loaded directly, and have a certain grasp and reversal of the trend. This indicator can be used in Taxcr EA tool as the basis for initial billing, single use, non cyclic billing!
The indicator identifies ordered trend structures. Each structure consists of at least three waves: the formation of the primary movement, a rollback, and a breakout of the primary movement. One wave in the structure is considered to be the market movement between opposite price extremes, which corresponded to different positions of the points of the classic Parabolic Support And Reverse (PSAR) indicator relative to the closing prices of the candles: a point below the price - searching for a m
KFX Symbol Changer
Peter Kariuki Thande
4 (1)
KFX SMA: Symbol Changer + Moving Average (3x) + ATR + RSI + Candle Timer. This indicator allows you to create a Symbol list and change between symbols of the current chart or Timeframe by selecting the appropriate button. On Chart there are three(3) multi timeframe Moving Averages shown (selected by you), ATR Value MTF ( selected by you -  helps with setting SL and TP), RSI Value MTF (selected by you) and a Candle Timer.   Features: - Symbol Changer : Change Symbol and Timeframe of Chart.   (s
FREE
Hydra Trend Rider
INTRAQUOTES
5 (4)
Hydra Trend Rider is a non-repainting, multi-timeframe trend indicator that delivers precise buy/sell signals and real-time alerts for high-probability trade setups. With its color-coded trend line, customizable dashboard, and mobile notifications, it's perfect for traders seeking clarity, confidence, and consistency in trend trading. Setup & Guide:  Download  MT5 Version here. To learn how to use the Indicator: Indicator Manual & Guide -   Read Here Exclusively for you: It's your chance to st
Mini FFMV Dashboard and CSM
Opengates Success International
1 (1)
Mini Forex Market-View Dashboard and Mini-CSM Mini Full Forex Market View Dashboard is a miniature creation of FULL FOREX MARKET_VIEW Custom indicator created to give the Traders a full view of what is going on in the market but in a partial matter to make it conscise. It is useful most especially for those who don't like bogus indicators or those who have a PC with limited screen size. It uses a real time data to access the market and display every bit of information needed to make a successful
Super volumes
Yerzhan Satov
4 (1)
The arrow indicator for Forex and Binary options is based on tick volumes. Unlike many volume indicators, the "Super volumes" indicator calculates bullish and bearish volumes and gives signals based on the predominance of any of them. If, say, there was an advantage of bullish volumes in this range at the moment, then the signal will be on Buy. Or if the predominance was bearish volumes, then, accordingly, the signal will be on Sell. In the indicator settings in the "volumes" variable, you can
NIGHTCrusher
Christian Opperskalski
4 (1)
NIGHTCRUSHER is a fully automated expert advisor, designed for scalping on quite market situation. you can also run different strategies like swing trading or grid different Trade Entry Signals different Exit Strategies included (MA Cut / Signal Change / Trailing TP) clever Risk & Money management - Balance based - Longrun trades tracking You can also use a Grid function or Lot multipier, if needed News Feature included - to protect you of miss trades in news times Important: Get informed about
Currency StrengtT
Hafis Mohamed Yacine
What Is Currency StrengtT Indicator? A currency strengthT indicator is a graphical tool that shows the strength of a currency. Common indicators usually show the strength of a currency in relation to another currency, however, with some calculations it is possible to find the absolute strength of each individual currency. Therefore, a currency strength matrix indicator (or meter) is a tool that tries to express the absolute strength of a currency, so that you can compare this strength with the
Pyro Trend
Oleksii Ferbei
Pyro Trend is a new product that allows you to identify the current market phase (uptrend, downtrend or flat). The indicator is applicable for any data and periods. The middle of the trend wave, as well as the edges, are places of special heat and market behavior; when writing the indicator, an attempt was made to implement precisely finding the middle. Pyro Trend is a trend indicator that uses an original calculation algorithm. This indicator paints arrows in different colors depending on the
Boost binary option profesional
Sebastian Alejandro Merino Sepulveda
Binarias & Forex (+90% Ratio-Win Next Candle) Espere que el precio llegue a una buena zona (fuerte) sea soporte, resistencia, zona de oferta o demanda, fibonacci level key, cifra redonda. Haciendo lo anterior definitivamente habrá una reversión en el precio y obtendrá su ITM en primera vela dando una efectividad del 100% siguiendo la tendencia. Es muy importante estar atento a las noticias fundamentales en el mercado y estas no afecten tu trading. Sesiones comerciales: cualquiera (24 horas).
Trend MagicX
Hafis Mohamed Yacine
A trending market is one in which price is generally moving in one direction. ... When trading a trend-based strategy, traders usually pick the major currencies as well as any other currency utilizing the dollar because these pairs tend to trend and be more liquid than other pairs.  Best Trend Indicator That Tells You the Direction of the Trend   Trend MagicX_v1.1 displays the trend direction, duration, intensity and the resulting trend rating for all time frames in real time. You'll see at a
The indicator allows you to trade binary options. The recommended time frame is М1 and the expiration time is 1,2,3 minutes. The indicator suitable for auto and manual trading. A possible signal is specified as a arrows above/under a candle. You should wait until the candle closes! Arrows are not re-painted Trade sessions: TOKYO section (Half-end) Currency pairs: USD/JPY Working time frame: M1 Expiration time: 1,2,3 minutes. The indicator also shows good results when using the martingale strateg
FREE
15 years old, 15 years old, 15 years old. 2024 years ago: ️ What to do next. I want to know what I want to know. Sorry, I don't know what to do. I want to know, I want to know, I want to know. I want to know what I want to know. I want to know what I want to know. H4(단지 M1에서 M30) I'm here. I'm here. I want to know what I want to know. I want to know what I'm saying. I want to know what I want to know. I want to know what I want to know. I want to know what I want to know. I want to
Trade History Drawer
David Leander Tschacher
Trade History Drawer is an indicator for MetaTrader 4. It shows trades on the chart and draws them in customized colors. Furthermore, the indicator shows a trade summary and saves a CSV history file for either one selected pair or all pairs. Inputs General Settings Number Trades : Number of trades to be drawn on the chart, if -1 then all trades Magic Number : Only trades with this magic number, if -1 then ignore Line Style : Line Style Line Thickness : Line Thickness Arrow Size : Arrow Size
R Var 이동 평균 지표는 완고한 추세 추종자를 위해 설계된 추세 추종 지표입니다. 그것은 주식 거래자뿐만 아니라 상품 거래자 사이에서 꽤 인기있는 외환 거래 지표이며 그 인기는 사용자에게 진정한 돈 버는 신호를 전달하는 능력에서 비롯됩니다. 표시기는 시에나 라인에 배치된 녹색 및 빨간색 점으로 구성됩니다. 녹색 점은 강세 신호를 가리키고 빨간색 점은 약세 신호를 나타냅니다. 기본 거래 신호 매수 신호: 지표의 시에나 선에 있는 점이 녹색으로 바뀌면 매수하세요. 매도 신호: 지표의 시에나 선에 있는 점이 빨간색으로 바뀌면 매도하십시오. 매수 거래 종료: 강세 추세가 진행되는 동안 표시기의 시에나 라인에 빨간색 점이 나타나면 모든 매수 주문을 닫습니다. 매도 거래 종료: 약세 추세가 진행되는 동안 R Var 이동 평균 지표의 시에나 선에 녹색 점이 표시되면 모든 매도 주문을 마감합니다. 팁 R Var 이동 평균 지표를 사용할 때 잘못된 신호를 방지하기 위해 적당한 손절매를
FREE
MT Scanner
Niravkumar Maganbhai Patel
4 (2)
This indicator helps you to Scan symbols which are in the Market Watch Window  and filter out trends with alerts. It works based on the effective indicator "SUPERTREND" which is used by many traders for trading: When box color changes to " Green " or " Red " color, it indicates you for trend change for long and short entry. And also you will get alerted on screen. When it changes to " Green ", it indicates you that trend is going upwards, and you can take the long entry. If the color changes to
FREE
Sarangani Venom
Sherwin Dennis Tava Ruiz
sarangani venom is 100% profitable, easy to use indicator, a chart without indicator is stressful and will lead you to many losses, this indicator is pleasing to the eye that will gives you more confident to trade when there is signal, your computer will gives sound and the spider will animate, it can be used to all time frame and to all currency, you have many options, when the candlestick touches to upper line it is buy, when it touches to lower line it is sell, when the rope is pull to buy ar
The new update makes this indicator a complete tool for studying, analyzing and operating probabilistic patterns. It includes: On-chart Multi-asset percentage monitor. Configurable martingales. Twenty-one pre-configured patterns , including Mhi patterns and C3. An advanced pattern editor to store up to 5 custom patterns. Backtest mode to test results with loss reports. Trend filter. Hit operational filter. Martingale Cycles option. Various types of strategies and alerts. Confluence between patte
Daily Volatility Tracker is a practical and lightweight indicator designed to help traders monitor and analyze market volatility based on historical daily price movements. Whether you're a day trader, swing trader, or scalper, understanding how much a market moves per day is critical for: Choosing the right pairs to trade Setting accurate stop-loss and take-profit levels Adapting to changing market conditions MT5 Version -  https://www.mql5.com/en/market/product/134960/ Join To Learn Market Dept
FREE
Holy Trinity Volatility Indicator This indicator reflects the peak time of the day wherein there's is expected to be sharp price actions. It also presents the markets as just waking up from the dull and less volatile Asian (and or London) trading sessions into a bustling time of highly liquid price flows. NOTE: This indicator informs the trader ahead of peak price movements - one bar just before the real actions starts. Enter when the volatility line falls below the Tripple Exponential Moving Av
The Auto Fibonacci Indicator is a professional technical analysis tool that automatically draws Fibonacci retracement levels based on the most recent closed Daily (D1) or 4-Hour (H4) candle. These levels are widely used by traders to identify key support , resistance , and trend reversal zones . This version is designed for manual trading and supports a powerful trading strategy using Fibonacci levels combined with a 50-period EMA (Exponential Moving Average) , which you can easily add from MT4
FREE
Banev EA
Akram Azizi
This Expert uses multiple indicators and special algorithm to choose the entry points and provide the maximum Gain with the minimum Risk . Run the BackTest and check the efficienty of the product. Working Conditions : This EA works on all Pairs on 15M Timeframe. With 1000 $ Balance Input Parameters : Trading Mode : Choose between 3 modes. AutoManagement : The lot will increase with the increasing of the balance. Trading Lot : The Lot is set manually. Take Profit : Set it by points. Spread
This trading expert advisors is an clone & upgrade of  "EA Rough Duster ", also trades best on GBPNZD minute 5 timeframe. Maintains a constant account growth and runs best on low spread and commission based accounts. Uses Martingale & perfect hedging to recover unprofitable positions ensuring no loss. Its consistent profit curves,low DrawDowns & risk proves the record for itself in reliability and consistency plus its unique market analysis ensures quick extraction of profits by scalping the mar
이 제품의 구매자들이 또한 구매함
Scalper Inside PRO
Alexey Minkov
4.74 (69)
Scalper Inside PRO – Since 2020. An exclusive indicator that utilizes an innovative algorithm to swiftly and accurately determine the market trend. The indicator automatically calculates opening, closing, and profit levels, providing detailed trading statistics. With these features, you can choose the most appropriate trading instrument for the current market conditions. Additionally, you can easily integrate your own arrow indicators into Scalper Inside Pro to quickly evaluate their statistics
Gann Made Easy
Oleg Rodin
4.83 (162)
Gann Made Easy 는 mr.의 이론을 사용하여 최고의 거래 원칙을 기반으로 하는 전문적이고 사용하기 쉬운 Forex 거래 시스템입니다. W.D. 간. 이 표시기는 Stop Loss 및 Take Profit Levels를 포함하여 정확한 BUY 및 SELL 신호를 제공합니다. PUSH 알림을 사용하여 이동 중에도 거래할 수 있습니다. 구매 후 거래 방법 안내 및 유용한 추가 지표를 무료로 받으시려면 저에게 연락주세요! 아마도 Gann 거래 방법에 대해 이미 여러 번 들었을 것입니다. 일반적으로 Gann의 이론은 초보자 거래자뿐만 아니라 이미 거래 경험이 있는 사람들에게도 매우 복잡한 것입니다. Gann의 거래 방식은 이론적으로 적용하기 쉽지 않기 때문입니다. 나는 그 지식을 연마하고 Forex 지표에 최고의 원칙을 적용하기 위해 몇 년을 보냈습니다. 표시기는 적용하기가 매우 쉽습니다. 차트에 첨부하고 간단한 거래 권장 사항을 따르기만 하면 됩니다. 지표는 지속적으로 시장 분석
M1 Sniper
Oleg Rodin
5 (22)
M1 SNIPER 는 사용하기 쉬운 거래 지표 시스템입니다. M1 시간대에 맞춰 설계된 화살표 지표입니다. 이 지표는 M1 시간대 스캘핑을 위한 단독 시스템으로 사용할 수 있으며, 기존 거래 시스템의 일부로도 사용할 수 있습니다. 이 거래 시스템은 M1 시간대 거래용으로 특별히 설계되었지만, 다른 시간대에도 사용할 수 있습니다. 원래는 XAUUSD와 BTCUSD 거래를 위해 이 방법을 설계했지만, 다른 시장 거래에도 유용하다는 것을 알게 되었습니다. 이 지표의 신호는 추세 방향과 반대로 거래될 수 있습니다. 저는 지표의 신호를 활용하여 양방향으로 거래할 수 있도록 돕는 특별한 거래 기법을 알려드립니다. 이 방법은 특별한 동적 지지선과 저항선 가격 영역을 활용하는 것을 기반으로 합니다. 구매하시면 M1 SNIPER 화살표 지표를 바로 다운로드하실 수 있습니다. 또한, 아래 스크린샷에 표시된 Apollo Dynamic SR 지표는 M1 SNIPER 도구를 사용하는 모든 사용자에게 무료로
GoldRush Trend Arrow Signal
Kirk Lee Holloway
5 (2)
GoldRush 트렌드 화살표 신호 GoldRush 트렌드 화살표 신호 지표는 XAU/USD 시장에서 고속 단기 스캘핑 트레이더를 위해 설계된 정밀한 실시간 트렌드 분석을 제공합니다. 1분 시간대에 특화되어 설계된 이 도구는 명확한 진입점을 표시하는 방향성 화살표를 제공하여 스캘퍼들이 변동성이 높은 시장 환경에서도 자신 있게 거래할 수 있도록 합니다. 이 지표는 PRIMARY 및 SECONDARY 경고 화살표로 구성됩니다. PRIMARY 신호는 추세 방향의 변화를 나타내는 흰색과 검은색 방향성 화살표이며, SECONDARY 신호는 PRIMARY 화살표가 지시하는 방향을 확인하고 잠재적인 거래 진입점을 표시하는 파란색과 빨간색 화살표입니다. 참고: 추세 방향이 변경된 후 PRIMARY 경고 화살표가 단 하나만 표시될 경우, 다수의 SECONDARY 파란색/빨간색 화살표가 표시될 수 있음을 유의해야 합니다. SECONDARY 신호는 신호 기준을 충족하는 어떤 캔들 이후에도 표시
PRO Renko System
Oleg Rodin
5 (30)
PRO Renko System 은 RENKO 차트 거래를 위해 특별히 고안된 매우 정확한 거래 시스템입니다. 이것은 다양한 거래 상품에 적용될 수있는 보편적 인 시스템입니다. 체계는 효과적으로 당신에게 정확한 반전 신호에 접근을 주는 소위 시장 소음을 중화합니다. 이 표시기는 사용하기가 매우 쉽고 신호 생성을 담당하는 매개 변수가 하나만 있습니다. 당신은 쉽게 당신의 선택의 어떤 무역 계기에 공구를 적응시킬 수 있고 renko 막대기의 크기. 나는 항상 당신이 내 소프트웨어로 수익성있게 거래 할 수 있도록 추가 지원을 제공 할 준비가되어 있습니다! 나는 당신에게 행복하고 수익성있는 거래를 기원합니다! 구매 후 저에게 연락하십시오! 내 렌코 차트 생성기를 보내드립니다. 또한 내 개인 권장 사항 및 시스템의 다른 모듈을 무료로 공유 할 것입니다!
Market Makers
Mohamed Hassan
5 (4)
After purchase, contact me privately to receive 1 month of free testing with EA Forex Proton! This advanced MT4 trading robot automatically executes signals from any MT4 indicator, including Market Makers. The latest version also includes AI integration, allowing each trade signal to be analyzed using Artificial Intelligence. Live Signal with EA Forex Proton: Click here Market Makers is a powerful price action trading system designed to identify high-probability Buy and Sell opportunities based
KuKl
IGOR KIRIANEN
The indicator is built on a non-standard Zig Zag, it draws accumulations after which if the price leaves this zone and a test of this zone occurs, then a sound signal is given and an arrow appears - after the test candle closes.The indicator does not redraw its signals, it is very easy to use, there are only three settings 1- this is the zig zag parameter 2- this is the minimum price exit from the zone 3- this is the maximum price exit from the zone. The lower the parameter for Zig Zag, the more
Advanced Supply Demand
Bernhard Schweigert
4.91 (300)
현재 40% 할인! 초보자나 전문 트레이더를 위한 최고의 솔루션! 이 보조지표는 우리가 다수의 독창적 기능과 새로운 공식을 통합한 독특하고 고품질이며 저렴한 거래 도구입니다. 이 업데이트를 통해 이중 시간대를 표시할 수 있습니다. 더 높은 TF를 표시할 수 있을 뿐만 아니라 차트 TF와 더 높은 TF 모두를 표시할 수 있습니다: 중첩 영역 표시. 모든 Supply Demand 트레이더들이 좋아할 것입니다. :) 중요한 정보 공개 Advanced Supply Demand의 잠재력을 극대화하려면 다음을 방문하십시오. https://www.mql5.com/ko/blogs/post/720245   진입 또는 목표의 명확한 트리거 포인트를 정확히 찾아냄으로 해서 거래가 어떻게 개선될지 상상해 보십시오. 새로운 알고리즘을 기반으로 매수자와 매도자 간의 잠재적인 불균형을 훨씬 더 쉽게 분간할 수 있습니다. 왜냐하면 가장 강한 공급영역과 가장 강한 수요 영역과 과거에 어떻게 진행 되었는지를(이전
Cyclic Impulse
Vitalyi Belyh
차트를 구조화하고 주기적인 가격 변동을 식별하는 기술 지표입니다. 모든 차트에서 작업할 수 있습니다. 다양한 유형의 알림. 그래프 자체에도 추가 화살표가 있습니다. 역사를 재구성하지 않고, 촛불을 닫는 작업에 임한다. M5 이상에서 권장되는 TF입니다. 사용 및 구성이 쉬운 매개변수입니다. 매개변수가 다른 2개의 지표를 사용하는 경우, 다른 지표 없이 해당 지표만 사용할 수 있습니다. 2개의 입력 매개변수가 있습니다 주기성과 신호 지속 시간 이 2개의 매개변수는 차트 구조의 처리와 관련이 있습니다. Cyclicity - 역전 주기가 얼마나 자주 바뀌는지 조절하고 주기를 매끄럽게 합니다. Signal duration - 최소 숫자에서는 가격 움직임의 충격을 감지하고, 최대 숫자에서는 장기적 추세 움직임을 감지합니다.. --------------------------------
NAM Divergences
NAM TECH GROUP, CORP.
5 (1)
MT4 Multi-timeframe Divergence and Overbougt/Oversold detection indicator. Features - Fully customizable on chart control panel, provides complete interaction. - Hide and show control panel wherever you want. - Real time information about non-capitalized divergences. - Real time information about overbougt / oversold situations. - Real time information about regular divergences. - Real time information about hidden divergences. - Oscillators available for divergences detection: AO, RSI, CCI, MA
Advanced Currency IMPULSE with ALERT
Bernhard Schweigert
4.9 (490)
현재 40% 할인!! 초보자 또는 전문가 트레이더를 위한 최고의 솔루션! 이 지표는 우리가 독점 기능과 비밀 공식을 통합했기 때문에 독특하고 고품질이며 저렴한 거래 도구입니다. 단 하나의 차트로 28개 통화 쌍 모두에 대한 경고를 제공합니다. 새로운 추세 또는 스캘핑 기회의 정확한 트리거 포인트를 정확히 찾아낼 수 있기 때문에 거래가 어떻게 개선될지 상상해 보십시오! 새로운 기본 알고리즘을 기반으로 구축되어 잠재적인 거래를 훨씬 더 쉽게 식별하고 확인할 수 있습니다. 이는 통화의 강세 또는 약세가 가속되는지 여부를 그래픽으로 표시하고 가속 속도를 측정하기 때문입니다. 자동차의 속도계처럼 생각하면 됩니다. 가속화할 때 Forex 시장에서 동일한 일이 분명히 더 빠르게 발생합니다. 즉, 반대 방향으로 가속화되는 통화를 페어링하면 잠재적으로 수익성 있는 거래를 식별한 것입니다. 통화 모멘텀의 수직선과 화살표가 거래를 안내합니다! 역동적인 Market Fibonacci 23 레벨은
Auto Optimized Parabolic RSI: 고급 3D 모멘텀 엔진 대부분의 개인 투자자용 보조지표는 시장의 변동성이 변하는 순간 무용지물이 되는 정적인 입력값에 의존하기 때문에 실패합니다. Auto Optimized Parabolic RSI는 자체적인 수학적 우위를 지속적으로 재계산하여 "보조지표 노후화" 문제를 해결하며, 기관급 퀀트 트레이딩의 적응력을 귀하의 MT5 터미널에 직접 제공합니다. 핵심 이점: 맞춤형 인메모리 3D 최적화   표준 자동 최적화 도구들은 일반적인 보조지표 호출로 터미널에 과부하를 일으켜 MT5 플랫폼을 멈추게 하는 경우가 많습니다. 이 도구는 이러한 병목 현상을 완전히 우회합니다. 맞춤형 네이티브 RAM 기반 계산기로 구축된 내부 엔진은 차트를 로드하거나 타임프레임을 변경할 때마다 빛처럼 빠른 3D 그리드 검색을 실행합니다. RSI 기간(주기), SAR 스텝(가속도) 및 SAR 최대치(속도 제한)를 동시에 스캔하여 플랫폼 지연 없이 수만 개의
Advanced Currency Strength28 Indicator
Bernhard Schweigert
4.91 (657)
현재 40% 할인 초보자 또는 전문가 트레이더를 위한 최고의 솔루션! 이 지표는 우리가 독점 기능과 새로운 공식을 통합했기 때문에 독특하고 고품질이며 저렴한 거래 도구입니다. 단 하나의 차트로 28 Forex 쌍의 통화 강도를 읽을 수 있습니다! 새로운 추세 또는 스캘핑 기회의 정확한 트리거 포인트를 정확히 찾아낼 수 있기 때문에 거래가 어떻게 개선될지 상상해 보십시오. 사용 설명서: 여기를 클릭  https://www.mql5.com/en/blogs/post/697384 그것이 첫 번째, 원본입니다! 쓸모없는 지망생 클론을 사지 마십시오. 더 스페셜  강력한 통화 모멘텀을 보여주는 하위 창의 화살표 GAP가 거래를 안내합니다! 기본 또는 호가 통화가 과매도/과매도 영역(외부 시장 피보나치 수준)에 있을 때 개별 차트의 기본 창에 경고 표시가 나타납니다. 통화 강도가 외부 범위에서 떨어질 때 풀백/반전 경고. 교차 패턴의 특별 경고 추세를 빠르게 볼 수 있는 다중 시간
RFI levels PRO
Roman Podpora
5 (1)
이 지표는 추세 반전 지점과 가격 반등 영역을 정확하게 보여줍니다.       주요 투자자들   . 새로운 트렌드가 형성되는 곳을 파악하고 최대한 정확하게 의사결정을 내리며 모든 거래를 완벽하게 통제합니다. TREND LINES PRO   지표와 함께 사용할 때 최대의 잠재력을 발휘합니다.  VERSION MT5 지표가 보여주는 내용: 새로운 추세의 시작 시 활성화되는 반전 구조 및 반전 수준. 최소한의 위험 대비 수익률을 갖는 이익 실현   (TAKE PROFIT)   및   손절매(STOP LOSS)   레벨 표시       RR 1:2   . 지능형 손실 감소 로직이 적용된 손절매 기능. 지정된 지표에서 두 가지 추세 유형에 대한 반전 패턴을 표시합니다. 지표: 트렌드를 따라   트렌드 라인 프로   (글로벌 트렌드 변화) 트렌드 프로   (빠른 트렌드 변화) 간단하고 효과적입니다       스캐너       실시간 추세 (신규). 다중 시간 프레임 도구 필터링. 표시하다  
Dynamic Scalper System
Vitalyi Belyh
5 (1)
" Dynamic Scalper System " 지표는 추세 파동 내에서 스캘핑 방식으로 거래하도록 설계되었습니다. 주요 통화쌍 및 금에서 테스트되었으며, 다른 거래 상품과의 호환성이 가능합니다. 추가적인 가격 변동 지원을 통해 추세에 따라 단기 포지션 진입 신호를 제공합니다. 지표의 원리 큰 화살표는 추세 방향을 결정합니다. 작은 화살표 형태의 스캘핑 신호를 생성하는 알고리즘은 추세 파동 내에서 작동합니다. 빨간색 화살표는 상승 방향을, 파란색 화살표는 하락 방향을 나타냅니다. 민감한 가격 변동선은 추세 방향으로 그려지며, 작은 화살표의 신호와 함께 작용합니다. 신호는 다음과 같이 작동합니다. 적절한 시점에 선이 나타나면 진입 신호가 형성되고, 선이 있는 동안 미결제 포지션을 유지하며, 완료되면 거래를 종료합니다. 권장되는 작업 시간대는 M1~H4입니다. 화살표는 현재 캔들에 형성되며, 다음 캔들이 이미 시작되었더라도 이전 캔들의 화살표는 다시 그려지지 않습니다. 입력 매개
Apollo SR Master
Oleg Rodin
5 (2)
Apollo SR Master는 지지/저항 구간에서의 거래를 더욱 쉽고 안정적으로 만들어 주는 특수 기능을 갖춘 지지/저항 지표입니다. 이 지표는 지역 가격의 고점과 저점을 감지하여 시간 지연 없이 실시간으로 지지/저항 구간을 계산합니다. 새롭게 형성된 저항 구간을 확인하기 위해 지표는 해당 저항 구간을 실제 매도 또는 매수 신호로 활용할 수 있음을 나타내는 특수 신호를 표시합니다. 이 경우, 저항 구간의 강도가 높아지고, 따라서 저항 구간에서의 성공적인 거래 가능성도 높아집니다. 이것이 바로 이 지표의 핵심 아이디어입니다. SR 존은 손절매와 이익실현을 더욱 쉽게 할 수 있도록 해줍니다. 신호 방향에 따라 SR 존 위 또는 아래 공간을 손절매로 활용할 수 있습니다. 또한, 반대쪽 SR 존은 잠재적 이익실현 영역으로 활용할 수 있습니다. 또한 Apollo SR Master 지표를 사용하는 모든 사용자에게 "Apollo Price Action System" 지표를 무료로 제공합니다.
Scalping Lines System - 은 M1-H1 시간 프레임에서 금(XAUUSD) 자산을 거래하기 위해 특별히 설계된 스캘핑 트레이딩 시스템입니다. 추세, 변동성, 과매수/과매도 시장 분석 지표를 하나의 오실레이터로 통합하여 단기 신호를 식별합니다. 신호선의 주요 내부 매개변수는 사전 설정되어 있습니다. "Trend Wave Duration"은 이동평균선 추세를 사용하여 추세 방향으로 일련의 신호 지속 시간을 조절하고, "Apply Smoothing to Signal Line"은 신호선 생성 방식을 조정하는 매개변수로, 수동으로 조정할 수 있습니다. 시가에서 신호선을 계산할 때는 차트가 다시 그려지지 않습니다. 다른 가격대에서는 신호 화살표가 깜빡일 수 있습니다. 신호는 캔들 마감 후에 나타나며, 다양한 알림 유형을 사용할 수 있습니다. 권장 시간 프레임: M1, M5, M15, M30, H1. 이 지표는 원래 금 거래를 위해 설계되었지만, 스프레드가 낮은 변동성이
지진계 Marketquake Detector. Description in English : https://www.mql5.com/en/market/product/113869?source=Site+Market+Product+Page#description How to use the Seismograph : https://www.mql5.com/en/market/product/113869#!tab=comments&page=2&comment=52806941 Create an EA : https://www.mql5.com/en/market/product/113869#!tab=comments&page=3&comment=52816509 어떤 방식으로 거래하든 유동성이 낮은 시장에 진입하는 것을 피하고 싶을 것입니다.- 지진계는 시장 랠리 전에 시장에 진입할 수 있는 적절한 시기를 도와줄 것입니다. 그러나 바쁠 시장 시간에 진입을 확인했음에도 불구하고 많은 사람들이 유동성이 부족한 시
Trend Screener
STE S.S.COMPANY
4.79 (95)
트렌드 표시기, 트렌드 트레이딩 및 필터링을 위한 획기적인 고유 솔루션, 하나의 도구 안에 내장된 모든 중요한 트렌드 기능! Forex, 상품, 암호 화폐, 지수 및 주식과 같은 모든 기호/도구에 사용할 수 있는 100% 다시 칠하지 않는 다중 시간 프레임 및 다중 통화 표시기입니다. 기간 한정 특가: 지원 및 저항 스크리너 지표는 단 250 달러에 평생 제공됩니다. (원래 가격 65 달러) (제안 연장) Trend Screener는 차트에 점이 있는 화살표 추세 신호를 제공하는 효율적인 지표 추세 추종 지표입니다. 추세 분석기 표시기에서 사용할 수 있는 기능: 1. 트렌드 스캐너. 2. 최대 이익 분석이 있는 추세선. 3. 추세 통화 강도 측정기. 4. 경고가 있는 추세 반전 점. 5. 경고가 있는 강력한 추세 점. 6. 추세 화살표 Trend Screener Indicator가 있는 일일 분석 예, 일일 신호 성능...등은 여기에서 찾을 수 있습니다.   여기를 클릭하십시오.
Atomic Analyst
Issam Kassas
5 (5)
우선적으로 언급할 점은이 거래 지표가 다시 그리지 않고 지연되지 않으며 이를 통해 수동 및 로봇 거래 모두에 이상적이라는 점입니다. 사용자 매뉴얼: 설정, 입력 및 전략. Atomic Analyst는 가격의 강도와 모멘텀을 활용하여 시장에서 더 나은 이점을 찾는 PA Price Action Indicator입니다. 고급 필터를 장착하여 잡음과 거짓 신호를 제거하고 거래 잠재력을 높이는 데 도움이 됩니다. 복잡한 지표의 다중 레이어를 사용하여 Atomic Analyst는 차트를 스캔하고 복잡한 수학적 계산을 간단한 신호와 색상으로 변환하여 초보 트레이더가 이해하고 일관된 거래 결정을 내릴 수 있도록합니다. "Atomic Analyst"는 새로운 및 경험이 풍부한 트레이더를위한 종합적인 거래 솔루션입니다. 프리미엄 지표와 최고 수준의 기능을 하나의 거래 전략에 결합하여 모든 종류의 트레이더에 대한 다재다능한 선택지가되었습니다. 인트라데이 거래 및 스캘핑 전략 : 빠르고 정확한 일일
Supply and Demand Dashboard PRO
Bernhard Schweigert
4.8 (20)
현재 40% 할인! 이 대시보드는 여러 기호와 최대 9개의 타임프레임에서 작동하는 매우 강력한 소프트웨어입니다. 주요 지표(최상의 리뷰: 고급 공급 수요)를 기반으로 합니다.   Advanced Supply Demand 대시보드는 훌륭한 개요를 제공합니다. 다음과 같이 표시됩니다.  영역 강도 등급을 포함하여 필터링된 공급 및 수요 값, 영역에 대한/및 영역 내 Pips 거리, 중첩된 영역을 강조 표시하고 모든 (9) 시간 프레임에서 선택한 기호에 대해 4가지 종류의 경고를 제공합니다. 그것은 당신의 개인적인 필요에 맞게 고도로 구성 가능합니다! 당신의 혜택! 모든 트레이더에게 가장 중요한 질문: 시장에 진입하기에 가장 좋은 수준은 무엇입니까? 최고의 성공 기회와 위험/보상을 얻으려면 강력한 공급/수요 영역 내 또는 그 근처에서 거래를 시작하십시오. 손절매를 위한 최적의 장소는 어디입니까? 가장 안전하려면 강력한 수요/공급 구역 아래/위에 정류장을 두십시오.
Super Signal – Skyblade Edition 전문가용 노리페인트 / 노래그 트렌드 신호 시스템, 뛰어난 승률 제공 | MT4 / MT5용 1분, 5분, 15분과 같은 낮은 타임프레임에서 가장 좋은 성능을 보입니다. 핵심 기능: Super Signal – Skyblade Edition은 추세 매매를 위해 설계된 스마트 신호 시스템입니다. 이 시스템은 다중 필터 로직을 활용하여, 명확한 방향성과 실질적인 모멘텀이 수반된 고품질 추세만을 감지합니다. 이 시스템은 고점 또는 저점을 예측하지 않으며 , 다음 세 가지 조건이 모두 충족될 때만 신호를 발생시킵니다: 명확한 추세 방향 강화되는 모멘텀 건전한 변동성 구조 또한, 시장 세션 기반의 유동성 분석을 통해 신호의 신뢰성과 타이밍을 더욱 향상시킵니다. 신호 특성: 모든 화살표 신호는 100% 리페인트 없음 / 지연 없음 신호가 한 번 발생하면 고정되며, 깜빡이거나 사라지지 않음 차트 상의 시각적 화살표, 정보 패널, 팝업 알
Legacy of Gann
Pavel Zamoshnikov
4.83 (12)
The indicator very accurately determines the levels of the possible end of the trend and profit fixing. The method of determining levels is based on the ideas of W.D.Gann, using an algorithm developed by his follower Kirill Borovsky. Extremely high reliability of reaching levels (according to K. Borovsky  - 80-90%) Indispensable for any trading strategy – every trader needs to determine the exit point from the market! Precisely determines targets on any timeframes and any instruments (forex, met
CRYSTAL HEIKIN ASHI SIGNALS MT4 Professional Trend Detection Indicator with Smart Entry Signals See the Trend. Catch the Move. Trade with Confidence. The professional Heikin Ashi indicator built for traders who want clarity, precision, and EA-ready signal automation. WHAT IS CRYSTAL HEIKIN ASHI SIGNALS? Crystal Heikin Ashi Signals is a professional-grade MetaTrader 4 indicator that combines pure Heikin Ashi candle visualization with an advanced momentum-shift detection system. Designed for both
Pytrader mt4 Python
Offpista LTD
5 (3)
Documentation for connecting Metatrader 4 with Python with a simple drag and drop EA.   A full end-to-end solution ,fully tested ,fast and efficient! The Pytrader ecosystem consists of a python script and a MT4 EA. (  MT5  version ) Further for the licensing an indicator is used.  The communication between the python script and the EA is based on sockets. EA is the  Server   and the python script the  Client .  It is always query(function / python script) and output(data / server). The EA doe
NextCandlePredictor No Repaint
Martin Alejandro Bamonte
NextCandlePredictor 지표 NextCandlePredictor는 다시 그리지 않으며, 색상이 변경되지 않고, 이동하지 않으며, 사라지지 않으며, 지연이 없는 알림이 있는 신호 지표입니다. 모든 타임프레임에서 다음 또는 다가오는 캔들의 방향을 식별하는 데 도움이 됩니다. 뉴욕, 런던 또는 둘 다 겹치는 고변동성 시장에 매우 권장됩니다. 주요 기능: 타임프레임의 유연성: M1에서 H1 이상까지 모든 타임프레임에서 빠르고 정확한 신호를 제공합니다. 명확한 매수/매도 신호: ADX의 DI+ 및 DI- 라인을 사용하여 명확한 매수 및 매도 신호를 생성하여 최고의 거래 결정을 내릴 수 있도록 합니다. 직관적인 시각화: 신호는 차트에 직접 녹색(매수) 및 빨간색(매도) 화살표로 표시되어 빠르고 쉽게 읽을 수 있습니다. 사용자 정의 가능한 설정: 분석할 막대 수와 경고 옵션을 선호도 및 거래 전략에 따라 조정합니다. 사용하려는 TF에 따른 제안표를 아래에서 확인하세요. 캔들 종료 시
KURAMA GOLD SIGNAL PRO (MT4) — 7단계 필터 XAUUSD 완전 트레이딩 시스템 리페인트 없음 리드로우 없음 지연 없음 모든 신호는 영구 고정. 보너스: 영구 라이선스 구매 시 AI Zone Radar ($59) + PDF 매뉴얼 무료 제공. 구매 후 메시지를 보내주세요. AI Zone Radar: https://www.mql5.com/en/market/product/175834 7 FILTERS 7개 독립 필터: 변동성, MA 구조, 추세 방향, MA 각도, H4 상위 시간프레임, RSI, 관통 차단. 대부분 1-2개 필터. 이것은 7개. 3 FILTER LEVELS SAFE [S] — 최대 필터링. STANDARD — 균형. ACTIVE [A] — 더 많은 신호. QUALITY SCORE = 완벽한 조건. = 견고한 셋업. = 불확실한 조건. 3 STEPS 1. 차트에 화
Full Scalping Signal
Leandro Bernardez Camero
FullScalping 는 모든 시장에서 지속적인 스캘핑 진입 을 생성하도록 특별히 설계된 재그리기 없음, 역방향 그리기 없음 지표입니다. 끊임없는 액션을 찾는 공격적인 트레이더에게 완벽합니다! 독점 정보 및 업데이트를 받으려면 채널에 가입하세요: https://www.mql5.com/en/channels/forexnewadvisor 거의 모든 캔들 에서 신호를 제공하며, 트렌드를 확인하거나 주요 되돌림을 신호합니다. 지속적으로 당신을 안내하는 레이더와 같습니다. 작동 방식은? 매우 간단합니다: 빨간색 화살표 매도 거래에 진입. 파란색 화살표 매수 거래에 진입. 항상 일반적인 트렌드 방향으로 거래하고, 거래당 15-20핍 을 공격적으로 목표로 하며, 급격한 시장 반전 전에 빠르게 퇴장합니다. 신호는 지속적 이므로 거래 기회가 고갈되지 않습니다. 목표는 다음을 사용하여 집중적인 스캘핑 을 실행하는 것입니다: 높은 로트 낮은 스프레드(왼쪽 하단 모서리에 표시) 마지막 트렌
추측을 멈추세요. 통계적 우위로 트레이딩을 시작하세요. 주식 지수는 외환과 다르게 거래됩니다. 정해진 세션이 있고, 야간에 갭이 발생하며, 예측 가능한 통계적 패턴을 따릅니다. 이 지표는 DAX, S&P 500, 다우존스와 같은 지수를 자신 있게 거래하는 데 필요한 확률 데이터를 제공합니다. 무엇이 다른가 대부분의 지표는 무엇이 일어났는지 보여줍니다. 이 지표는 다음에 무엇이 일어날 가능성이 있는지 보여줍니다. 매 거래일마다 지표는 100일간의 과거 데이터를 기준으로 현재 설정을 분석합니다. 유사한 갭, 유사한 시가 위치를 가진 날을 찾고, 가격이 주요 레벨에 도달한 빈도를 정확히 계산합니다. 갭이 메워질지, 어제 고점이 테스트될지 더 이상 추측할 필요가 없습니다. 실제 데이터에 기반한 정확한 백분율을 얻게 됩니다. 모든 입력 설명이 포함된 전체 매뉴얼: https://www.mql5.com/en/blogs/post/766370 훌륭한 설정을 찾는 데 도움이 되는 전략 가이드: ht
Volatility Trend System - a trading system that gives signals for entries. The volatility system gives linear and point signals in the direction of the trend, as well as signals to exit it, without redrawing and delays. The trend indicator monitors the direction of the medium-term trend, shows the direction and its change. The signal indicator is based on changes in volatility and shows market entries. The indicator is equipped with several types of alerts. Can be applied to various trading ins
제작자의 제품 더 보기
Monster Harmonics Indicator is a harmonic pattern indicator. It recognizes Gartley, Bat, Crab, Butterfly, Cypher, White Swan, Black Swan, Shark and AB=CD patterns. Projected patterns that are not yet completed are recognized, too. Monster even shows the PRZ (Potential Reversal Zone). Users can add their own user defined patterns to Monster. Besides the current pattern, Monster also shows all patterns in the symbols history. Monster will provide alerts for developing patterns. Introduced by H.M.
Monster Harmonic Indicator
Paul Geirnaerdt
4.59 (29)
Monster Harmonics Indicator is a harmonic pattern indicator. It recognizes Gartley, Bat, Crab, Butterfly, Cypher, White Swan, Black Swan, Shark and several other patterns. Projected patterns that are not yet completed are recognized, too. Monster even shows the PRZ (Potential Reversal Zone). Users can add their own user defined patterns to Monster. Besides the current pattern, Monster also shows all patterns in the symbols history. Monster will provide alerts for developing patterns. Introduced
TMA Currency Meter
Paul Geirnaerdt
4.14 (7)
TMA Currency Meter is the ultimate currency meter. Based on the Triangular Moving Average of all available symbols, this indicator shows which currencies are strong, strengthening, weak or weakening. Experienced as well as novice traders will see the strong and weak currencies in the blink of an eye, and know which trade possibilities to explore further. TMA Currency Meter is a true Multi Timeframe indicator. It is easy to show the currency strengths for a higher timeframe than the chart timefra
MonsterDash Harmonic Indicator
Paul Geirnaerdt
4.54 (26)
MonsterDash Harmonic Indicator is a harmonic pattern dashboard. It recognizes all major patterns. MonsterDash is a dashboard that displays all detected patterns for all symbols and (almost) all timeframes in sortable and scrollable format. Users can add their own user defined patterns . MonsterDash can open and update charts with the pattern found. Settings MonsterDash's default settings are good enough most of the time. Feel free to fine tune them to your needs. The color settings are for thos
Riskscope
Paul Geirnaerdt
Riskscope shows all relevant information about your trades on screen. Information on Stop Loss and Take Profit can be shown as price, pips or exposure. Besides, Riskscope can display a high- and low-watermark of the total of your basket of trades. Settings Riskscope's default settings are good enough most of the time. Nearly all of them are fairly standard. Here are the ones that need some explanation. Monospaced font - set this to the (name of) the font you want to use. A monospaced font looks
Pivots
Paul Geirnaerdt
Pivots is an indicator to show pivots for relevant time frames. Besides the pivots the indicator can also show daly open line, the resistance and support levels, the ADR Fibonacci levels and the order of the pivots. Pivots includes an intelligent algorithm to eliminate Sunday candles, but only if your broker provides those. Pivots are significant price levels that may serve as support, resistance or breakout levels Settings textFont - font to use for the labels. textSize - font size. textColor -
Inside Bars
Paul Geirnaerdt
The Inside Bars indicator shows Inside Bars, the Breakout Zone and Breakouts thereof. Inside Bars are an important price action pattern. The price action of an Inside Bar is completely covered by the price action of the previous bar. Inside Bars are most often used on higher timeframes. Settings Inside Bars default settings are good enough most of the time. Feel free to fine tune them to your needs. ATR factor to skip large candles - very large candles should be filtered as they often cover othe
Candle Patterns
Paul Geirnaerdt
5 (2)
The Candle Patterns indicator shows popular candle patterns on the chart. The possible patterns are Inside Bar, Large Wick, Engulfing, Marubozu, Hammer, Shooting Star, Three White Soldiers and Three Black Crows. Candles are colored to easily identify the patterns. Also, a point and click function displays the pattern found. Settings Message box - when a candle is clicked, the pattern identified will be shown in a Message Box on the charts. All 'Message Box' settings pertain to the box. Show Ins
Better Support Resistance
Paul Geirnaerdt
4.4 (5)
Better Support & Resistance shows the best support and resistance lines and zones. It is based on Fractals with the factor of your choice. All fractals are assembled, weighted, extended and merged into a clear set of support and resistance lines. The immediate nearby lines are shown as zones when price is in that zone. Better Support & Resistance gives you the best overview of the important price levels. Settings Better Support & Resistance's default settings are good enough most of the time. N
Engulfing Bars
Paul Geirnaerdt
The Engulfing Bars indicator shows Engulfing Bars, the signal and the suggested stoploss and take profit. Engulfing Bars are an important price action pattern. The price action of an Engulfing Bar completely covers the price action of the previous bar. Engulfing Bars are most often used on higher timeframes. Settings Engulfing Bars default settings are good enough most of the time. Feel free to fine tune them to your needs. Show Engulfing Bars - Set to true to show Engulfing Bars. Body size per
Fractalicious
Paul Geirnaerdt
Fractalicious shows Fractals of any length, higher or lower highs and lower of higher lows, the fractal channel and the breakout of the channel. Fractals are an important trend and price action pattern. Fractalicious can be used on any timeframe and symbol. Settings Fractalicious default settings are good enough most of the time. Feel free to fine tune them to your needs. Show last fractal - Set to true to show fractals from the last completed bar. (This could move the fractal if the current ba
Breakout Hero
Paul Geirnaerdt
2.64 (11)
Breakout Hero is a Multi Symbol , Auto Timeframe , Breakout Expert Advisor . It recognizes breakout patterns and will set pending trades. When triggered Breakout Hero will monitor trades and adjust the stop loss. Breakout Hero is a multi symbol EA, it will trade EURUSD, GBPUSD, USDJPY and USDCAD. Also, Breakout Hero is auto timeframe. Just drop Breakout Hero on any chart and start trading. Only one chart is needed, Breakout Hero will trade the symbols you pick from the settings. You can monitor
Dark Rider
Paul Geirnaerdt
1 (2)
Dark Rider  is a Night Scalper Expert Advisor . It recognizes overbought and oversold conditions in the hours after close of the New York Exchange and trades accordingly. Dark Rider features an on screen monitor and settings panel on which you can monitor your status and progress.  A signal for Dark Rider can be found here . New in version 1.5 The option 'Stay in trending trades' is new for version 1.5. It will keep you in trending trades. Profitability has been increased while drawdown has bee
Divergence Dash
Paul Geirnaerdt
3 (2)
Diverence Dash is a MACD, RSI, OBV, Momentum, Stochastic or Standard Deviaviation Divergence Dashboard. It will scan all symbols and timeframes you want. Also, Divergence Dash can open charts with the divergence found using the template of your choice. Divergences are often used as a leading indicator and, by using Divergence Dash, are easy to spot. The risk/reward ratio in divergence trading is very low. What can Divergence Dash for you: Find MACD, RSI, OBV, Momentum, Stochastic or Standard Dev
Fusion Trader
Paul Geirnaerdt
5 (1)
NEWS Price increased to $249 from $149 on September 16th. Buy Fusion Trader v2 and get Donchian Trader for free. (limited to 3 account numbers) Fusion Trader v2  is a  Multi Symbol ,  Auto Timeframe ,  Expert Advisor . It features several strategies for different symbols and timeframes. Fusion Trader will monitor trades and adjust the stop loss. Fusion Trader v2  is a complete rewrite from v1, it trades different and more symbols. With default settings Fusion Trader has gained 5% monthly on ave
Donchian Trader
Paul Geirnaerdt
Donchian Trader is a   Multi Index ,   Auto Timeframe ,   Expert Advisor . It features a Donchian Channel strategy for different indices on the daily timeframe. Donchian Trader will monitor trades and adjust to market conditions. Donchian Trader is a multi index EA, For now, it will trade the Dow Jones (US30), S&P 500 (US500) and DAX (GER30). Also, Donchian Trader is auto timeframe. Just drop the EA on any chart and start trading. Only one chart is needed, Donchian Trader will trade the indices
MonsterDash Harmonics Indicator is a harmonic pattern dashboard. It recognizes all major patterns. MonsterDash is a dashboard that displays all detected patterns for all symbols and (almost) all timeframes in sortable and scrollable format. Users can add their own user defined patterns . MonsterDash can open and update charts with the pattern found. Settings MonsterDash's default settings are good enough most of the time. Feel free to fine tune them to your needs. The color settings are for tho
NEWS Price v4 now $799 for a limited period. Fusion Trader v4  is a  Multi Symbol ,  Auto Timeframe ,  Expert Advisor . It features several strategies for different symbols and timeframes. Fusion Trader will monitor trades and adjust the stop loss. Fusion Trader v4  is a partial rewrite from v3, it trades differently and more symbols. The Scalping system now uses market orders instead of stop orders. It is 100% Metatrader 5 compatible. Fusion Trader v4 is a multi symbol EA, For now, it will tra
TMA Currency Meter is the ultimate currency meter. Based on the Triangular Moving Average of all available symbols, this indicator shows which currencies are strong, strengthening, weak or weakening. Experienced as well as novice traders will see the strong and weak currencies in the blink of an eye, and know which trade possibilities to explore further. TMA Currency Meter is a true Multi Timeframe indicator. It is easy to show the currency strengths for a higher timeframe than the chart timefra
Momentum Horizon
Paul Geirnaerdt
Momentum Horizon is a fully automated trading system built for MetaTrader 5, designed to capture high-probability breakout moves in the Gold market. It focuses on two of the most time-tested price action patterns: the daily breakout of yesterday’s high/low, and the powerful 'London session' breakout, where volatility often surges as global markets overlap. By combining these setups, the system seeks to position itself right where momentum is most likely to accelerate. The EA can operate with pre
필터:
Mustafa Magdy
1392
Mustafa Magdy 2016.07.11 19:22 
 

USELESS INDICATOR ... save you money

Seller ignoring all my messages ..

He is plotting an arrow according to another indicator called "Better Volume", which is not gradable (although BetterVolume indicator give much more information instead of "AN ARROW")

I waste my cash .. really sorry for that

리뷰 답변