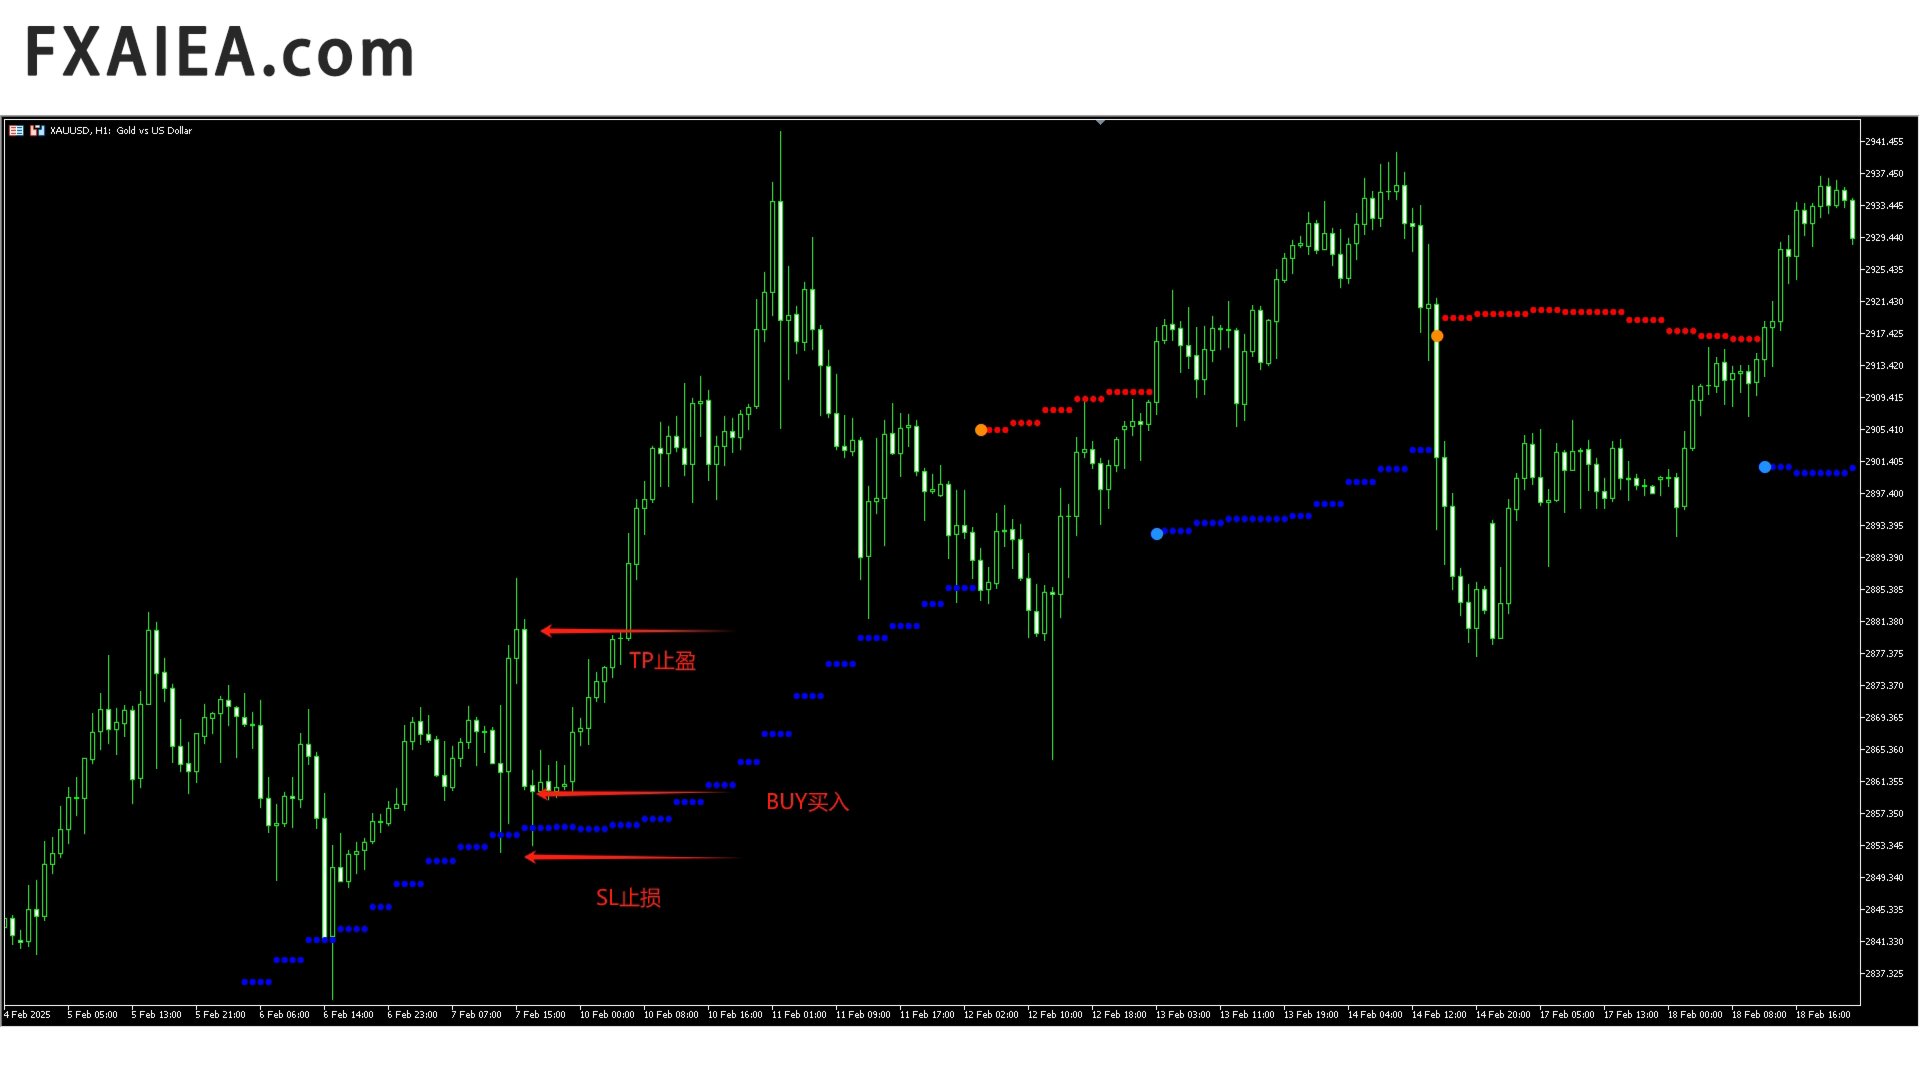
Arrow trend MT5

This indicator draws a sequence of coloured markers along the price chart to show the direction of the current trend and the bar where that direction changes.

Two colours show the running trend, and two more mark the first bar of a new trend. Because the markers sit at a fixed offset from price, they also work as a dynamic level that price tends to respect while the trend is intact.

How it works

The indicator compares price with a trend reference calculated from the sensitivity input. While price stays on one side of that reference, the trend keeps its direction and markers keep the trend colour. When price closes on the opposite side, the direction flips and a reversal marker is drawn on that bar.

The offset between the markers and price is set by an input, so you decide how much room price gets before the trend counts as broken.

How to read it

- Blue marker: uptrend
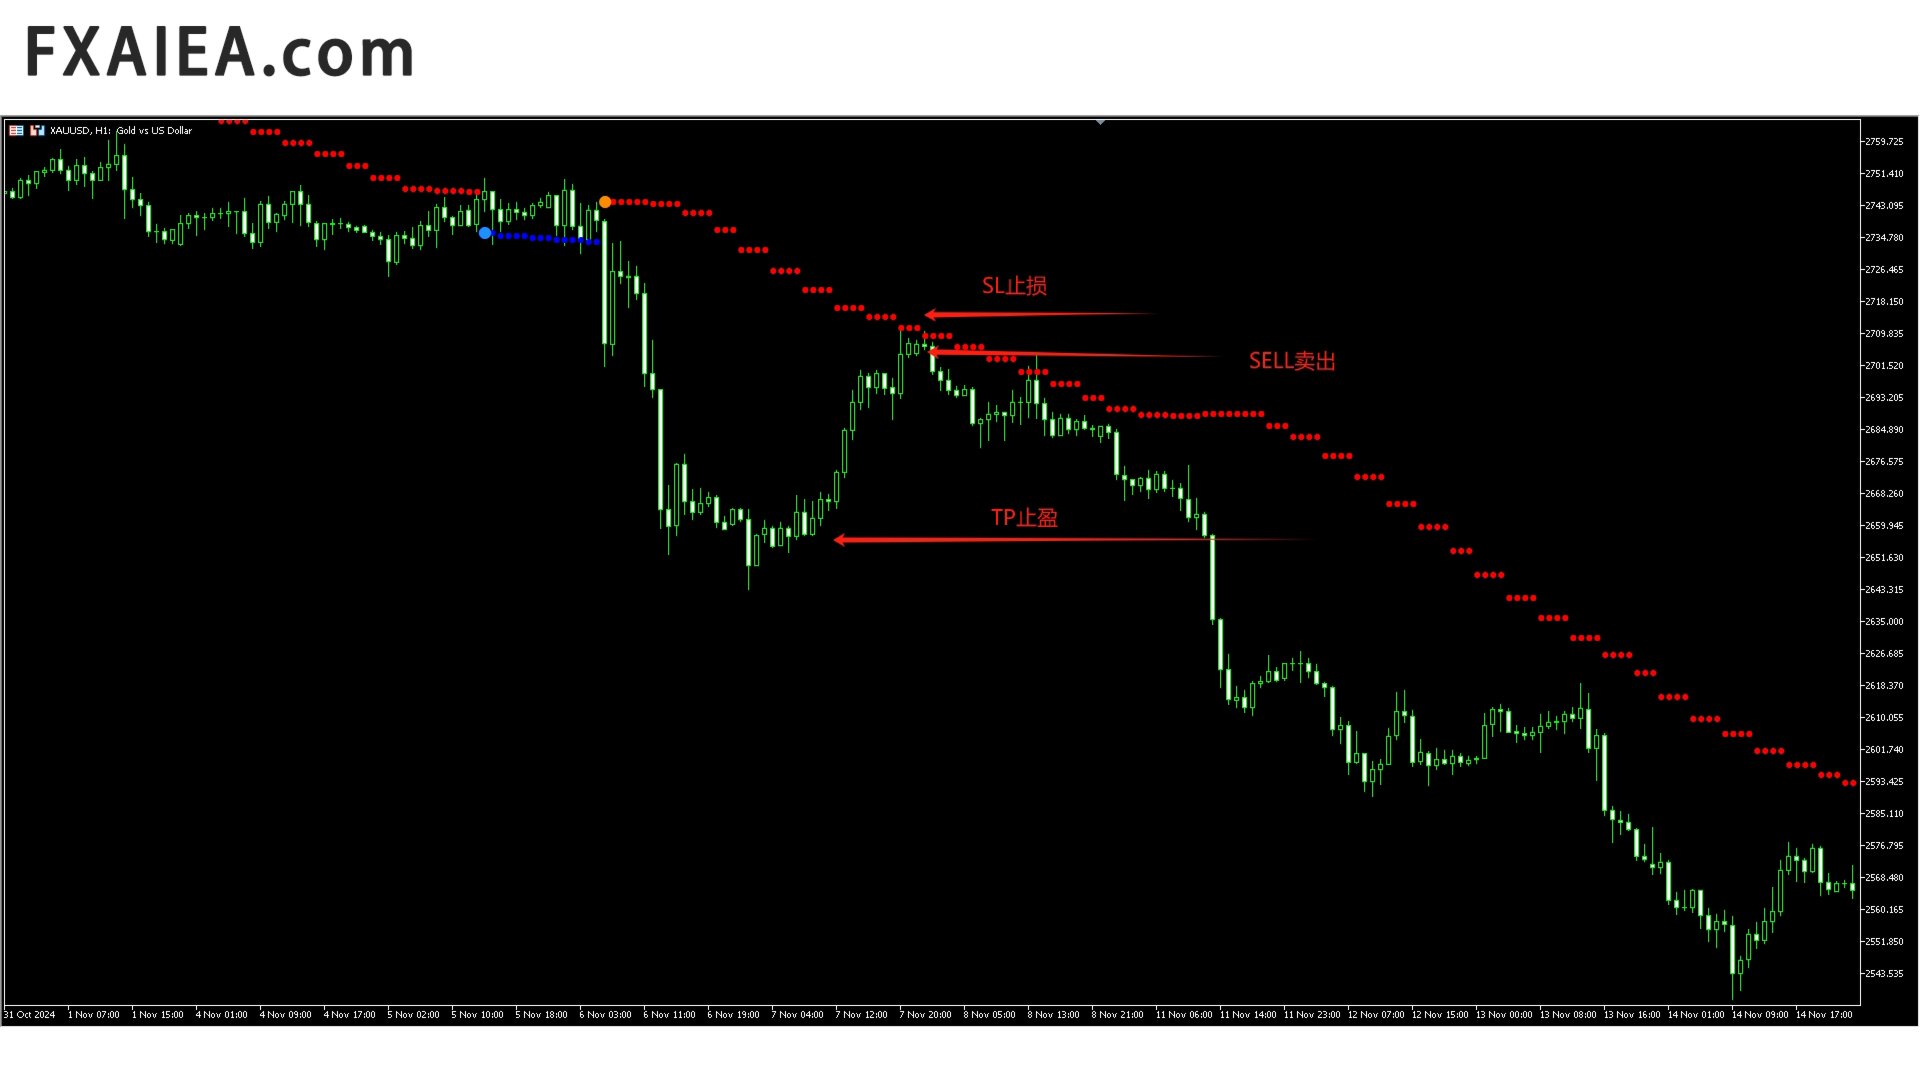
- Red marker: downtrend
- Dodger blue marker: bullish reversal, first bar of a new uptrend
- Dark orange marker: bearish reversal, first bar of a new downtrend

Trading with the trend

The most reliable use is as a direction filter: take entries from your own method, but only in the direction of the current marker colour. Signals against the marker colour are ignored.

The markers can also be used as a dynamic level. Wait for a pullback to the marker line, then enter on the first candle that shows rejection at that level.

Buy setup
Markers are blue. Wait for price to fall back to the blue marker line. Enter a buy once a candle shows rejection at that level. Place the stop loss below the low of the rejection pattern. Exit when a dark orange reversal marker appears, or when price closes clearly below the marker line.

Sell setup
Markers are red. Wait for price to rise back to the red marker line. Enter a sell once a candle shows rejection at that level. Place the stop loss above the high of the rejection pattern. Exit when a dodger blue reversal marker appears, or when price closes clearly above the marker line.

Inputs

- TrendSensitivity - lookback used to build the trend reference; higher values give fewer and slower signals
- PointOffsetPercent - distance of the markers from price, in percent; higher values place markers further from price and reduce false flips
- EnableAlerts - notification when a reversal marker appears

(Replace these with the actual input names of your indicator, and rename them in the source so they show in English.)

Other features

- Optional alerts: on-screen, push or email
- Works on any symbol and any timeframe
- Can be read from an EA through iCustom; buffer indexes are listed in the source
- Low resource usage, suitable for running on many charts

Recommended symbols and timeframes

The indicator is not tied to any symbol or timeframe. It is commonly used on XAUUSD, EURUSD, GBPUSD, USDJPY, USDCAD, AUDUSD and USDCHF, on M5 to H1 charts. Higher timeframes give fewer and slower signals.

Notes

- The marker line follows price, so it is a dynamic level, not a fixed support or resistance.
- Repainting: past markers are not redrawn after the bar closes; signals are confirmed on bar close. (Confirm this matches your indicator and correct it if it does not.)
- One indicator instance manages one symbol and one timeframe.
- Test on a demo account before using it in live trading.
- Questions are welcome in the comments or by private message on MQL5.
추천 제품
RBreaker
Zhong Long Wu
RBreaker Gold Indicators는 금 선물을 위한 단기 데이 트레이딩 전략으로, 추세 추종과 데이 내 반전의 두 가지 거래 방식을 결합합니다. 추세 장에서 수익을 포착할 수 있을 뿐만 아니라, 시장이 반전될 때 적시에 이익을 확정하고 추세에 맞춰 반대 포지션을 잡을 수 있습니다. 이 전략은 미국 잡지 Futures Truth에서 15년 연속으로 가장 수익성 높은 트레이딩 전략 상위 10위 안에 선정되었습니다. 긴 라이프사이클을 자랑하며, 현재까지 국내외에서 널리 사용되고 연구되고 있습니다. 본 지표는 2026년 금 선물의 움직임을 반영하여 14일 ATR 지표를 기반으로 돌파 계수 A, 관찰 계수 B, 반전 계수 R을 보다 합리적인 값으로 정의했습니다. 매우 훌륭한 지표이며, 안정적인 연간 수익성을 달성했습니다. 강력히 추천합니다~ 위 지표는 변동성이 높은 상품에 적합하며, 매개변수는 금 선물, 주가 지수 선물 등에 적합합니다. 다른 상품이 필요한 경우 돌파 계수 A
Heiken_Ashi_Bars - MT5용 고급 추세 시각화 도구 개요 Heiken_Ashi_Bars 는 시장의 노이즈를 필터링하고 진정한 기본 추세를 강조하도록 설계된 강력하고 시각적으로 직관적인 사용자 지정 지표입니다. 기존의 캔들스틱 차트는 불규칙하여 거짓 신호와 섣불린 청산을 유발할 수 있습니다. 이 지표는 가격 데이터를 평균화하여 가격 움직임을 부드럽게 만들어 추세 지속, 반전 및 수익성 있는 진입 구간을 훨씬 쉽게 파악할 수 있도록 해줍니다. 주요 기능 및 장점 강력한 노이즈 감소: 사소한 가격 급등 및 횡보 노이즈를 필터링합니다. 명확한 시각적 신호: 색상으로 구분된 막대를 통해 강세 및 약세 모멘텀을 한눈에 파악할 수 있습니다. 리페인트 없음 (No Repaint): 막대가 마감되면 신호가 고정됩니다. 과거 막대를 다시 계산하지 않습니다. 고도로 최적화됨: 터미널 지연이 없도록 깔끔하게 코딩되었습니다. 다양한 활용: 모든 금융 상품(외환, 지수, 금속, 암호화폐)에서
FREE
Structure King AI Signal
Shingala Gautamkumar
Structure King AI Signal Structure King AI Signal is a professional MetaTrader 5 trading indicator designed to help traders analyze market structure, trend direction, multi-timeframe confirmation and trade management from one clean dashboard. Key Features • Market Structure & Trend Analysis • BUY / SELL Signals • Multi-Timeframe (HTF) Confirmation • Entry Price Levels • Dynamic Stop Loss (SL) • TP1 / TP2 / TP3 Levels • ATR Volatility Analysis • ADX Trend Strength Filter • Adaptive Market Filter
Looking for reliable levels on a price chart? Already tired of searching for similar indicators? Are the levels not working out as they should? Then this is the indicator for you. Volume Prices Universal is a reliable indicator of horizontal volumes. What does it show? First of all, the main idea of ​​the indicator is to display at which price mark the price has been for the longest time. Thus, the display of price volumes on the price chart is formed. With the help of which you can very simpl
PatternDetector
Thien Thanh Tran
PatternScope — Multi-Pattern Recognition for MT5 PatternScope is a multi-pattern recognition indicator for MetaTrader 5. It scans price action for classic chart patterns, confirms breakouts, and draws clear   Entry, Stop Loss and Take Profit   levels. A compact dashboard shows the latest pattern, bias and Risk:Reward. Patterns:   Double Top/Bottom, Triple Top/Bottom, Head and Shoulders (and inverted), Bullish & Bearish Flag, Pennant, Rising & Falling Wedge, Triangle, Rectangle, Cup and Handle —

BTC Trend Scalper MT5 Trend Capture Edition — BTCUSD를 위한 정밀 모멘텀 트레이딩 안녕하세요, 트레이더 여러분! 저는   BTC Trend Scalper MT5   — 규율 있는 리스크 관리로 모멘텀 움직임을 포착하도록 설계된 지능형 비트코인 트레이딩 전문가 자문(EA)입니다. 저는   마틴게일이 아닙니다 . 저는   그리드 시스템이 아닙니다 . 저는   도박 로봇이 아닙니다 . 저는   추세 추종 스캘퍼 입니다. 모든 캔들을 쫓는 것보다 자본을 보호하는 것이 더 중요하다는 것을 이해하는 트레이더들을 위해 특별히 제작되었습니다. 제 전문 분야는? 비트코인 (BTCUSD) 제 임무는? 높은 확률의 방향성 움직임을 포착하면서 리스크를 엄격하게 통제하는 것입니다. 왜 "추세 포착(Trend Capture)"인가? 많은 비트코인 EA가 고점과 저점을 예측하려고 합니다. 많은 스캘퍼가 모든 시장 변동을 과도하게 거래합니다. 저는 다른
Divergent Stochastic Filter II Catch Reversals Early, Filter Noise, Trade with Confidence The Edge: Why This Stochastic is Different  Every trader knows the Stochastic oscillator. But knowing when to trust its signals, that's the real challenge. The Divergent Stochastic Filter II transforms this classic indicator into a precision reversal detection system by adding critical elements: divergence intelligence, signal filtering and exhaustion detection.  While standard Stochastic oscillators fire s
Meta Trend PRO MT5
Roman Podpora
5 (1)
메타 트렌드 프로       — 는 추세 추종 도구로, 거래에서 추측을 배제하고 시장이 이미 결정을 내린 지점을 보여줍니다. 이 지표는 추세, 추세선 및 구조가 변화하는 주요 지점을 식별하고 주요 참여자들이 포지션을 취할 수 있도록 가격이 되돌아오는 영역을 강조합니다. 단순히 가격 움직임만 보는 것이 아니라, 그 이면에 숨겨진 논리까지 이해할 수 있습니다. 모든 신호는 캔들 마감 후 기록되며, 다시 그려지지 않고 차트에 저장되므로 상황을 확실하게 분석하고 결정을 내릴 수 있습니다. 거래 목표(이익 실현) 또한 표시됩니다. 이 지표의 효과에 대해 완벽한 확신을 가지실 수 있도록 자동 통계 자료를 제공해 드립니다. 방향 전환 후에는 손절매 수준과 해당 수준이 지능적으로 점진적으로 이동하는 모습(Move SL)을 표시해주는데, 이는 매우 중요합니다.       감소시킨다       위험       위치별로. 손절매/이익실현/RR 오른쪽에 내장된 패널은 현재 글로벌 추세 방향의 시장 진입
Maximum Trend Arrows OT MT5
Mulweli Valdaz Makulana
STRICTLY FOR BOOM INDEX ONLY!!!!! Here I bring the Maximum Trend Arrows OT1.0 MT5 indicator. This indicator is made up of a combination of different trend indicators for entries and exits, for entries an orange arrow will paint on the chart below the current market and a red flag for closing of trades and it produces buy arrows only. When the orange arrow appears, it will appear along with it's sound to notify you. The 1H timeframe is recommended, don't use it anywhere else than on the 1H timefr
GDS Renko Entry Helper - Free Renko Price Interaction Indicator for MetaTrader 5 GDS Renko Entry Helper is a free Renko price interaction indicator for MetaTrader 5. It helps traders highlight important areas where price reacts, slows down, returns to a zone or changes behavior around support and resistance. The tool is designed for manual Renko analysis. It does not generate buy or sell signals and does not tell the trader when to enter the market. Its purpose is to help focus attention on area
CosmiCLab FIBO
Kirils Subins
CosmiCLab SMC FIBO CosmiCLab SMC FIBO is a professional trading indicator designed for traders who use Smart Money Concepts (SMC), market structure analysis and Fibonacci retracement levels. The indicator automatically detects market swings and builds Fibonacci levels based on the latest impulse movement. It also identifies market structure changes such as BOS (Break of Structure) and CHOCH (Change of Character), helping traders understand the current market direction. CosmiCLab SMC FIBO also pr
Limitless MT5
Dmitriy Kashevich
Limitless MT5 is a universal indicator suitable for every beginner and experienced trader. works on all currency pairs, cryptocurrencies, raw stocks Limitless MT5 - already configured and does not require additional configuration And now the main thing Why Limitless MT5? 1 complete lack of redrawing 2 two years of testing by the best specialists in trading 3 the accuracy of correct signals exceeds 80% 4 performed well in trading during news releases Trading rules 1 buy signal - the ap
ATrend
Zaha Feiz
4.83 (18)
ATREND: 작동 방식 및 사용 방법 ### 작동 방식 MT5 플랫폼을 위한 "ATREND" 지표는 기술 분석 방법론의 조합을 활용하여 트레이더에게 강력한 매수 및 매도 신호를 제공하도록 설계되었습니다. 이 지표는 주로 변동성 측정을 위해 평균 진폭 범위(ATR)를 활용하며, 잠재적인 시장 움직임을 식별하기 위한 트렌드 탐지 알고리즘과 함께 사용됩니다. 구매 후 메시지를 남기면 특별 보너스 선물을 받게 됩니다. ### 주요 특징: - 동적 트렌드 탐지: 이 지표는 시장 트렌드를 평가하고 신호를 조정하여 트레이더가 현재 시장 상황에 맞춰 전략을 조정할 수 있도록 돕습니다. - 변동성 측정: ATR을 사용하여 시장의 변동성을 측정하며, 이는 최적의 손절매(SL) 및 이익 실현(TP) 수준을 결정하는 데 중요합니다. - 신호 시각화: 이 지표는 차트에 매수 및 매도 신호를 시각적으로 표시하여 트레이더의 의사 결정을 향상시킵니다. ### 운영 단계 #### 입력 및 설정 - TimeFr
CRT Candle Range Theory HTF MT5 - Ultimate CRT Indicator: 고급 ICT 개념 및 Malaysian SnR 트레이딩 시스템 가장 진보된 Candle Range Theory 지표로 마켓 메이커의 발자취를 마스터하십시오. Ultimate CRT Indicator를 사용하여 Smart Money Concepts(SMC)의 진정한 힘을 발휘하고 기관처럼 정확하게 거래하십시오. 진지한 트레이더를 위해 독점적으로 제작된 이 지표는 ICT Concepts(Inner Circle Trader)의 핵심 기둥인 매우 효과적인 Candle Range Theory(CRT)를 자동화하고 Malaysian Support and Resistance(SnR) 진입 방법과 FVG(Imbalance) 영역의 치명적인 정밀도로 이를 강화합니다. MT5에서 Forex, Crypto 또는 지수를 거래하든 이 알고리즘은 시장 소음을 제거하고 가짜 돌파(fakeout)를 필터링하며
MercariaPattern1-2-3 відстежує рух ціни, знаходить трьоххвильові структури 1-2-3 та підсвічує момент, коли сценарій підтверджується пробоєм ключового рівня. MercariaPattern1-2-3 tracks price movement, detects three-leg 1-2-3 structures and highlights the moment when the scenario is confirmed by a key level breakout. Індикатор збирає локальні свінги в компактну фігуру 0–1–2–3 , чекає підтвердженого пробою та будує стрілку входу з готовими рівнями SL/TP. The indicator combines local swings into a
Engulfing with EMAs Indicator Unlock the power of advanced candlestick pattern detection with the Engulfing with EMAs Indicator , a cutting-edge tool designed for MetaTrader 5. This futuristic indicator combines the precision of engulfing pattern analysis with the trend-following strength of Exponential Moving Averages (EMA 21 and EMA 50), empowering traders to identify high-probability setups across all currency pairs and timeframes. Key Features: Comprehensive Engulfing Detection : Detects b
Has rsi signal
Evgenii Savinov
HAS RSI Signal — SL/TP 자동 계산 기능이 포함된 전문 트렌드 지표 HAS RSI Signal 은 검증된 클래식 지표와 현대적인 노이즈 필터링 알고리즘을 결합한 강력한 트레이딩 도구입니다. 이 지표는 Heiken Ashi Smoothed (HAS) 캔들과 RSI 오실레이터를 통해 시장을 분석하며, 추세 반전이나 과매수/과매도 구간 이탈 시 트레이더에게 명확한 진입 신호를 제공합니다. 주요 장점: 이중 필터링: Heiken Ashi Smoothed를 사용하여 시장의 '노이즈'를 제거하고, RSI를 통해 모멘텀의 강도를 확인합니다. 자동 레벨 계산: 단순히 신호만 주는 것이 아니라, 변동성( ATR )을 기반으로 최적의 손절매(Stop Loss) 및 이익 실현(Take Profit) 레벨을 자동으로 계산합니다. 시각적 편의성: 신호가 차트 위에 컬러 캔들 형태로 직접 표시되어 복잡하지 않고 직관적으로 추세를 파악할 수 있습니다. 알림 시스템: 터미널 알람, 사운드, 스마
Chỉ báo này sẽ thông báo cho bạn nếu cấu hình xu hướng thành công. Tín hiệu theo xu hướng không nên được tăng theo, nhưng tín hiệu mua ở mức giá thấp theo mô hình giao dịch thông thường của bạn, hoặc tín hiệu bán ở mức giá tốt, là một lựa chọn rất tốt. Hãy thiết lập nó trên khung thời gian lớn hơn và theo dõi các khung thời gian nhỏ hơn, bám sát các xu hướng chính. Tôi thường thiết lập ba khung thời gian gần nhau nhất và không bao giờ đi ngược tín hiệu của INdicator này. INdicator   này không có
Double HMA MTF for MT5
Pavel Zamoshnikov
4 (4)
This is an advanced multi-timeframe version of the popular Hull Moving Average (HMA) Features Two lines of the Hull indicator of different timeframes on the same chart. The HMA line of the higher timeframe defines the trend, and the HMA line of the current timeframe defines the short-term price movements. A graphical panel with HMA indicator data from all timeframes at the same time . If the HMA switched its direction on any timeframe, the panel displays a question or exclamation mark with a tex
WanaScalper
Isaac Wanasolo
1 (1)
A scalping indicator based on mathematical patterns, which on average gives signals with relatively small SL, and also occasionally helps to catch big moves in the markets (more information in the video) This indicator has three main types of notifications: The first type warns of a possible/upcoming signal on the next bar The second type indicates the presence of a ready signal to enter the market/open a position The third type is for SL and TP levels - you will be notified every time price re
GDS Renko Pip ST Chart - Pip-Based Renko Chart Indicator for MetaTrader 5 GDS Renko Pip ST Chart is a pip-based Renko chart indicator for MetaTrader 5. It helps traders build and study cleaner Renko price movement using a practical fixed pip or point-based brick structure. This tool is designed as a Renko chart foundation for manual analysis. It does not predict the market, does not generate buy or sell signals and does not decide whether a trade should be opened. Renko EDGE EA Golden Delta | A
MetaTrader 5용 스마트 다층 브레이크아웃 및 풀백 탐지기 "스마트하고, 간단하고, 빠르게!" 고확률 브레이크아웃 진입을 놓치는 것에 지치셨나요? 여러 차트를 몇 시간씩 스캔하면서 브레이크아웃을 추세 방향과 통화 모멘텀에 맞추려고 하지만 — 결국 움직임을 놓치고 마나요? Break Pullback은 하나의 지표로 이 모든 문제를 해결합니다. Break Pullback이란 무엇인가요? Break Pullback은 시장 구조, 브레이크아웃, 추세 지속 설정을 거래하는 트레이더를 위해 특별히 설계된 전문가급 MetaTrader 5 지표입니다. 실시간으로 여러 통화 쌍에 걸쳐 Break와 Pullback 형성을 자동으로 감지하고 — 세 가지 확인 레이어를 통해 모든 신호를 필터링합니다: 구조적 브레이크아웃 탐지 — 차트의 주요 브레이크 레벨 식별 HTF 일봉 바이어스 — 진입을 지배적인 일봉 추세 방향에 맞춤 통화 강도 지수 — 쌍을 이룬 통화 간의 모멘텀 불균형 확인 결과: 오
Automated Trendlines MT5
Georgios Kalomoiropoulos
추세선은 외환 거래에서 기술적 분석의 가장 필수적인 도구입니다. 불행히도, 대부분의 거래자는 올바르게 그리지 않습니다. 자동 추세선 표시기는 시장의 추세 움직임을 시각화하는 데 도움이 되는 진지한 거래자를 위한 전문 도구입니다. 추세선 강세 추세선과 약세 추세선에는 두 가지 유형이 있습니다. 상승 추세에서 Forex 추세선은 가격 움직임의 가장 낮은 스윙 포인트를 통해 그려집니다. 최소 두 개의 "최저 저점"을 연결하면 추세선이 생성됩니다. 하락 추세에서 추세선은 가격 움직임의 가장 높은 스윙 포인트를 통해 그려집니다. 최소 두 개의 "최고 최고점"을 연결하면 추세선이 생성됩니다. 추세선이 깨질 때? 강세 추세선은 약세 양초가 강세 추세선 아래에서 닫히고 양초의 고점이 추세선 위에 있을 때 깨집니다. 약세 추세선은 강세 양초가 약세 추세선 위로 마감되고 양초 저점이 추세선 아래에 있을 때 깨집니다. 추세선이 삭제되면? 강세 추세선은 전체 양초가 강세 추세선 아래에
Trend Master V2
Oratile Pitsoane
What Is Trend Master Pro? Trend Master Pro   is a professional-grade trend trading indicator built for MetaTrader 5. It was designed with one goal in mind — to keep you on the right side of the market at all times by combining three powerful technical tools into a single, clean, easy-to-read display directly on your price chart. Instead of cluttering your screen with multiple separate indicators, Trend Master Pro fuses an   EMA Ribbon trend filter , a   ZigZag swing point engine , and a   breako
Free automatic Fibonacci is an indicator that automatically plots a Fibonacci retracement based on the number of bars you select on the BarsToScan setting in the indicator. The Fibonacci is automatically updated in real time as new highest and lowest values appears amongst the selected bars. You can select which level values to be displayed in the indicator settings. You can also select the color of the levels thus enabling the trader to be able to attach the indicator several times with differe
FREE
"Adjustable Fractals"는 프랙탈 지표의 고급 버전으로, 매우 유용한 거래 도구입니다! .................................................................................................................. - 알다시피 표준 프랙탈 MT5  지표에는 설정이 전혀 없습니다. 이는 거래자에게 매우 불편합니다. - Adjustable Fractals는 이 문제를 해결했습니다. 필요한 모든 설정이 있습니다. - 지표의 조정 가능한 기간(권장 값 - 7 이상). - 가격의 고점/저점으로부터 조정 가능한 거리. - 프랙탈 화살표의 조정 가능한 디자인. - 표시기에는 모바일 및 PC 알림 기능이 내장되어 있습니다. 여기를 클릭하여 고품질 트레이딩 로봇과 지표를 확인하세요! 이 MQL5 웹사이트에서만 제공되는 오리지널 제품입니다.
Caicai L&S Yield Histogram Important Notice: This indicator is an integral tool of the automated EA Caicai Long and Short Pair Trading . This indicator visually displays the percentage deviation (Yield %) of a pair's current spread relative to its own historical mean. It is an excellent tool for quickly visualizing the gross financial potential of a market distortion in Long & Short operations. Main Features: Percentage Visualization: Understand the size of the distortion in palpable percentage
Multi-Timeframe Heiken Ashi (Smoothed with Dashboard) Professional Market Structure Visualization with Weighted Confluence Scoring Transform your trading with crystal-clear multi-timeframe analysis. This indicator combines smoothed Heiken Ashi candles with an intelligent weighted scoring system to give you unprecedented clarity in any market condition. YOUR TRADING QUESTIONS – ANSWERED INSTANTLY: 1. What's the REAL trend direction? Dashboard Reveals:   Higher timeframe (MN1, W1, D1, H4) trend a
Renko System
Marco Montemari
This indicator can be considered as a trading system. It offers a different view to see the currency pair: full timeless indicator, can be used for manual trading or for automatized trading with some expert advisor. When the price reaches a threshold a new block is created according to the set mode. The indicator beside the Renko bars, shows also 3 moving averages. Features renko mode median renko custom median renko 3 moving averages wicks datetime indicator for each block custom notification
이 제품의 구매자들이 또한 구매함
Meravith Scanner
Ivan Stefanov
5 (3)
MERAVITH SCANNER는 MetaTrader 5용 전문 금융 시장 지표로, 여러 분석 도구를 하나의 통합 시스템으로 결합합니다. 독점적인 거래량 가중 평균 가격(VWAP) 방법론을 사용하여 모든 계산을 자동으로 수행하며, 주관적인 해석을 완전히 배제합니다. 이 지표는 모든 자산 클래스(Forex, 주식, 지수, 상품, 암호화폐)와 M1부터 월간 차트까지 모든 시간 프레임에서 작동합니다. 기본 원리는 “가격은 거래량을 따른다”입니다. MERAVITH는 기관 거래량이 집중되는 위치를 식별하고, 그 집중에서 수학적으로 정확한 가격 수준을 도출합니다. 예측이나 투기를 하지 않으며, 계산만 수행합니다. MERAVITH SCANNER를 사용하면 28개의 주요 Forex 통화쌍을 모든 시간 프레임에서 단 2~3분 만에 스캔할 수 있습니다. 또한 원하는 시장을 스캔할 수도 있으며, 예를 들어 약 100개의 주식을 약 10분 안에 스캔할 수 있습니다. 지표는 소진 레벨, 균형선, 편차, 통계
Meravith MT5
Ivan Stefanov
5 (3)
MERAVITH는 MetaTrader 5용 멀티 타임프레임 거래량·유동성 지표로, 모든 타임프레임에서 추세, 지지와 저항 구간, 진입, 목표, 손절을 보여줍니다. 시장의 완전한 유동성 지도, 헤지펀드 스타일의 유동성 도구를 제공하며, 자체 거래량 가중 평균 가격 방식으로 모든 계산을 자동으로 수행하므로 주관적인 해석이 없습니다. 외환, 금(XAUUSD), 지수, 암호화폐에서 작동하며, 모든 타임프레임에서 사용할 수 있습니다. 구매 후 보너스: MERAVITH로 거래하는 방법에 대한 동영상 강의 모음. 구매 후 저에게 메시지를 보내주세요. MERAVITH의 기능 모든 타임프레임을 분석하고 각 타임프레임에서 현재 유효한 추세를 보여줍니다. 유동성 구간(Volume Equilibrium)을 표시합니다. 상승 거래량과 하락 거래량이 같아지는 지점입니다. 모든 타임프레임의 유동성 레벨을 차트에 직접 표시합니다. 참고용으로 시장의 텍스트 분석을 작성합니다. 현재 추세를 기준으로 진입, 목표,
This indicator automatically detects internal & swing market structure, Fibonacci Retracement and Fibo Levels. Features Full internal & swing market structure labeling in real-time Fibonacci Retracement Fibonacci Levels After purchasing the indicator, the full source code is provided, and via indicator buffers it can be easily integrated into your Expert Advisors (EAs) for automated trading strategies.
First time on MetaTrader, introducing IQ Star Lines, an original Vedic Astrology Based Intraday Trading Indicator. We don't offer free or bonus indicators in exchange of reviews from you. You won't need any free products with this indicator to make it work. ;) Enjoy! Welcome to the new and updated  IQ Star Lines , the ultimate fusion of ancient planetary cycles and modern quantitative trading, published for the first time on Metatrader. This is an indicator built by the developer, who has spent
ORB Seeker MT5
Marcela Goncalves De Oliveira
한정 수량 판매 및 제품 희소성 유지를 위한 특별 가격입니다! 단돈 599달러! 구매 후 저에게 연락 주시면 보너스 ORB Seeker EA와 개인 최적화 설정 파일을 보내드립니다. 깔끔한 세션 브레이크아웃을 자신감 있게 활용하세요! ORB Seeker MT5는 정확성, 단순성, 유연성 및 명확한 차트 구조를 원하는 트레이더를 위해 개발된 전문적인 시가 범위 돌파(ORB) 지표입니다. 이 프로그램은 모든 금융 상품에 대해 장전 거래 또는 사용자 지정 세션 범위를 자동으로 표시하고, 진입, 손절매, 목표 수익 및 선택적으로 50% 부분 목표 수익 수준을 포함한 명확한 돌파 신호를 제공합니다. 모든 계산은 실시간으로 차트에 직접 표시됩니다. 런던 개장, 뉴욕 세션, 아시아 세션 또는 사용자 지정 시장 시간대를 선택하여 거래하세요. ORB Seeker MT5는 사용자가 선택한 세션 시간에 맞춰 작동하므로 시장 범위, 돌파 레벨 및 거래 레벨을 정확하게 확인할 수 있습니다. 모든 구매
KenKem Master Volume Profiler - Brief Introduction A Display-only volume-profile cockpit for XAUUSD, BTCUSD and other liquid symbols. Draws profile structure, multi-timeframe flow, EMA trend and study-only setup markers. Places no orders. Not a signal service.  It maps where the market has actually traded and reads recent order flow, so you can see structure and lean at a glance.  What it shows: Master and local volume profiles (POC and value-area high/low) - the price shelves that matter. A liv
Navigator Equilibrium: 시장 국면, 모멘텀, 피크, 다이버전스를 하나의 창에서 모멘텀 오실레이터, 추세 필터, 변동성 지표, 다이버전스 스캐너를 오가며 확인할 필요가 없습니다. Navigator Equilibrium은 이 모두를 색상으로 구분되는 하나의 창에 담았습니다. 모멘텀이 강해지는지 약해지는지, 누가 주도권을 쥐고 있는지, 시장이 추세 중인지 횡보 중인지, 그리고 가격과 모멘텀이 어디서 엇갈리는지를 한눈에 확인할 수 있습니다. 시장을 명확하게 읽고 싶은 재량 트레이더와, 깔끔하고 문서화된 버퍼가 필요한 EA 개발자를 위해 만들었습니다. 차별점 상승 또는 하락만 보여 주는 것이 아닌, 다섯 가지 상태의 히스토그램. 방향뿐 아니라 모멘텀이 강해지는지, 약해지는지, 과도하게 늘어난 피크 상태인지를 색상으로 보여 줍니다. 시장 상태를 알려 주는 제로 라인. 색이 바뀌면서 시장이 추세 중인지 횡보 중인지 알려 줍니다. "누가 주도하는가"를 한눈에. 히스토그램 막대 위
한 문장으로 이해하면 이 인디케이터는 RSI와 MACD, 두 전문가를 하나로 묶은 것 입니다. 두 지표를 따로 보며 판단할 필요 없이, 둘 다 동의할 때만 "매수" 또는 "매도" 화살표를 보여줍니다. 화살표는 다시 그려지지 않습니다 . 한 번 나타나면 그 자리에 고정됩니다. "콤보"의 의미 보통 트레이더는 RSI(가격 움직임의 힘)와 MACD(추세 방향)를 따로 봅니다. 그런데 둘의 신호가 충돌할 때가 많죠. 이 인디케이터는 두 지표가 동시에 같은 방향을 가리킬 때만 신호를 냅니다 . 덕분에 가짜 신호가 훨씬 줄어듭니다. 화면에서 보이는 것 가격 차트와 분리된 인디케이터 창 파란색과 빨간색 화살표 – 바로 쓸 수 있는 매매 신호 확대된 MACD 히스토그램 (모멘텀을 쉽게 파악하도록 더 크고 선명하게 표시) RSI와 MACD 선도 함께 표시되지만, 주목할 것은 화살표 이런 분께 적합합니다 초보자 – 두 지표를 따로 해석하고 모순을 처리할 필요 없음 경험자 – 빠른 신호 필터링, 다시
Transaction Speed MT5
Ivan Stefanov
5 (4)
이 지표는 시장에서 관심이 나타나는 영역 을 강조 표시한 후, 주문이 누적되는 영역 을 보여줍니다. 이는 **대규모 오더북(호가창)**처럼 작동합니다. 이것은 거대한 자금 을 위한 인디케이터입니다. 성능은 탁월하며, 시장에서 어떤 관심이 있든 반드시 포착할 수 있습니다 . (이것은 완전히 새로 작성되고 자동화된 버전 입니다 – 이제 수동 분석은 필요하지 않습니다.) **거래 속도(Transaction Speed)**는 새로운 개념의 인디케이터로, 시장에 대규모 주문이 언제, 어디에 쌓이는지를 보여주며 , 그 이점을 분석합니다. 매우 초기 단계에서 트렌드 전환 을 감지할 수 있습니다. FX 시장에서 흔히 사용하는 "거래량(volume)"은 오해입니다. 실제로는 시간당 가격 변화량 이므로, 올바른 용어는 거래 속도 입니다. 우리가 어떻게 사고하고, 행동하며, 분석하느냐 가 가장 중요합니다. 분석 패러다임의 전환 은 필수적입니다. 이 인디케이터는 외환 시장에서의 볼륨 개념을 논리적으로
TrendMaestro5
Stefano Frisetti
note: this indicator is for METATRADER4, if you want the version for METATRADER5 this is the link:  https://www.mql5.com/it/market/product/108106 TRENDMAESTRO ver 2.5 TRENDMAESTRO recognizes a new TREND from the start, he never makes mistakes. The certainty of identifying a new TREND is priceless. DESCRIPTION TRENDMAESTRO identifies a new TREND in the bud, this indicator examines the volatility, volumes and momentum to identify the moment in which there is an explosion of one or more of these da
Historical Similarity Matcher Indicator (HI.SI.MA) Try it free today — demo version now available!   https://www.mql5.com/en/market/product/167114 Overview The Historical Similarity Matcher is a technical analysis indicator for MetaTrader 5. It scans historical price data to find segments that show statistical similarity to a user-selected reference period on the chart.
시장이 진짜로 무엇을 하고 있는지 보십시오.   세 가지 시장 국면(수축, 확장, 추세)을 눈앞에서 실시간으로 지켜보고, 추세 국면의 초기 단계에서 더 나은 진입을 잡으십시오.   추측을 멈추십시오. 기관과 스마트 머니가 하는 것처럼 시장을 읽기 시작하십시오.   MT5용 Apex Market Structure Pro는 노이즈를 걷어내고 모든 캔들 아래에 있는 진짜 구조를 보여 주는 정밀 스마트 머니 분석 도구입니다.   유동성, 구조 전환, 매집 구간, 추세 편향을 하나의 깔끔하고 전문적인 오버레이에 담았습니다. 후행 지표에 지쳐 명확함으로 매매할   준비가 된 진지한 트레이더를 위해 만들어졌습니다.      중요: 이 지표는 Heikin Ashi(하이킨 아시) 캔들에서 작동하도록 설계되었습니다. 사용 전 차트를 Heikin Ashi로 설정하여 그 잠재력을   온전히 끌어내십시오. 모든 분석은 Heikin Ashi 가격 흐름을 중심으로 설계되었습니다. Apex Market S
Title:FX-AIEA Supply and Demand Zone Indicator (MT5) — Technical Overview Version: 2.51 | Platform: MetaTrader 5 Introduction Supply and demand zones are considered a core manifestation of institutional order flow, providing a more direct reflection of buying and selling pressure than traditional support/resistance levels. This indicator attempts to automate the identification of high-probability supply and demand zones using an adaptive ZigZag algorithm, reducing the subjectivity and time asso
Footprint is an indicator for order flow and volume analysis. It helps identify market structure at the cluster level, find key zones with increased activity, and work with filters directly on the chart without constantly opening the settings window. Footprint Indicator Features cluster-based Bid x Ask and Delta charts; on-chart control panel; sliders for filter adjustments; Absorption; Initiative; Stacked Imbalances; Big Trades; dPOC / Dynamic Point of Control; Delta; side market profile; cumul
Zain Gold ScalpingV5
Ahmed Gamal Abdel Nasser Mohamed
Zain Gold Scalping V5 is a technical analysis indicator for MetaTrader 5 designed for Forex and Gold markets. It provides chart-based market information, trend analysis, signal conditions, and an on-screen dashboard to help traders analyze price movement across multiple timeframes. Main Features The indicator supports multiple timeframes, including M1, M5, M15, M30, H1 and higher timeframes. It can be used with Gold (XAUUSD), Forex currency pairs, indices and other supported instruments. The in
Boom & Crash & PainX & GainX Ultimate Spike Detector Trade Spikes With Confidence — Not Guesswork Catching spikes should be one of the most profitable strategies in synthetic markets. But for most traders, it becomes one of the most frustrating. You enter too early… price goes against you. You wait for a spike… it never comes. You finally catch one… but don’t know whether to hold or close. You make profit… then give it all back because there’s no exit plan. This is exactly the problem the Ultim
OrderFlow Absorption – MT5용 전문 델타 & 흡수 신호 인디케이터 OrderFlow Absorption으로 진정한 오더플로우 분석의 힘을 경험하세요. MetaTrader 5를 위한 궁극의 델타 히스토그램 및 흡수 신호 인디케이터입니다. 가격 움직임의 이면에서 실제로 무슨 일이 일어나는지 알고 싶은 트레이더를 위해 설계된 이 도구는, 시장을 움직이는 숨겨진 매수/매도 압력과 흡수 이벤트를 드러냅니다. 주요 기능 델타 히스토그램 시각화:   매수와 매도 압력을 색상별 히스토그램으로 즉시 확인할 수 있습니다. 흡수 신호 감지:   고급 로직으로 강세 및 약세 흡수 이벤트를 식별하여 반전 신호를 미리 알려줍니다. 차트 마커:   흡수 신호가 차트에 직접 표시되어 시각적으로 쉽게 확인할 수 있습니다. 팝업 알림:   새로운 흡수 신호가 발생하면 실시간으로 알림을 받을 수 있습니다. 사용자 지정 임계값:   약한 신호는 필터링하고, 확률이 높은 기회에 집중할 수 있습니다.
VTrende Pro
Andrii Diachenko
5 (1)
VTrende Pro - MTF indicator for trend trading with a display panel for MT5 *** Videos can be translated into any language using subtitles (video language - Russian) Although the signals of the VTrende Pro indicator can be used as signals of a full-fledged trading system, it is recommended to use them in conjunction with the Bill Williams TS. VTrende Pro is an extended version of the VTrende indicator. Difference between Pro version and VTrende: - Time zones - Signal V - signal 1-2 waves -    S
SMC Institutional Suite
Catur Cipto Nugroho
SMC Institutional Suite v3.7 Professional Smart Money Concept Indicator for MetaTrader 5 What is New in Version 3.7 - Visual Stability Update This release focuses entirely on one goal: making every zone, label, and line on your chart rock-solid stable. There is no more flickering, no more zones disappearing on a new candle, and no more duplicate drawings. Order Block (OB) zones no longer flicker or disappear. Once drawn, they stay permanently on the chart. Equal Highs and Equal Lows (EQH / EQL)
PrimeScalping
Temirlan Kdyrkhan
PrimeScalping is a powerful trading companion designed to generate high-probability entry signals with dynamic TP/SL/DP levels based on volatility. Built-in performance tracking shows win/loss stats, PP1/PP2 hits, and success rates — all updated live. Key Features: Buy/Sell signals with adaptive volatility bands Real-time TP/SL/DP levels based on ATR Built-in MA Filter with optional ATR/StdDev volatility Performance stats panel (Success, Profit/Loss, PP1/PP2) Alerts via popup, sound, push, or e
MasterTrend
Temirlan Kdyrkhan
MasterTrend Indicator for MT5 A powerful trend-following and signal-evaluation tool MasterTrend   is a custom MT5 indicator that combines Moving Averages and ATR-based risk/reward logic to generate clear buy/sell signals. It visualizes dynamic SL/TP levels, evaluates past trade outcomes, and displays win/loss statistics in a clean on-chart panel. Key features include: Buy/Sell signals based on MA crossovers ATR-based SL/TP1/TP2/TP3 levels with visual lines and labels Signal outcome tracking wit
Volality 75 Boom crash VIX
Cristofher Robles
4.5 (2)
Volatility 75 Boom Crash VIX Pro V2 Volatility 75 Boom Crash VIX Pro V2 is a high-performance trading indicator specifically engineered for Synthetic Indices (Deriv) and Forex . This tool focuses on identifying institutional liquidity zones and generating high-accuracy, non-repainting signals based on Price Action and Fibonacci levels. Key Advantages: No Repainting: Once a signal arrow appears and the candle closes, it will never move or disappear. Institutional Liquidity Zones: Automatically ca
SMC Sweep Fvg MT5
Daniil Sleptsov
5 (1)
SMC Sweep Fvg MT5 — 스마트 머니처럼 시장을 보세요, 차트 위에서 바로 이런 경험, 알고 계실 겁니다. 가격이 스톱을 훑고, 돌아서, 기대했던 방향으로 그대로 갑니다. 방향은 맞았습니다. 틀린 것은 진입뿐이었습니다. 이 지표는 그런 일이 덜 일어나도록 만들어졌습니다. 분석에서 가장 무거운 부분—차트 마킹—을 대신하고, 진짜 중요한 것인 결정은 당신에게 남깁니다. 차트에서 보이는 것 시장 구조 — 실제 구조적 고점·저점에 HH / HL / LH / LL 라벨과 레벨 라인. 추측 없이 추세가 바로 보입니다. 불균형 구간(FVG) — 가격이 너무 빠르게 지나갔고 나중에 자주 되돌아오는 영역. 열린 구간과 이미 메워진 구간은 다른 색으로 표시됩니다. 유동성 행동 — 반전 전에 시장이 레벨을 훑는 순간을 추적합니다. 완성된 트레이드 레이아웃 — 진입 화살표, 손절 레벨, 이익 목표. 모두 그려져 있어 머릿속 계산이 필요 없습니다. 추세 필터 — 상위 타임프레임 라인으로
==================================================================== SMC Pro v6.1 APEX AI — XAUUSD Gold Empire MetaTrader 5 지표 · Smart Money Concepts · 예측 인텔리전스 엔진 ==================================================================== SMC Pro v6.1 APEX AI는 MetaTrader 5의 XAUUSD(골드) 전용으로 제작된 전문 Smart Money Concepts 지표 시스템입니다. 완전한 SMC 프레임워크 — Order Blocks, Liquidity sweeps(유동성 스윕), Fair Value Gaps, Break of Structure, Change of Character — 에 AI 기반의 8개 신규 모듈을 결합하여, 정밀한 시각적 신호, 예측 궤적선, 색상으로 구분된 SL/T
" Blow It Up!" - The Trading Indicator That Questions Your Life Choices Tired of boring indicators? Meet your new market companion that delivers: "YOLO BUY!" arrows when you should probably panic Explosive rectangle confetti (because why not?) 200+ soul-crushing quotes like "Your stop loss is imaginary" and "This is n't trading, it's donating to whales" Random alerts that roast your strategy This Indicator is lik e Therapy - Because daytrading shouldn't fe el like watching paint dry! Highlights
TraderHUD
Justino Porto Neto
5 (1)
TraderHUD v2 — 전문 트레이더를 위한 완벽한 대시보드 TraderHUD v2 는 MetaTrader 5용 가장 완벽한 시각적 지표의 진화 버전입니다. 트레이더가 더 현명한 결정을 내리기 위해 차트에서 봐야 할 모든 것을 하나의 도구에 통합합니다: 시간적 맥락, 달러 강도, 통계적 범위, 피벗 레벨, 움직임 속도, 매크로 트렌드 — 모두 통합되고 설정 가능하며 차트를 어지럽히지 않습니다. 이 버전은 실제 라이브 트레이딩 사용 경험을 바탕으로 제작되었으며, 명확한 철학을 따릅니다: 더 많은 맥락, 더 적은 노이즈 . v2의 새로운 기능 8개 모듈을 단일 지표로 완전 통합 DayRange와 DollarFlow가 자동 연결된 설정 가능한 사이드 패널 정시 표시와 함께 시장 세션 마킹 레벨 간 평균선 옵션이 있는 클래식 피벗 포인트 베타로 표시된 두 개의 실험적 모듈: 변동성 및 매크로 트렌드 평균 완전히 설정 가능한 레이아웃 — 코너, 너비, 색상 및 글꼴 모듈 타이머 및 스
XCalper TFO
Aecio de Feo Flora Neto
This oscillator was developed exclusively by xCalper in 2015 based on moving averages calculations to indicate and try predicting oversold and overbought levels. The fast line (white, by default) oscillates basically between values -0.5 (oversold) and +0.5 (overbought). Whenever this line crosses upward value -0.5, it means an oversold price level. When it crosses downward value +0.5, it means an overbought price level. When fast line crosses value 0.0 and returns, it is a strong pull-back indic
Pan PrizMA CD Phase
Aleksey Panfilov
The Expert Advisor and the video are attached in the Discussion tab . The robot applies only one order and strictly follows the signals to evaluate the indicator efficiency. Pan PrizMA CD Phase is an option based on the Pan PrizMA indicator. Details (in Russian). Averaging by a quadric-quartic polynomial increases the smoothness of lines, adds momentum and rhythm. Extrapolation by the sinusoid function near a constant allows adjusting the delay or lead of signals. The value of the phase - wave s
Классификатор силы тренда. Показания на истории не меняет. Изменяется классификация только незакрытого бара. По идее подобен полной системе ASCTrend, сигнальный модуль которой, точнее его аппроксимация в несколько "урезанном" виде, есть в свободном доступе, а также в терминале как сигнальный индикатор SilverTrend . Точной копией системы ASCTrend не является. Работает на всех инструментах и всех временных диапазонах. Индикатор использует несколько некоррелируемых между собой алгоритмов для класси
제작자의 제품 더 보기
Title:FX-AIEA Supply and Demand Zone Indicator (MT5) — Technical Overview Version: 2.51 | Platform: MetaTrader 5 Introduction Supply and demand zones are considered a core manifestation of institutional order flow, providing a more direct reflection of buying and selling pressure than traditional support/resistance levels. This indicator attempts to automate the identification of high-probability supply and demand zones using an adaptive ZigZag algorithm, reducing the subjectivity and time asso
本EA通过智能AI程序筛选符合条件的订单,以毫秒级极速按使用者任意条件进行平仓; 帮助交易员快速 平盈利单:平仓该图表品种所有盈利的单,获得利润; 帮助交易员快速 平亏损单:平仓该图表品种所有亏损的单,截断亏损; 帮助交易员快速 SELL平仓:平仓该图表品种所有SELL的单,快速解套锁仓; 帮助交易员快速 BUY平仓:平仓该图表品种所有BUY的单, 快速解套锁仓; 帮助交易员快速 全部平仓:平仓该图表品种所有单,快速落袋为安。 智能快速平仓面板:共五个按钮 平盈利单:平仓该图表品种所有盈利的单 平亏损单:平仓该图表品种所有亏损的单 SELL平仓:平仓该图表品种所有SELL的单 BUY平仓:平仓该图表品种所有BUY的单 全部平仓:平仓该图表品种所有单
자동손익정지: ea는 매우 지능적인 프로그램을 사용하는데 주문 그래프를 실시간으로 추적합니다. ea 가 로드된 차트상의 주문을 정확하게 포착합니다. ea는 자동적으로 주문에 흑자와 손실을 추가하도록 설정했다. 거래자의 주문 발주 시간을 대폭 절약할 수 있으며, 주문 후 ea는 자동으로 흑자와 손실을 동시에 추가한다 또한 흑자와 손실을 막는 것을 잊어버린 거래자에게 자금 보호 장벽을 추가하기도 한다. 건의: 화폐 쌍:화폐 시간 범위:임의의 최소예금액:요구없음 브로커 시간:gmt +3 계정 유형:ecn, raw 또는 razor, 스프레드가 매우 낮다. 중요:최적의 결과를 얻기 위해서는 낮은 스프레드 계정을 사용하는 것이 매우 중요합니다! 규격: 스톱 sl 스톱 tp 매직 넘버 설정은 매우 간단하며 설정을 변경할 필요가 없으며, 기본 설정은 gmt +2와 dst 서버 시간을 사용하는 대부분의 브로커들에게 적합하다. ea는 vps를 사용하여 24시간 (24/7) 작업할 수
This utility sets the same stop loss and take profit level on several open positions at the same time. It does not open or close any trade and it makes no market decision. Modifying positions one by one in the terminal takes time, and while you are doing it the price can move away. This EA applies the levels you enter to all selected positions in one action, so the whole basket is protected in a single step. Example You hold five XAUUSD buy positions opened at 2510, 2508, 2506, 2504 and 2495
江恩理论 江恩理论是金融市场分析中的一种重要工具,它基于市场周期性和自然法则的假设,通过特定的技术分析工具来预测市场走势。江恩理论的主要内容包括: 市场周期 :江恩认为市场存在周期性波动,这些周期可以通过特定的时间周期和价格周期来识别。 价格和时间 :江恩理论强调价格和时间之间的相互作用,认为两者是市场分析的关键要素。 江恩角度线 :这是江恩理论中的一种重要技术分析工具,用于识别市场的支撑和阻力水平。 江恩轮中轮 :又称“江恩圆形图”,是江恩发明的另一种重要技术分析工具,用于预测市场的未来走势。 量化分析 :T3指标可能通过特定的数学模型或算法来量化市场的行为或特征。 趋势识别 :T3指标可能用于识别市场的趋势方向,包括上升趋势、下降趋势或横向整理。 交易信号 :基于T3指标的分析,投资者可能能够获得买入或卖出的交易信号。
This indicator combines six classic oscillators in one chart window and draws each of them as two lines. One input switches between them, so you can compare signals without loading several separate indicators. Available types: MACD, KDJ, RSI, CCI, RVI and DeMark. The two lines work like the main line and the signal line of the selected oscillator. When the fast line crosses the slow line, the direction changes and the lines switch colour: one colour after an upward cross, another after a downw
AI Fibonacci Indicators (Non-Redraw) is a professional and easy-to-use AI fully automated Fibonacci generator Forex trading indicator that uses the latest AI technology to automatically identify accurate Fibonacci positions on charts and automatically plot them on charts. This indicator provides accurate Fibonacci important price positions. Applicable to any currency pair and other products. It has seven function switches, There are five different Fibonacci types (" Fibonacci retracement line "
TwoLineMACD
Xin You Lin
Two line MACD index composition MACD line (express line) : Usually calculated by subtracting the 12-cycle EMA from the 26-cycle EMA, it is more sensitive to price changes, can quickly reflect the change of the recent price trend, its fluctuation is relatively frequent, used to capture the dynamics of short-term market trends. Signal line (slow line) : Generally a 9-cycle EMA of the MACD line, its role is to smooth the MACD line, filter out some short-term noise and false signals, make the indic
AI Supertrend timely alerts MT4 Super Trend timely reminder indicator introduction I. Overview of indicators The MT4 Super Trend Alert Indicator is a technical analysis tool specifically designed for the MetaTrader 4 platform to help traders accurately capture changes in market trends and send timely signals to alert traders to potential trading opportunities. It is based on a unique AI-based algorithm that takes into account factors such as price volatility, trend strength, and market volatil
MT4 platform AI T3 MA Super Fill indicator use introduction I. Overview of indicators The AI T3 MA Super Fill indicator is a powerful analytical tool that combines advanced algorithms and T3 moving average technology to provide traders on the MT4 platform with accurate market trend judgments and trading signals. It uses intelligent algorithms to deeply process the price data, and displays the changes of the T3 moving average in a unique way to help traders more effectively grasp the market dyn
MT4CandleTime index introduction MT4CandleTime is an indicator for the MT4 platform, which can display the remaining time of the current K line in the form of an intuitive digital countdown, which is convenient for traders to grasp the trading rhythm. Precise time control: The MT4CandleTime indicator provides traders with extremely accurate K-line remaining time data, enabling them to fine manage the time rhythm in the trading process, avoiding the hasty or delayed trading decisions caused by
This indicator draws the volume bars as a colour gradient instead of a single flat colour, so that strong and weak volume can be told apart at a glance. Every bar is compared with the average volume over a lookback period you set. The further a bar stands above that average, the deeper its colour; bars near or below the average are drawn in a pale shade. The hue follows the candle direction, one colour for volume on rising candles and another for volume on falling candles, so the balance betwe
MT4 ATR Stops indicator introduction: This is a dynamic support resistance indicator based on average true volatility (ATR) that calculates the volatility of the price, plots the channel on a K chart, and suggests trading timing with intuitive color and dot-like signals. Open and close positions 1. Go long (go long) Signal feature: The color of the K line changes to green, and a green dot appears on the chart. Logic: Price broke above the dynamic upper track resistance calculated by ATR, indica
This EA deletes pending orders that stay on the account longer than a period you define. It does not open or close any market position and it makes no trading decision. Note on the name: "timeframe" here means the lifetime of an order in minutes, not the chart period. The EA works on any chart timeframe; what matters is how long a pending order has existed. A pending order that has been forgotten can occupy margin or get filled at a price you no longer want. This utility removes such orders a
Time-Based Auto-Close Order Management Tool (MT4) — Technical Description Overview This is an automated order management EA based on time-algorithm logic. Its core function is to automatically execute preset closing operations when user-defined holding periods expire, aiming to help traders enforce predetermined rules mechanically and reduce emotional interference. Core Closing Modes Closing Mode Functional Definition Close All Closes all eligible positions when the set time is reached. Close
Multi-Timeframe Anchored VWAP Indicator (Custom Period & Standard Deviation Channels) — MT5 Technical Description Overview This indicator extends the traditional VWAP with multi-timeframe anchoring, session reset, and standard deviation channels, providing a dynamic "fair value" reference area for traders. All calculations are based on currently visible price and volume data; the indicator contains no future functions, does not repaint, and does not drift. Core Features Multi-Timeframe Anchori
Multi-Timeframe Anchored VWAP Indicator (Custom Period & Standard Deviation Channels) — Technical Description Overview This indicator extends the traditional VWAP with multi-timeframe anchoring, session reset, and standard deviation channels, providing a dynamic "fair value" reference area. All calculations are based on currently visible price and volume data; the indicator contains no future functions, does not repaint, and does not drift. Core Features Multi-Timeframe Anchoring Automatically
VWAP Volume Price Customized Cycle FX-AIEA — Multi-Timeframe Anchored VWAP Indicator (Technical Features & Parameter Discussion) Overview This indicator extends the traditional VWAP (Volume Weighted Average Price) with multi-timeframe anchoring and customizable session reset mechanisms, aiming to provide a dynamic "fair value" reference area. The indicator constructs symmetric volatility boundaries via triple standard deviation channels (±1σ/±2σ/±3σ), which can serve as reference dynamic support
Title: Smart Quant Enhanced Indicator (Adaptive Nonlinear Filtering & Ensemble Learning Framework) — Technical Features & Algorithmic Logic Description Overview This indicator integrates adaptive nonlinear time series analysis with Ensemble Learning algorithms to statistically model the deeper microstructure of price movements. It presents multidimensional data views via dynamic vector arrows and volatility channel bands on the chart, incorporating a built-in Kalman Filter for real-time noise re
Smoothed Average K Line FX-AIEA — Dual-Layer Composite Smoothing Trend Momentum Indicator (Algorithm & Parameter Discussion) Overview This indicator employs a dual-layer composite smoothing architecture to perform dynamic denoising and structural reconstruction on the OHLC dimensions of price data, generating a standardized momentum histogram. The thin bars respond to short-term momentum pulses, while the thick bars confirm trend direction over a larger scale. Synchronized resonance of both incr
AutoPivot FXAIEA — see the day's support and resistance at a glance In intraday trading, the hardest part is not spotting a pattern. It is answering the most basic question of all: where will price meet resistance today, where will it find support, and which level actually matters. AutoPivot FXAIEA turns that into something you can simply read off the chart. Every trading day it draws the central pivot P with up to four resistance levels R1–R4 and four support levels S1–S4. Which level price is
This utility sets the same stop loss and take profit level on several open positions at the same time. It does not open, close or analyse any trade. Modifying positions one by one in the terminal takes time, and while you are doing it the price can move away. This EA applies the levels you enter to all selected positions in one action, so the whole basket is protected in a single step. Example You hold five XAUUSD buy positions opened at 2510, 2508, 2506, 2504 and 2495. You enter 2530 as tak
This EA does not open trades. You open your positions yourself, and the EA handles the exit. It monitors the total floating result of all open positions on the account. As soon as the total profit reaches the target you set, every open position is closed at once. The same rule works in the opposite direction: when the total loss reaches the limit you set, all positions are closed automatically. Opening a trade takes a few seconds. Deciding when to close it is what makes the difference. This u
This EA deletes pending orders that stay on the account longer than a period you define. It does not open or close any market position and it makes no trading decision. A pending order that has been forgotten can block margin or get filled at a price you no longer want. This utility removes such orders automatically once they pass the time limit you set, so your capital stays available and your order list stays clean. Key features - Deletes pending orders after a configurable time in the ter
Time-Based Auto-Close Order Management Tool (MT5) — Technical Description Overview This is an automated order management EA based on time-algorithm logic. Its core function is to automatically execute preset closing operations when user-defined holding periods expire, aiming to help traders enforce predetermined rules mechanically and reduce emotional interference. Core Closing Modes Closing Mode Functional Definition Close All Closes all eligible positions when the set time is reached. Close
Multi-Timeframe Anchored VWAP Indicator (Custom Period & Standard Deviation Channels) — MT5 Technical Description Overview This indicator extends the traditional VWAP with multi-timeframe anchoring, session reset, and standard deviation channels, providing a dynamic "fair value" reference area for traders. All calculations are based on currently visible price and volume data; the indicator contains no future functions, does not repaint, and does not drift. Core Features Multi-Timeframe Anchori
RockFirm FX-AIEA V5.18 — Adaptive AI Gold Trading Algorithm (Technical Description) Overview This EA is built on reinforcement learning and time-series prediction algorithms, specifically designed for XAUUSD M5 timeframe. It incorporates a dynamic volatility perception module that adapts trading logic based on market volatility characteristics, rather than relying on fixed grid or Martingale strategies. Core Algorithm Features AI Decision Model : Trained on historical gold data, integrating ma
AutoPivot FXAIEA — see the day's support and resistance at a glance In intraday trading, the hardest part is not spotting a pattern. It is answering the most basic question of all:   where will price meet resistance today, where will it find support, and which level actually matters. AutoPivot FXAIEA turns that into something you can simply read off the chart. Every trading day it draws the central pivot P with up to four resistance levels R1–R4 and four support levels S1–S4. Which level price i
필터:
리뷰 없음
리뷰 답변