Triple Trend for MT4
- 지표
-
Minh Truong Pham
 Hello, my name is Pham and I am a programmer and trader! At here, I create amazing forex indicators and expert advisors for Metatrader.
I will try:
+ Provide best tools base on my 5 years experience as a trader and 10 years as a programmer. - 버전: 1.0
- 활성화: 5
Triple Trend Indicator is a versatile trend-following tool designed to help traders identify trend strength and potential pullback levels using a three-band system. Each band represents a varying degree of price deviation from the mean, providing progressively stronger trend signals.
🔵Key Features:
🔵Usage:
The Triple Trend Indicator is an ideal tool for trend traders looking for structured signals and dynamic support and resistance levels to optimize entries and exits.
🔵Key Features:
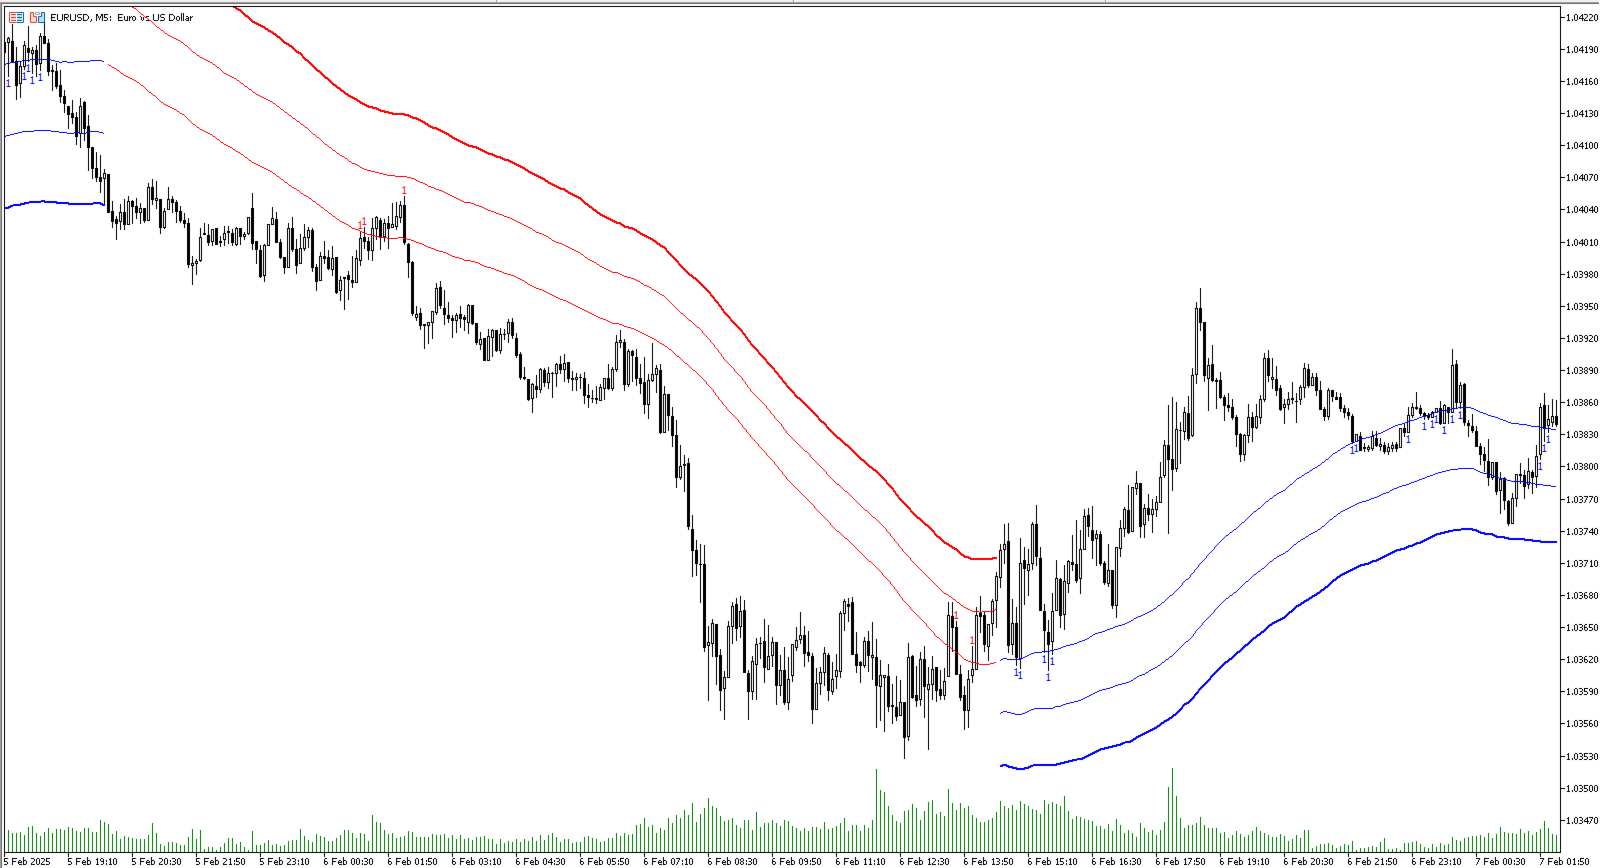
- Three Adaptive Bands:
The indicator dynamically calculates three bands (1, 2, and 3) based on moving averages (SMA, EMA, WMA) and ATR multipliers.
Bands are positioned below the price in an uptrend and above the price in a downtrend, offering clear trend direction visualization.
Figure 2
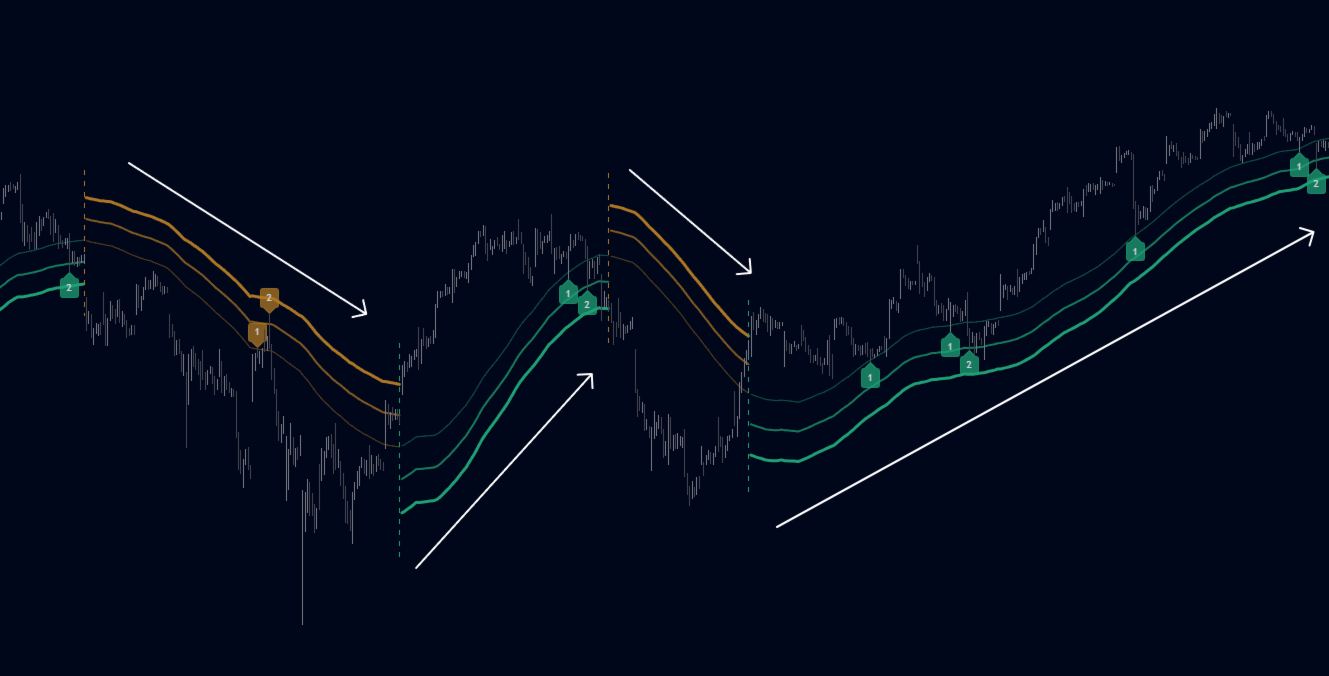
- Signal System:
Signals are generated when price interacts with the bands: - Signal 1: Triggered when the price touches Band 1, indicating a minor pullback within the trend.
Figure 3
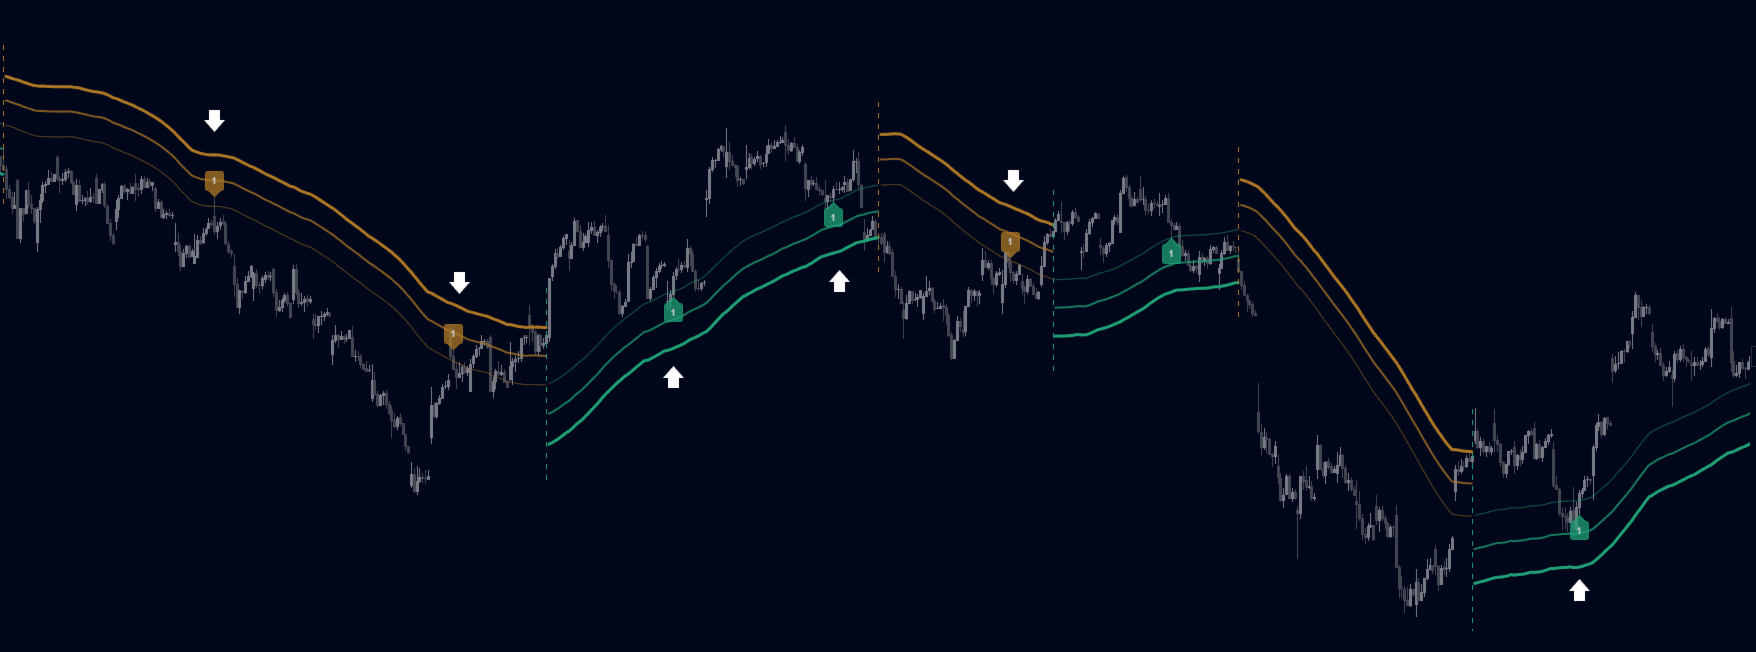
- Signal 2: Triggered at Band 2, showing a stronger price deviation and trend confirmation.
Figure 4
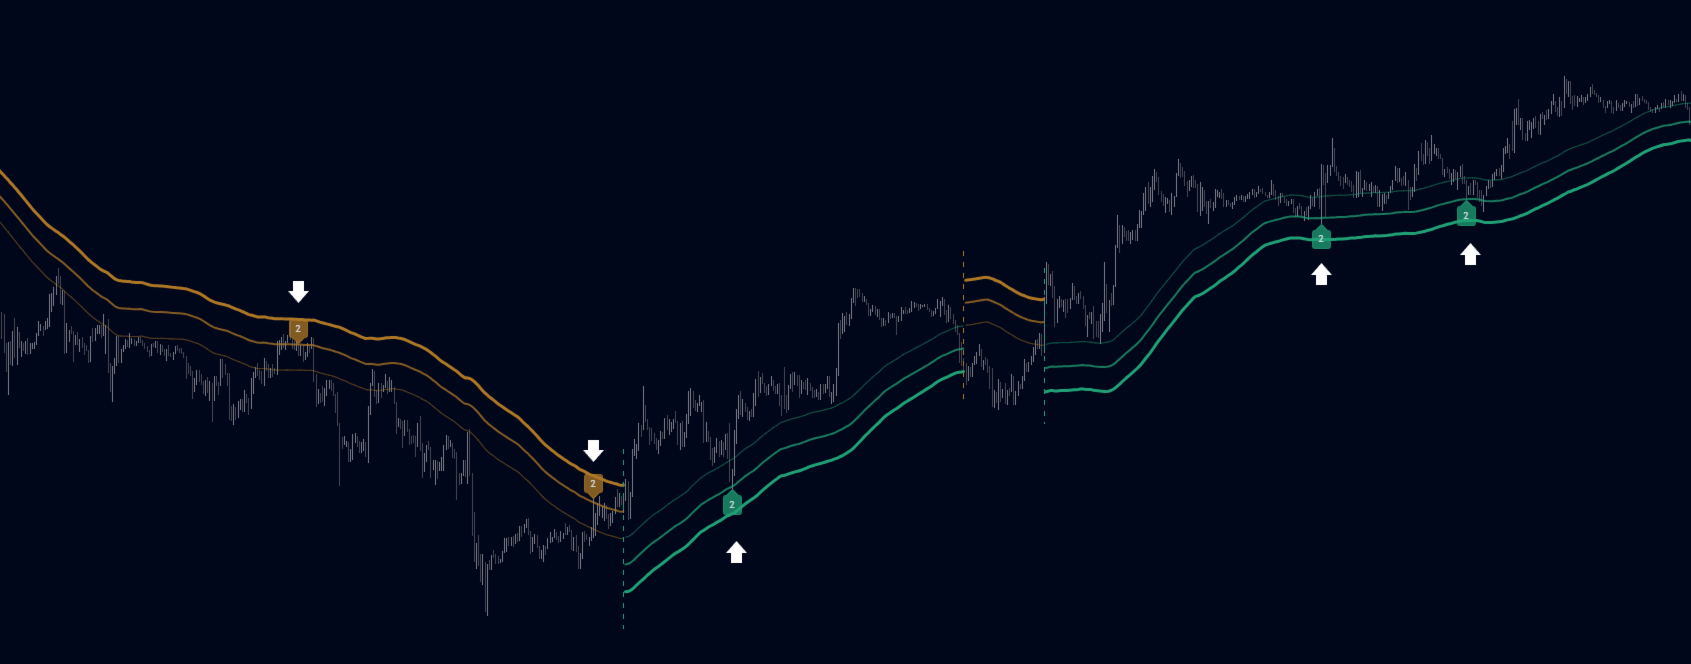
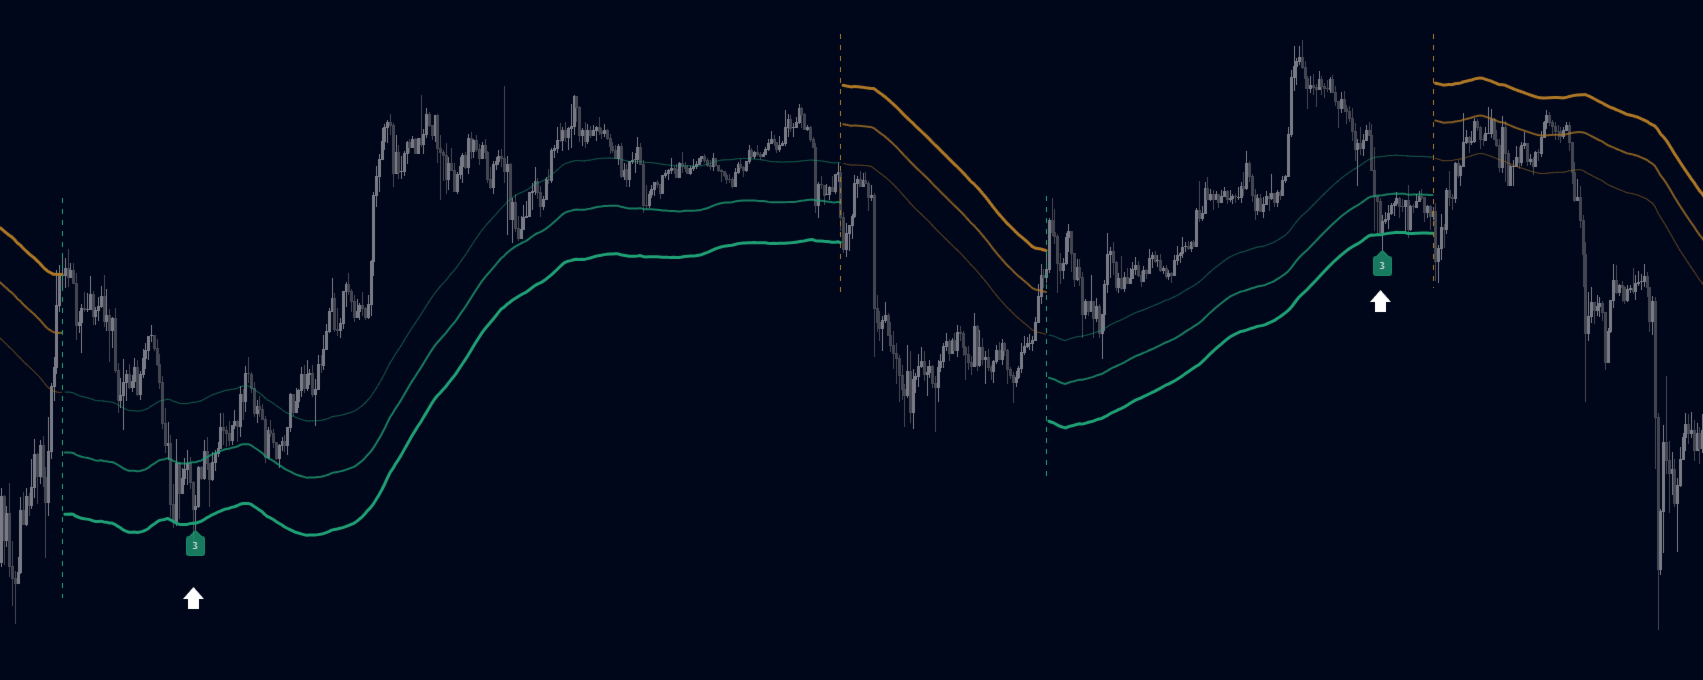
- Signal 3: Triggered at Band 3, representing the most significant price deviation and strongest trend signal.
Figure 5
The further the price deviates from the mean, the stronger the trend signal, with Signal 3 being the most robust.
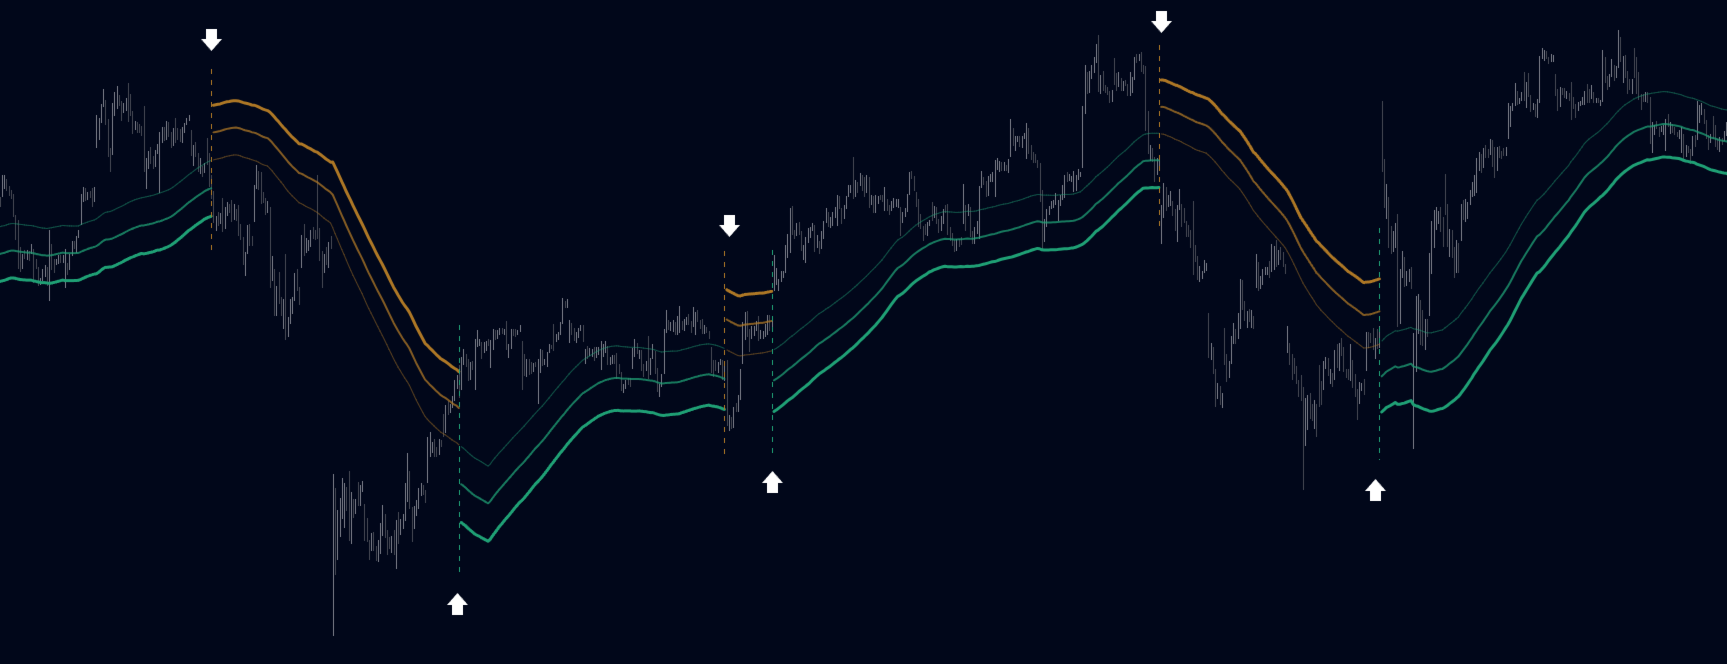
- Color-Coded Bands:
Bands dynamically change color based on the trend direction: - Green bands signify an uptrend.
- Brown bands signify a downtrend.
- Use the bands to identify trend direction and strength.
- Monitor the signal system to assess the level of price deviation and potential pullback strength.
- Combine Signal 1, 2, and 3 to confirm trend momentum:
- Signal 1 suggests a weaker pullback and continuation.
- Signal 2 indicates a stronger trend confirmation.
- Signal 3 highlights the strongest momentum and potential exhaustion points.
- Utilize the color-coded bands for an intuitive understanding of current market conditions.
The Triple Trend Indicator is an ideal tool for trend traders looking for structured signals and dynamic support and resistance levels to optimize entries and exits.