Visual Williams Cross Indicator
- 지표
- AL MOOSAWI ABDULLAH JAFFER BAQER
- 버전: 1.22
- 업데이트됨: 23 3월 2025
- 활성화: 5
The Visual Williams Cross Indicator is a tool designed to help traders spot market movements by utilizing Williams %R crossings. This indicator helps identify trend shifts, reversals, and entry points. It is not optimized and is intended for customization to suit your specific trading style.
How It Works
The Visual Williams Cross Indicator uses the Williams %R oscillator, a momentum indicator that tracks overbought and oversold conditions. It detects when the Williams %R line crosses important threshold levels, providing insights into potential market movements.
Core Logic
- Detects crossings of the Williams %R line above or below predefined levels like -20 (overbought) and -80 (oversold).
- These crossings signal potential trend reversals or trend continuations.
- By visualizing these points on your chart, the indicator reduces decision-making uncertainty.
Entry Logic
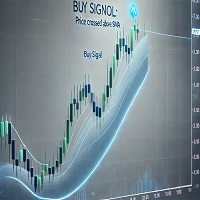
- Bullish Entry: The Williams %R line crossing above -80 signals a potential upward price movement, ideal for long positions.
- Bearish Entry: The Williams %R line crossing below -20 signals a potential downward price movement, ideal for short positions.
Customizable Alerts
You can set alerts to notify you in real time when a crossing happens, ensuring you never miss an opportunity.
Why Choose This Indicator
- Simplifies market analysis by identifying overbought and oversold conditions.
- Customizable to align with your trading plan.
- Perfect for optimization, allowing you to adjust it to your needs.
Optimize It Your Way
This indicator serves as a foundation for your strategy. Adjust settings, test across timeframes, and tailor it to fit your trading instruments.
Support
For any questions or help, feel free to reach out via direct message. I'm here to assist!


