Smart Linear Regression
- 지표
-
Suvashish Halder
 💧 PRO TIP - Don't Open Orders Where You See, Open Them Where Others Can't!
📈 Decoding Market Phases Like Never Before – The SuvashishFx Revolution! - 버전: 1.0
- 활성화: 10
The Smart Linear Regression indicator is a powerful, non-repainting tool designed for traders looking for enhanced accuracy in market analysis. Unlike the typical linear regression channels that often repaint, this indicator provides reliable insights without changing past values, making it more trustworthy for forecasting future price movements.
MT5 Version - https://www.mql5.com/en/market/product/124894/
Overview:
The Smart Linear Regression Indicator goes beyond the basic linear regression channel by offering dynamic features to help traders visualize trends, identify overbought/oversold conditions, and anticipate potential price movements. Through its advanced linear regression channels, bands, and future projections, this tool gives traders the ability to spot key levels, helping improve decision-making in various market conditions.
Key Features:
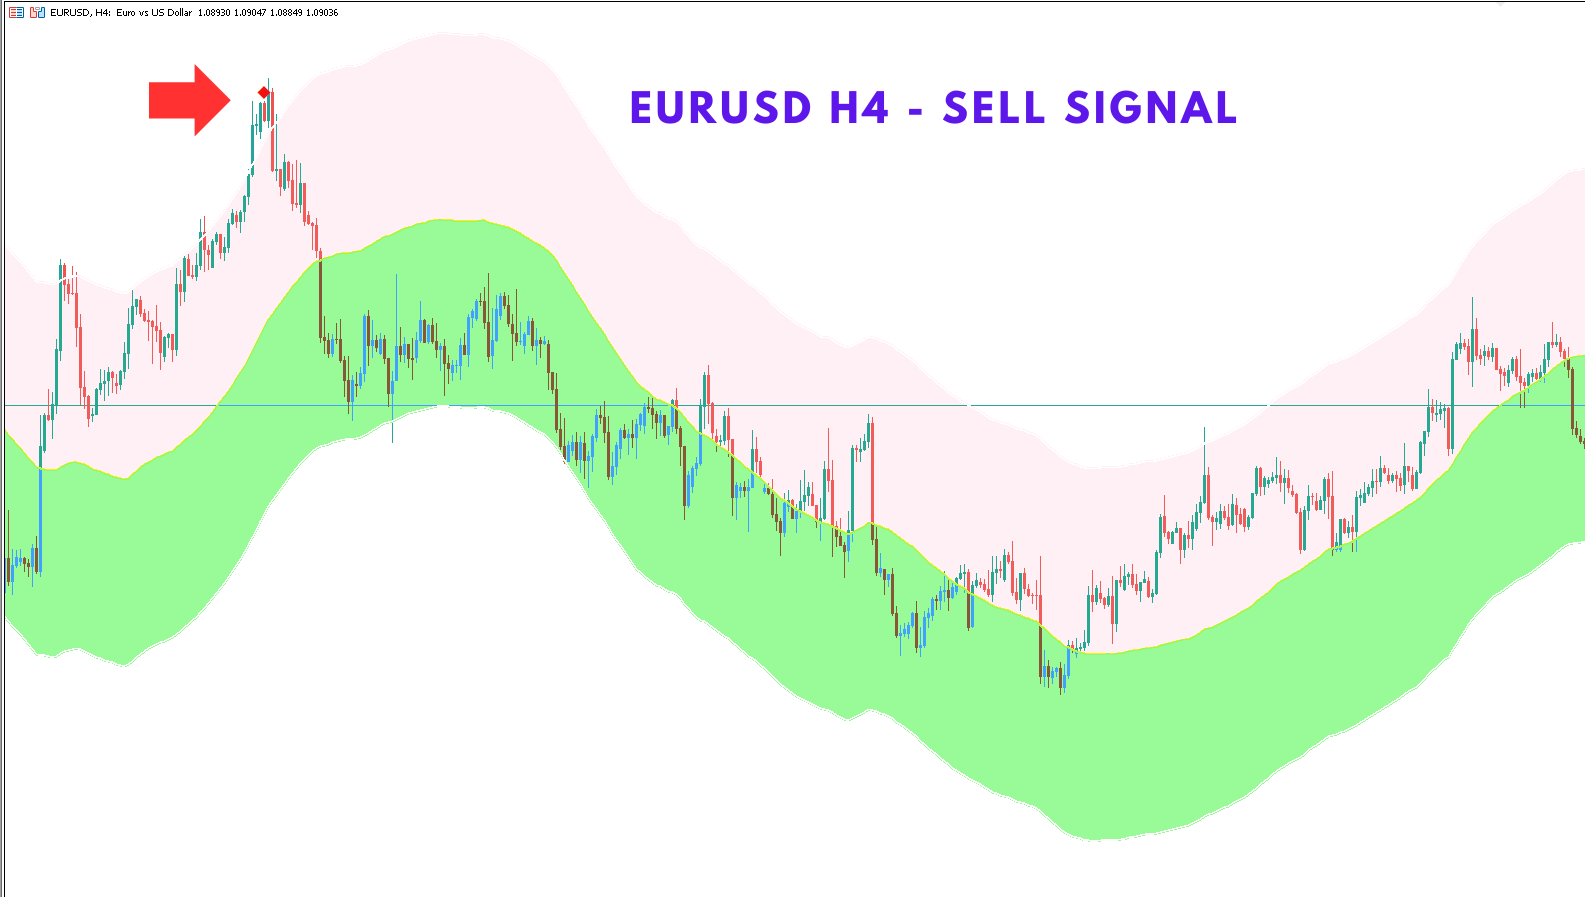
1. Linear Regression Bands (Non-Repainting)
- Input: Plot Linear Regression Bands
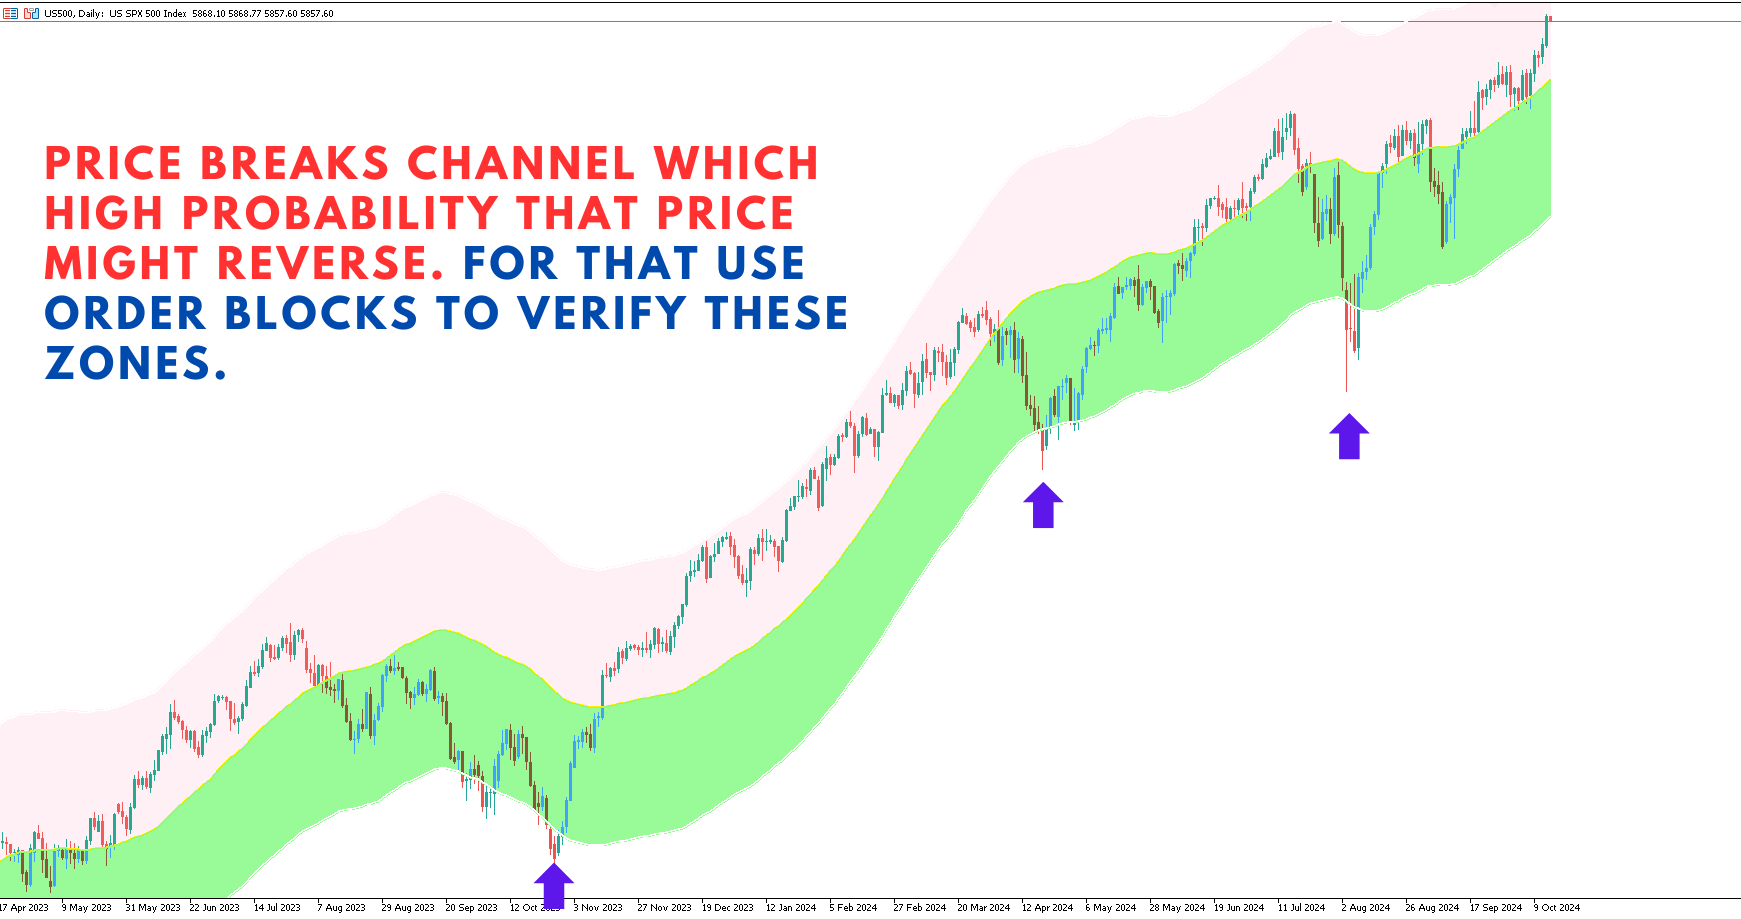
- Description: These bands show overbought and oversold levels based on linear regression, aiding in spotting key reversal zones.
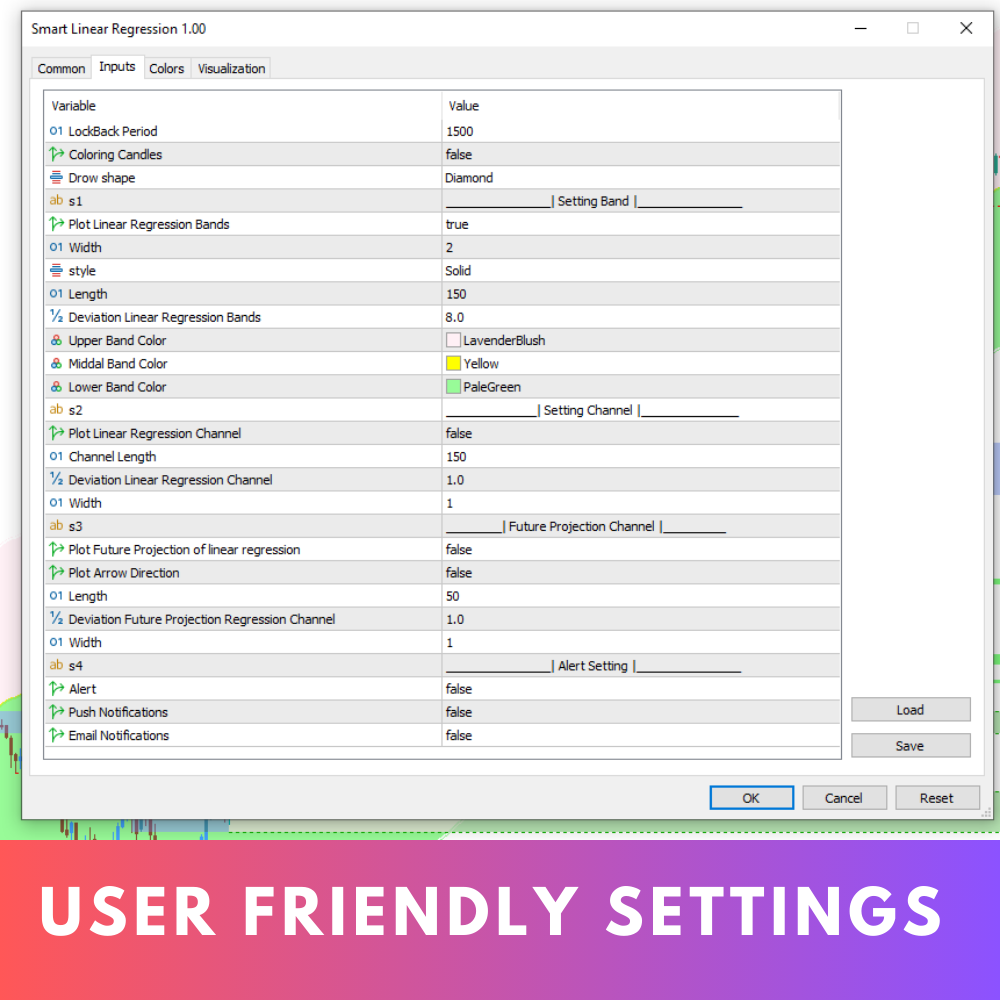
- Customizable Parameters:
- Length: Defines the look-back period for calculating the regression.
- Deviation: Determines the width of the bands based on standard deviations from the regression line.
2. Linear Regression Channel (Non-Repainting)
- Input: Plot Linear Regression Channel
- Description: This channel highlights the main trend, showing where price is likely to move within a specific range.
- Customizable Parameters:
- Channel Length: Defines the look-back period for the channel calculation.
- Deviation: Adjusts the width of the channel.
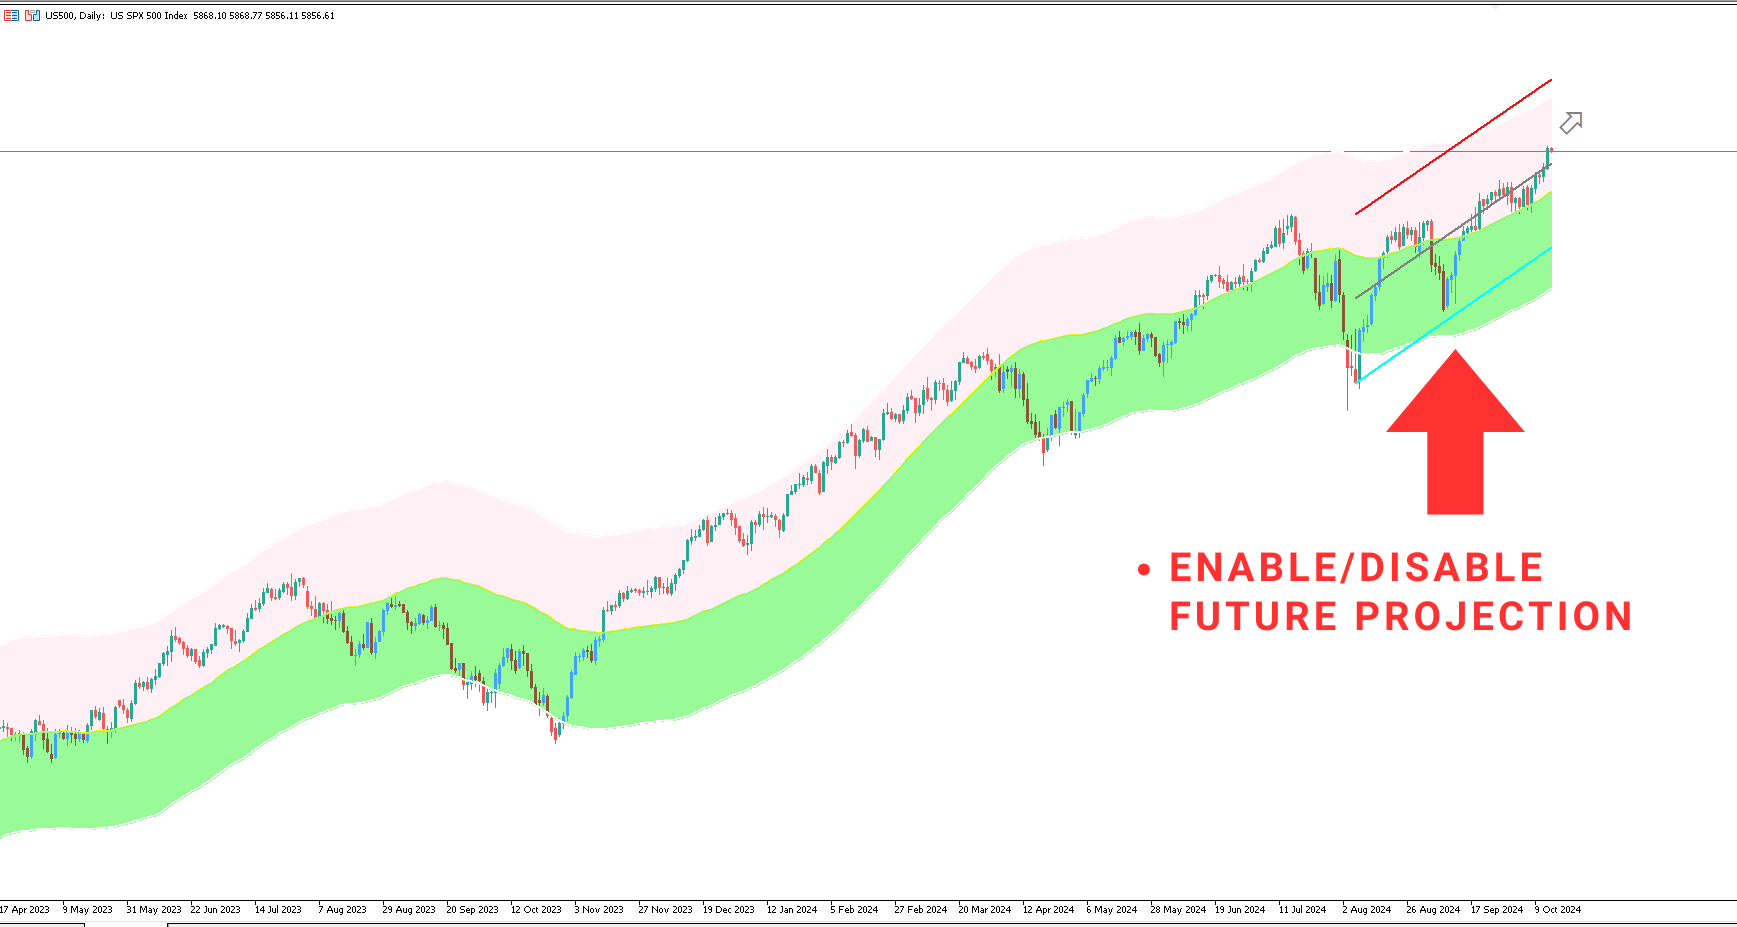
3. Future Projection Channel
- Input: Plot Future Projection of Linear Regression
- Description: This feature projects the linear regression channel into the future, providing insights for potential price targets.
- Customizable Parameters:
- Length: Defines the look-back period for projection.
- Deviation: Adjusts the width of the projected channel for forecasting.
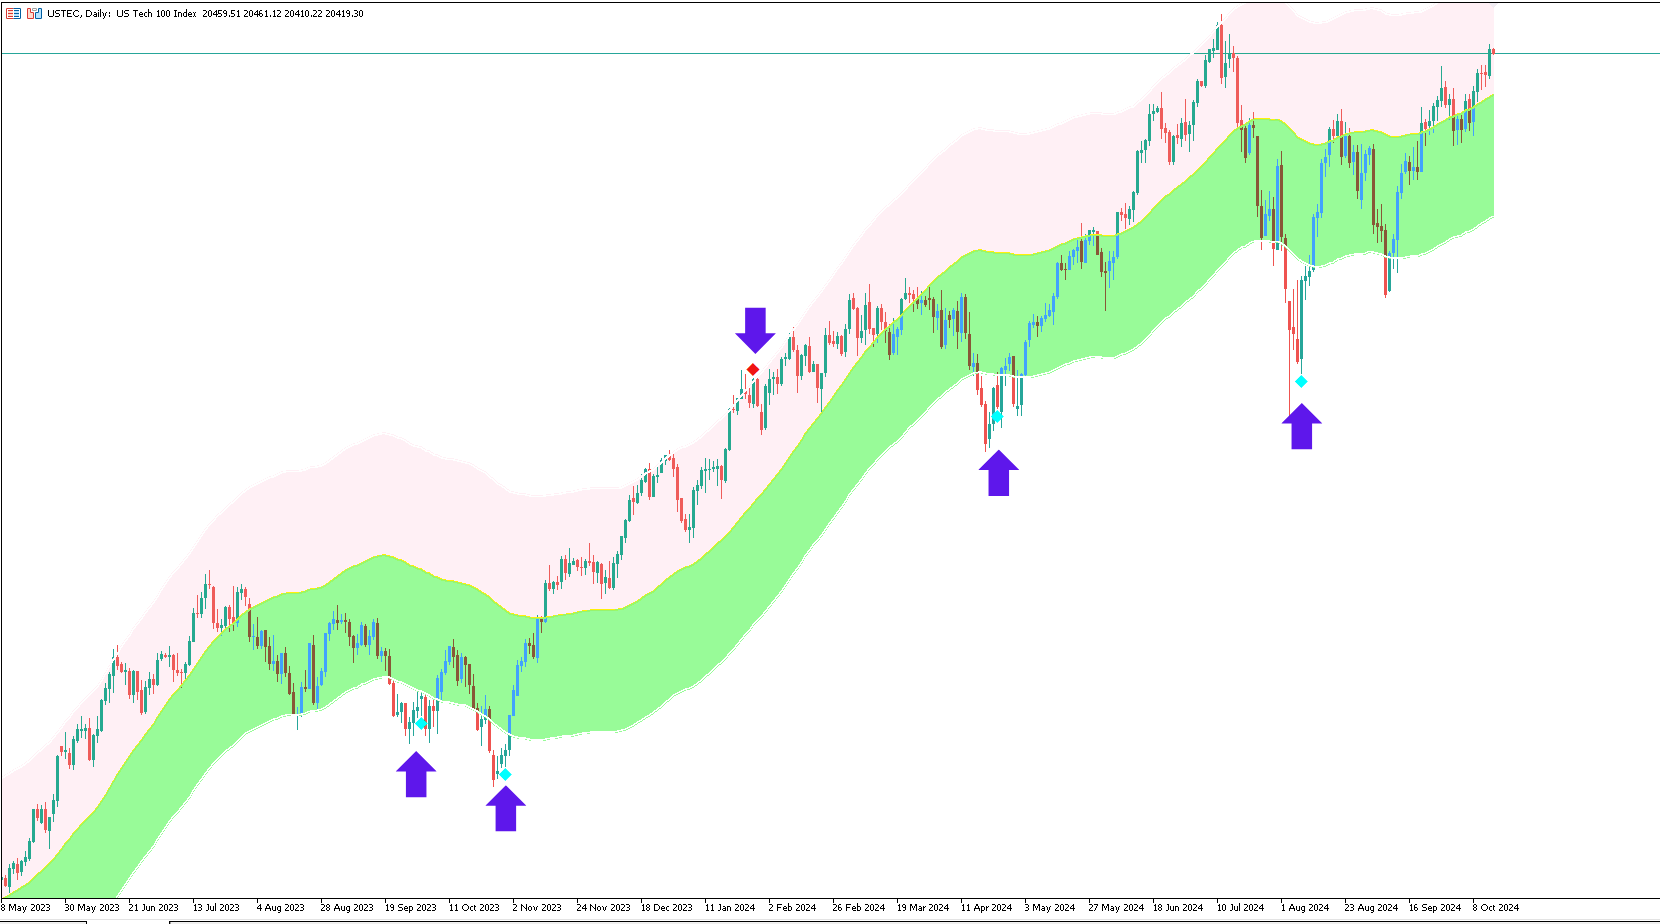
4. Arrow Direction Indicator
- Input: Plot Arrow Direction
- Description: Visual arrows indicate the likely direction of future price movement based on the projection, making it easy to spot potential trends.
5. Color-Coded Price Bars
- Description: The price bars are color-coded to reflect their position within the regression bands, offering a quick visual reference for bullish, bearish, or neutral conditions.
Dynamic Visualization and Usability:
- Colors: A gradient color scheme visually distinguishes between uptrends, downtrends, and mid-levels, making trend direction easy to interpret.
- Labels and Markers: Visual cues, such as markers for key levels and events, enhance clarity when viewing chart conditions.
Usage Tips:
- Adjusting the Length: Customize the "Length" setting to fit your preferred timeframe. Shorter lengths are more responsive, while longer lengths offer a broader trend view.
- Identifying Overbought/Oversold: Use the regression bands to identify when the price is in overbought or oversold zones—price above the upper band signals overbought, while below the lower band signals oversold.
- Future Projection for Targets: Utilize the future projection to help set price targets or stop-loss levels. This is especially useful in identifying future trends and potential reversal points.
- Arrow Indicator: Quickly assess trend direction with arrows—upward for an uptrend and downward for a downtrend.
- Heatmap Bars: Use the color-coded bars to see price relative to the regression channel, offering a heatmap-like visual for market conditions.
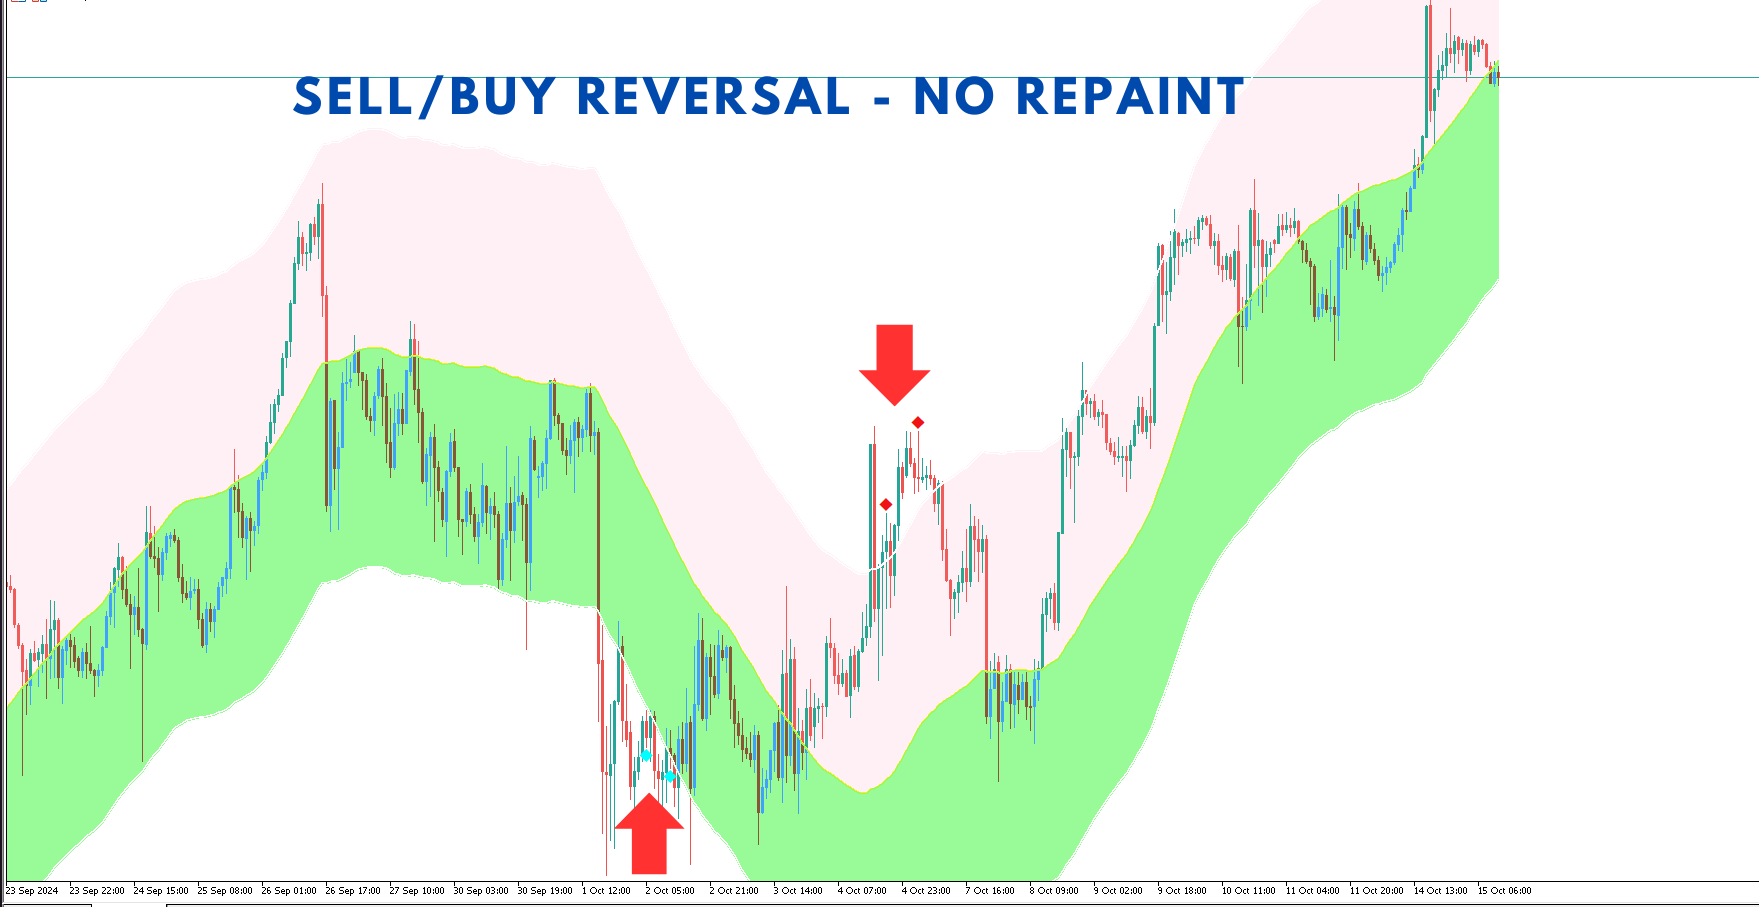
Visual Alerts:
Stay informed with real-time visual alerts and labels, such as significant price Reversal, ensuring that you don't miss crucial trade setups.
The Smart Linear Regression Indicator is a comprehensive tool, designed to help traders gain an edge with reliable, non-repainting regression channels. Whether you're day trading or investing long-term, this indicator simplifies complex data and allows for more informed trading decisions.


사용자가 평가에 대한 코멘트를 남기지 않았습니다