SuperTrend MTF MT5
- 지표
- 버전: 1.2
- 업데이트됨: 8 11월 2024
- 활성화: 10
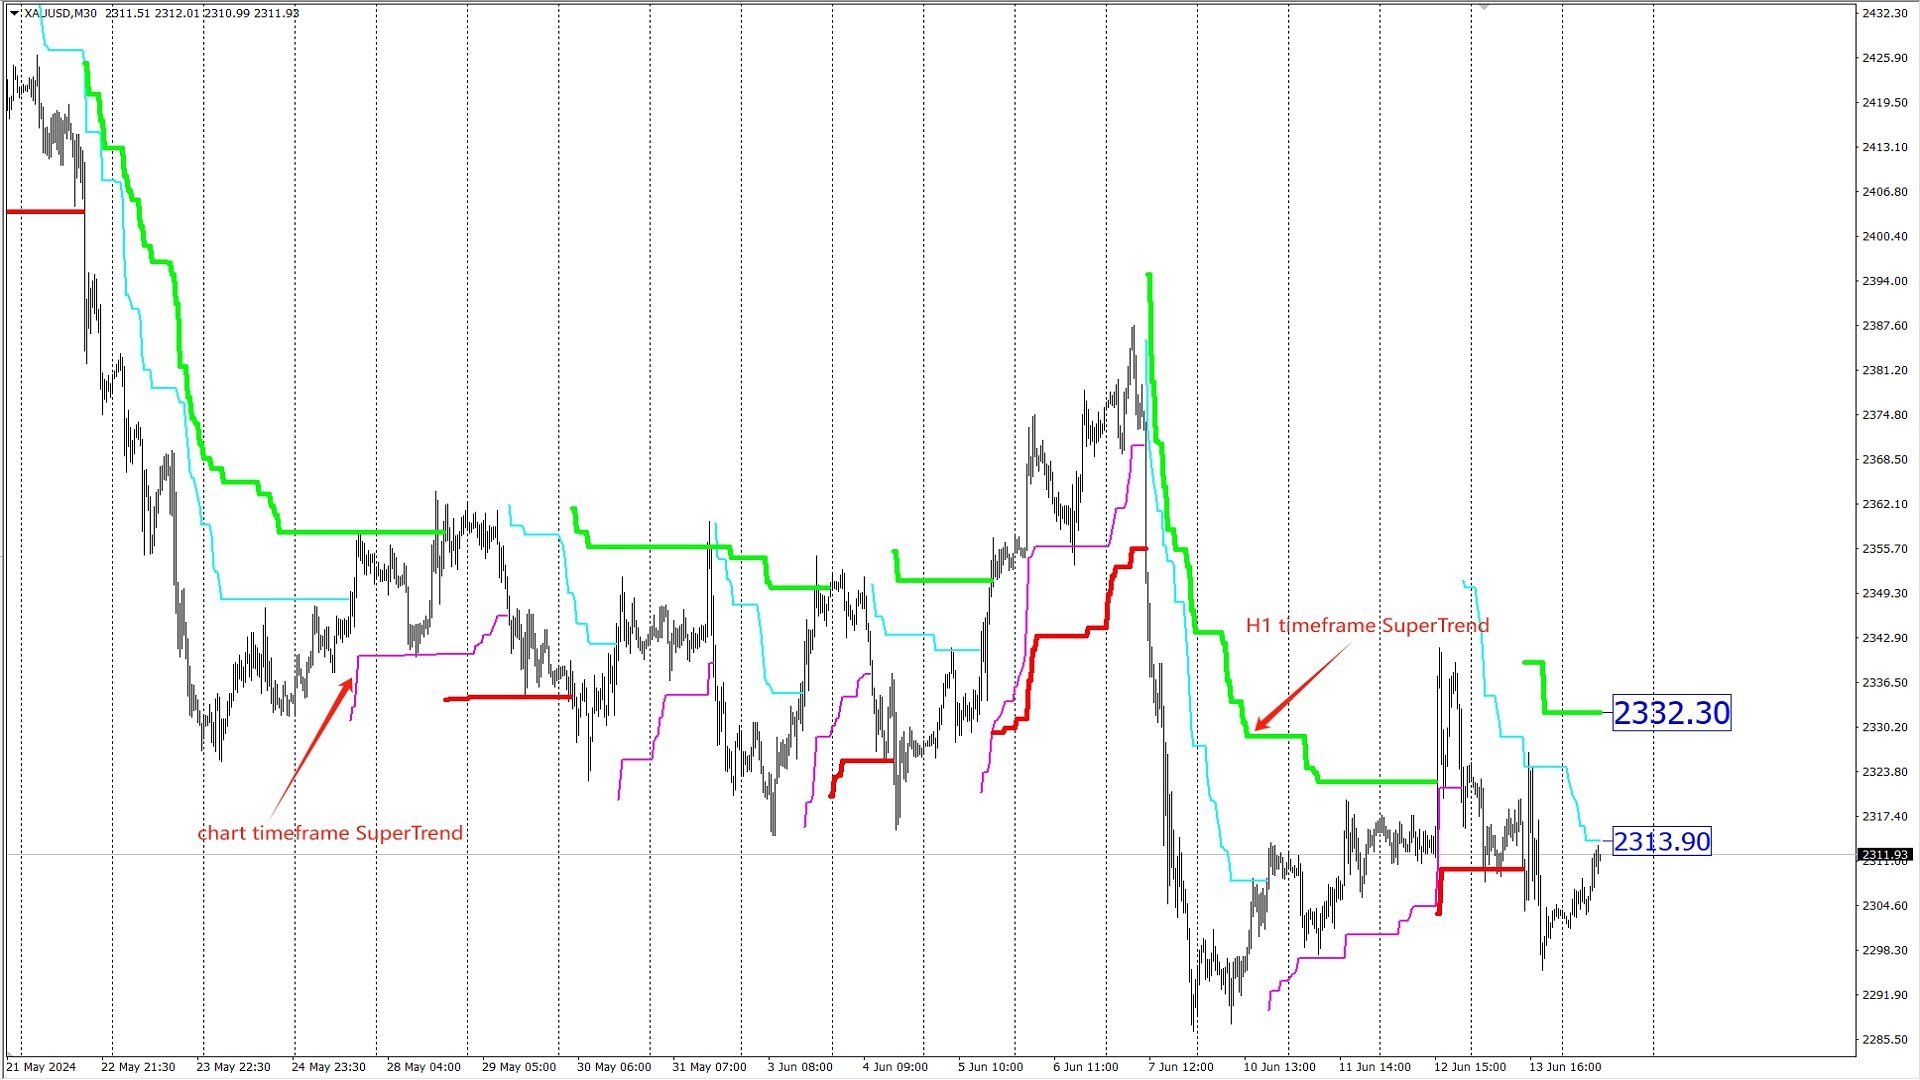
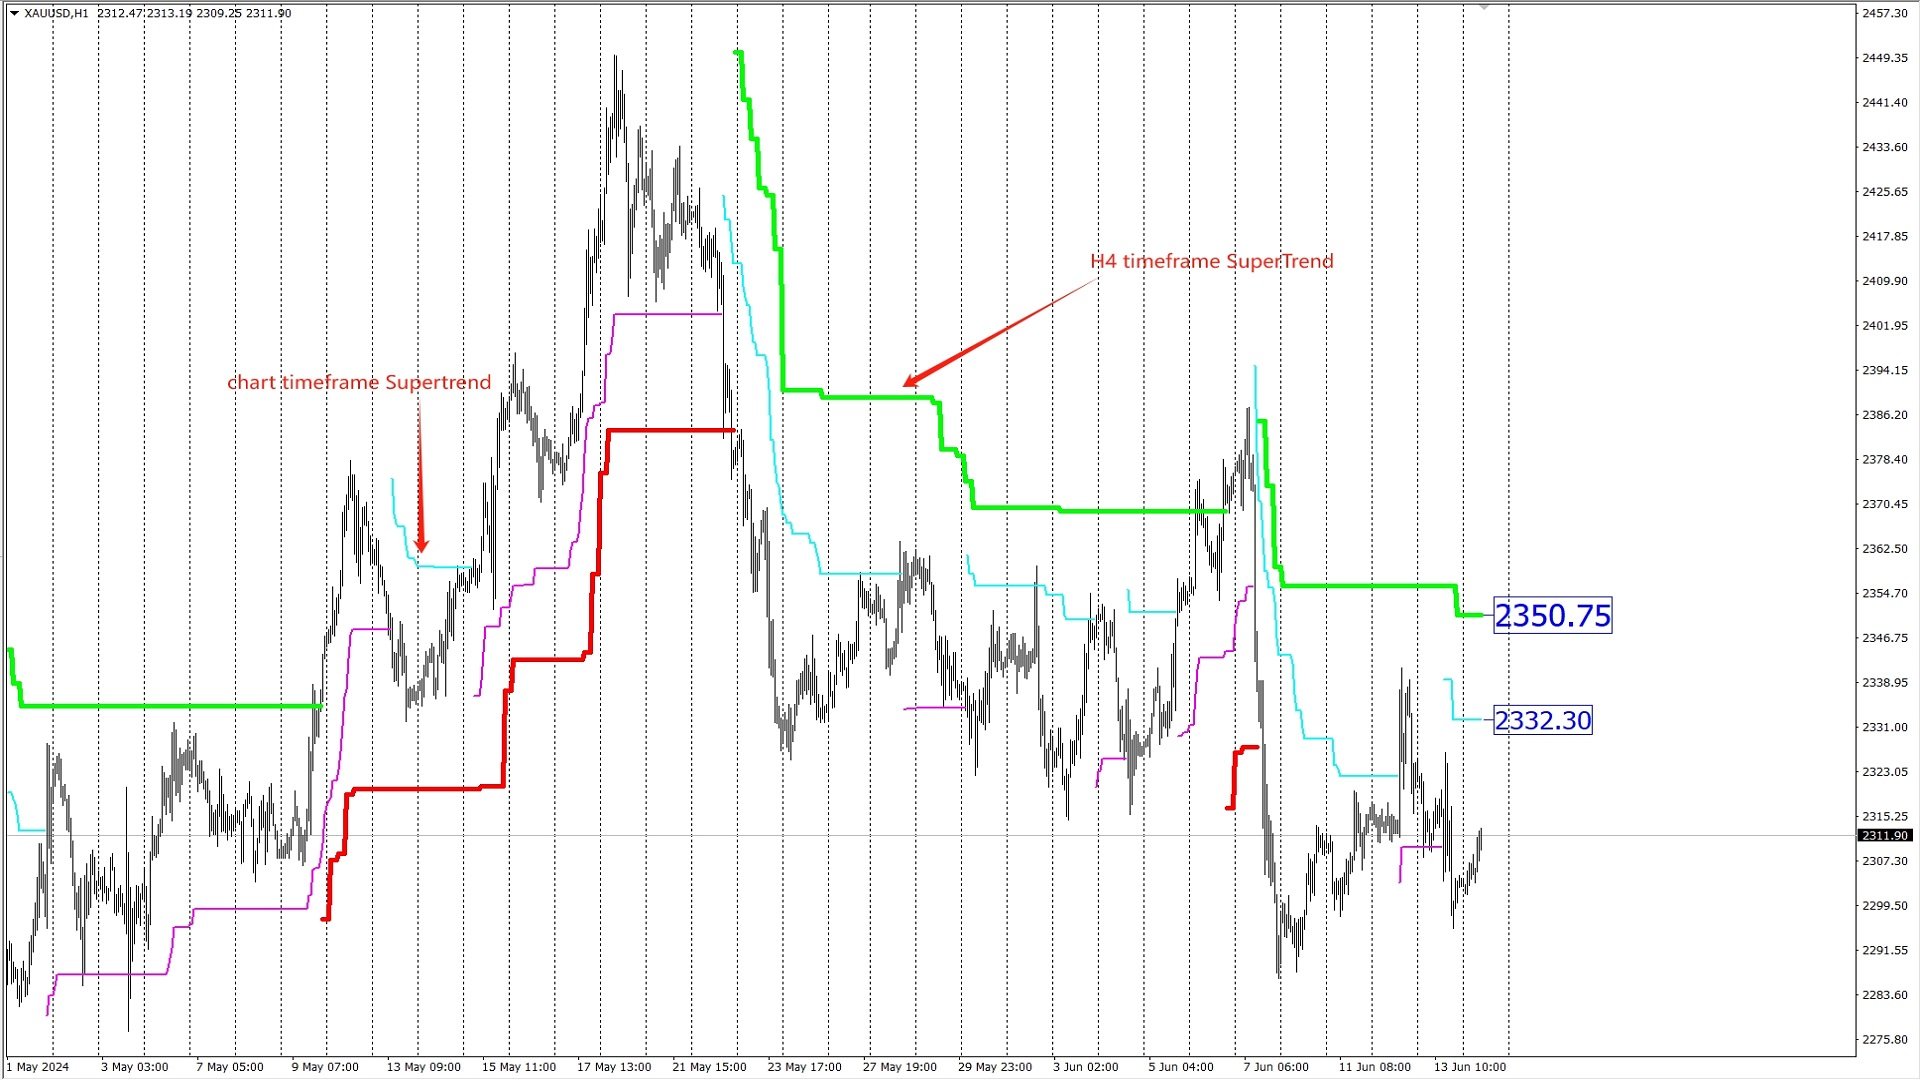
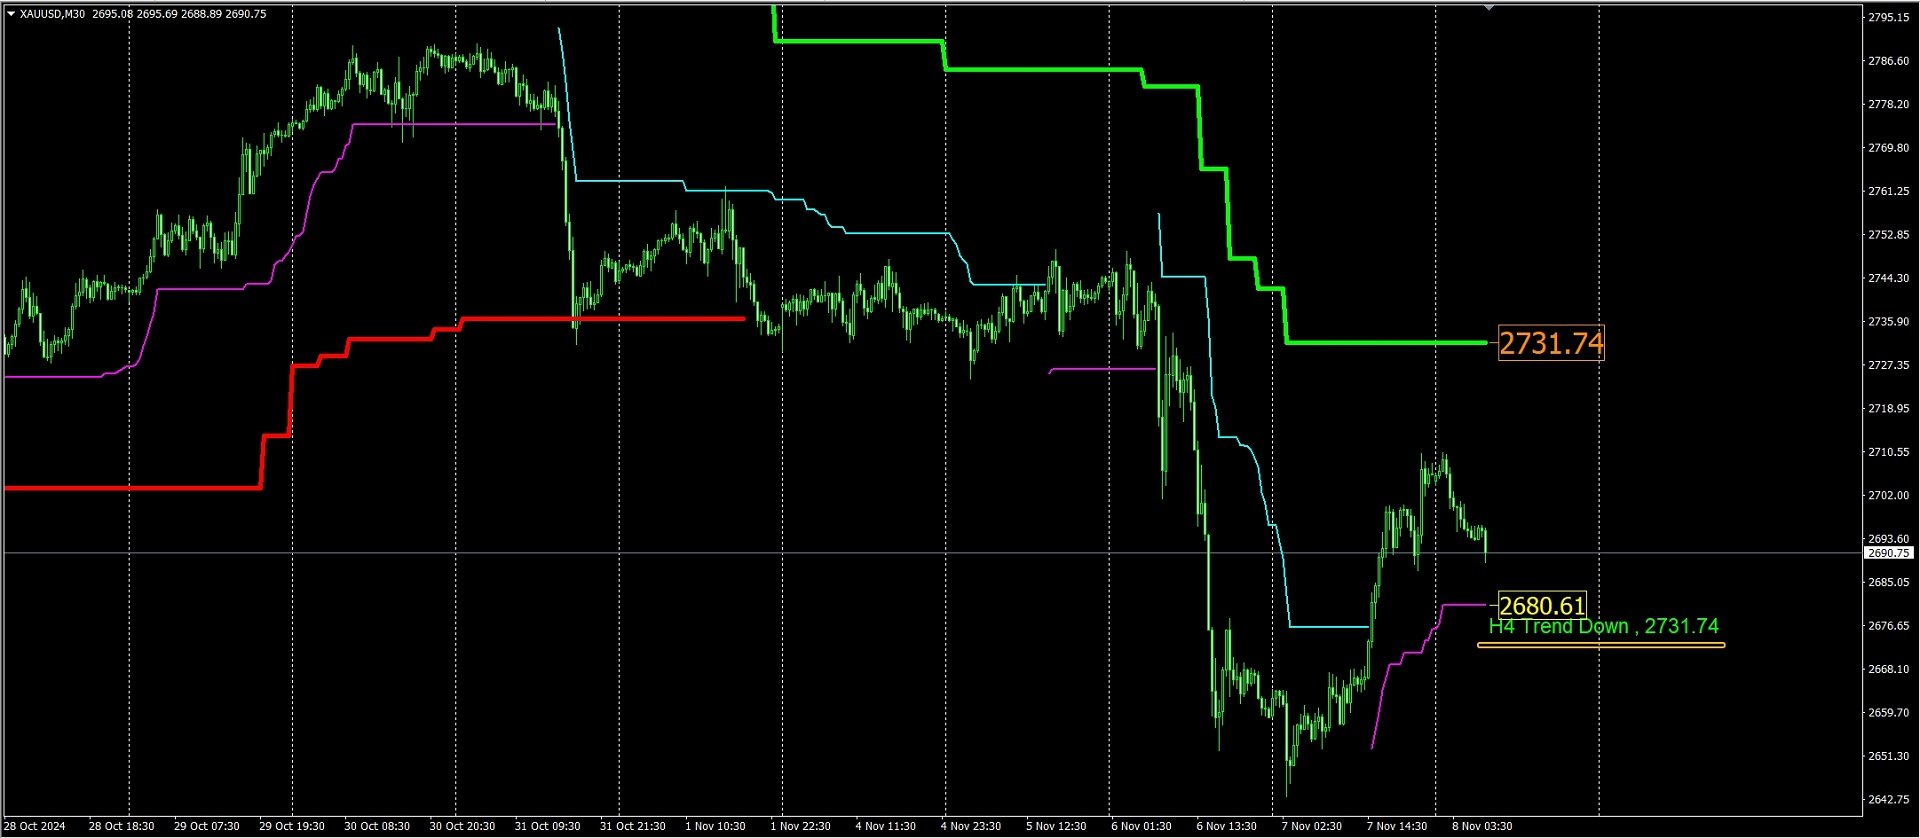
The SuperTrend MTF indicator is an excellent trend tracking indicator . It can not only display SuperTrend trends within the timeframe of the chart, but also set up to display SuperTrend trends for larger time frames simultaneously . This will be beneficial for grasping trends at a larger time scale and predicting future trends . At the same time, the price of the trend line can also be displayed at a glance, making it easy to observe.
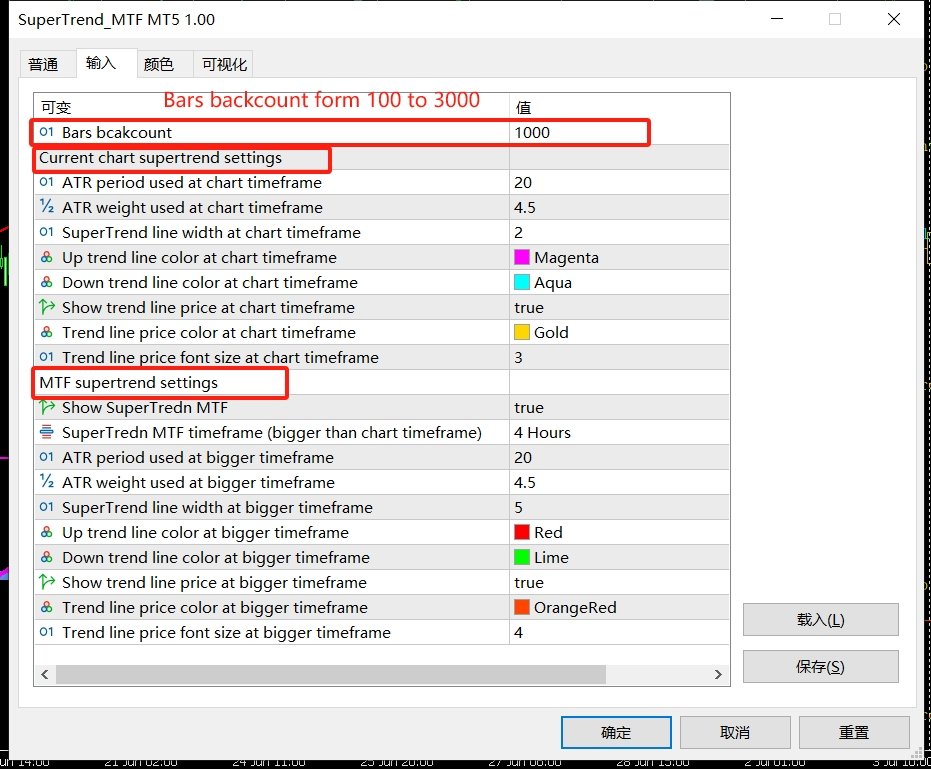
Input parameters :
ATR period used at chart timeframe
ATR weight used at chart timeframe
SuperTrend line width at chart timeframe
Up trend line color at chart timeframe
Down trend line color at chart timeframe
Show trend line price at chart timeframe
Trend line price color at chart timeframe
Trend line price font size at chart timeframe
Show SuperTredn MTF : true or false
SuperTredn MTF timeframe (bigger than chart timeframe) : The time frame of SuperTrend at a larger time level (if the set MTF timeframe is less than or equal to the timeframe of the chart, SuperTrend MTF greater than the timeframe of the chart will be automatically displayed)
ATR period used at bigger timeframe
ATR weight used at bigger timeframe
SuperTrend line width at bigger timeframe
Up trend line color at bigger timeframe
Down trend line color at bigger timeframe
Show trend line price at bigger timeframe
Trend line price color at bigger timeframe
Trend line price font size at bigger timeframe