Multiple Symbols Price Action Scanner Pro
- 지표
- Yu Fan Zhang
- 버전: 1.3
- 업데이트됨: 8 11월 2024
- 활성화: 8
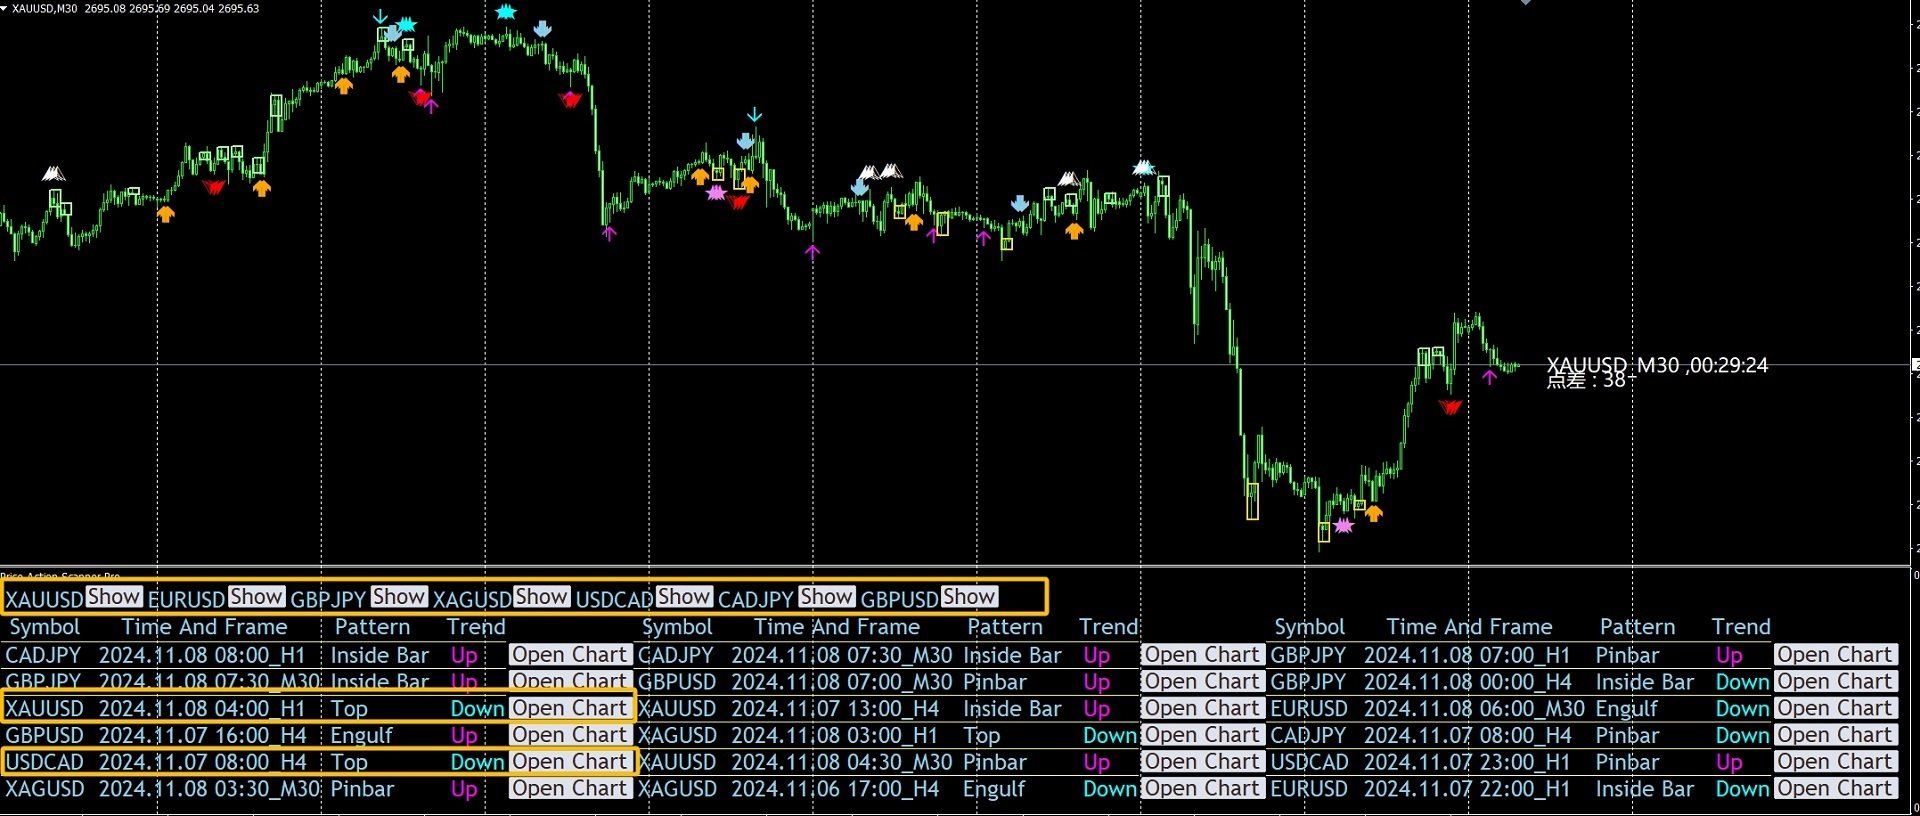
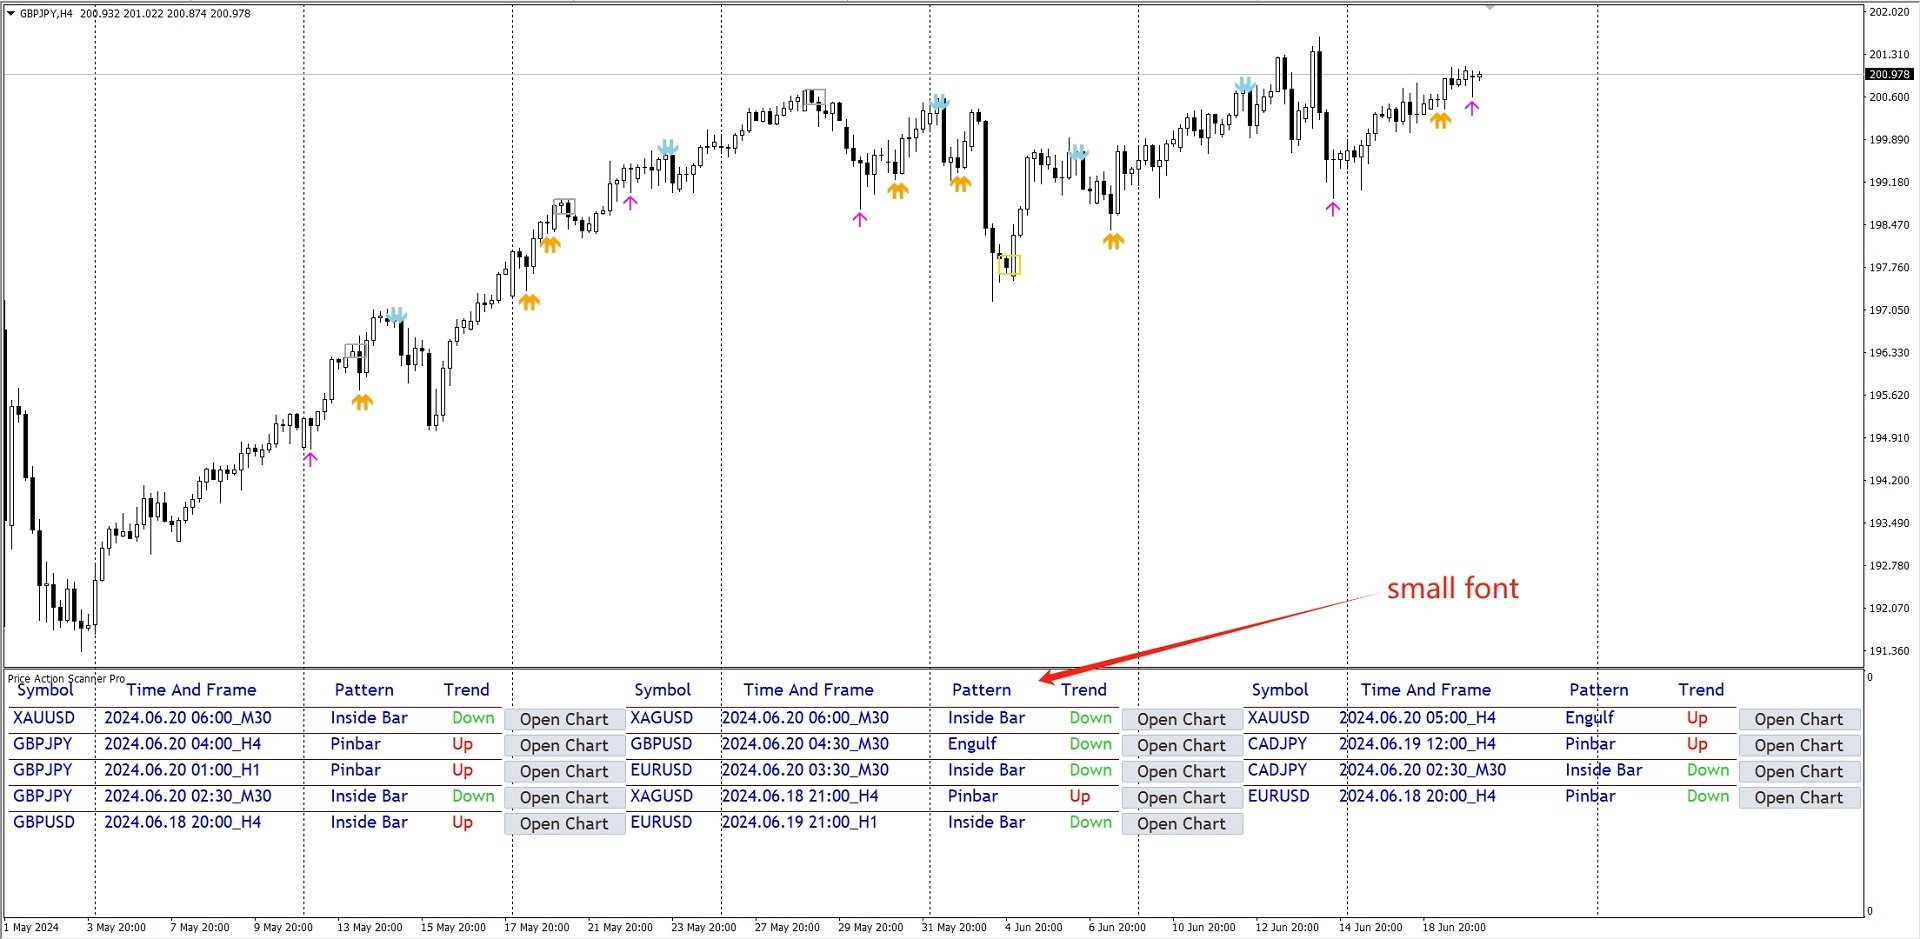
Price Action Scanner Pro is an indicator that identifies price behaviors and provides alerts, offering more features and customization compared to Price Action Scanner ( https://www.mql5.com/zh/market/product/118937?source=Site+Profile+Seller ) . This indicator can simultaneously detect signals for up to 15 symbols across different timeframes. You can configure it to detect signals during specific trading sessions such as Asian, European, and US sessions, using different timeframes. This allows you to use lower timeframes for active trading periods and higher timeframes for less active periods.
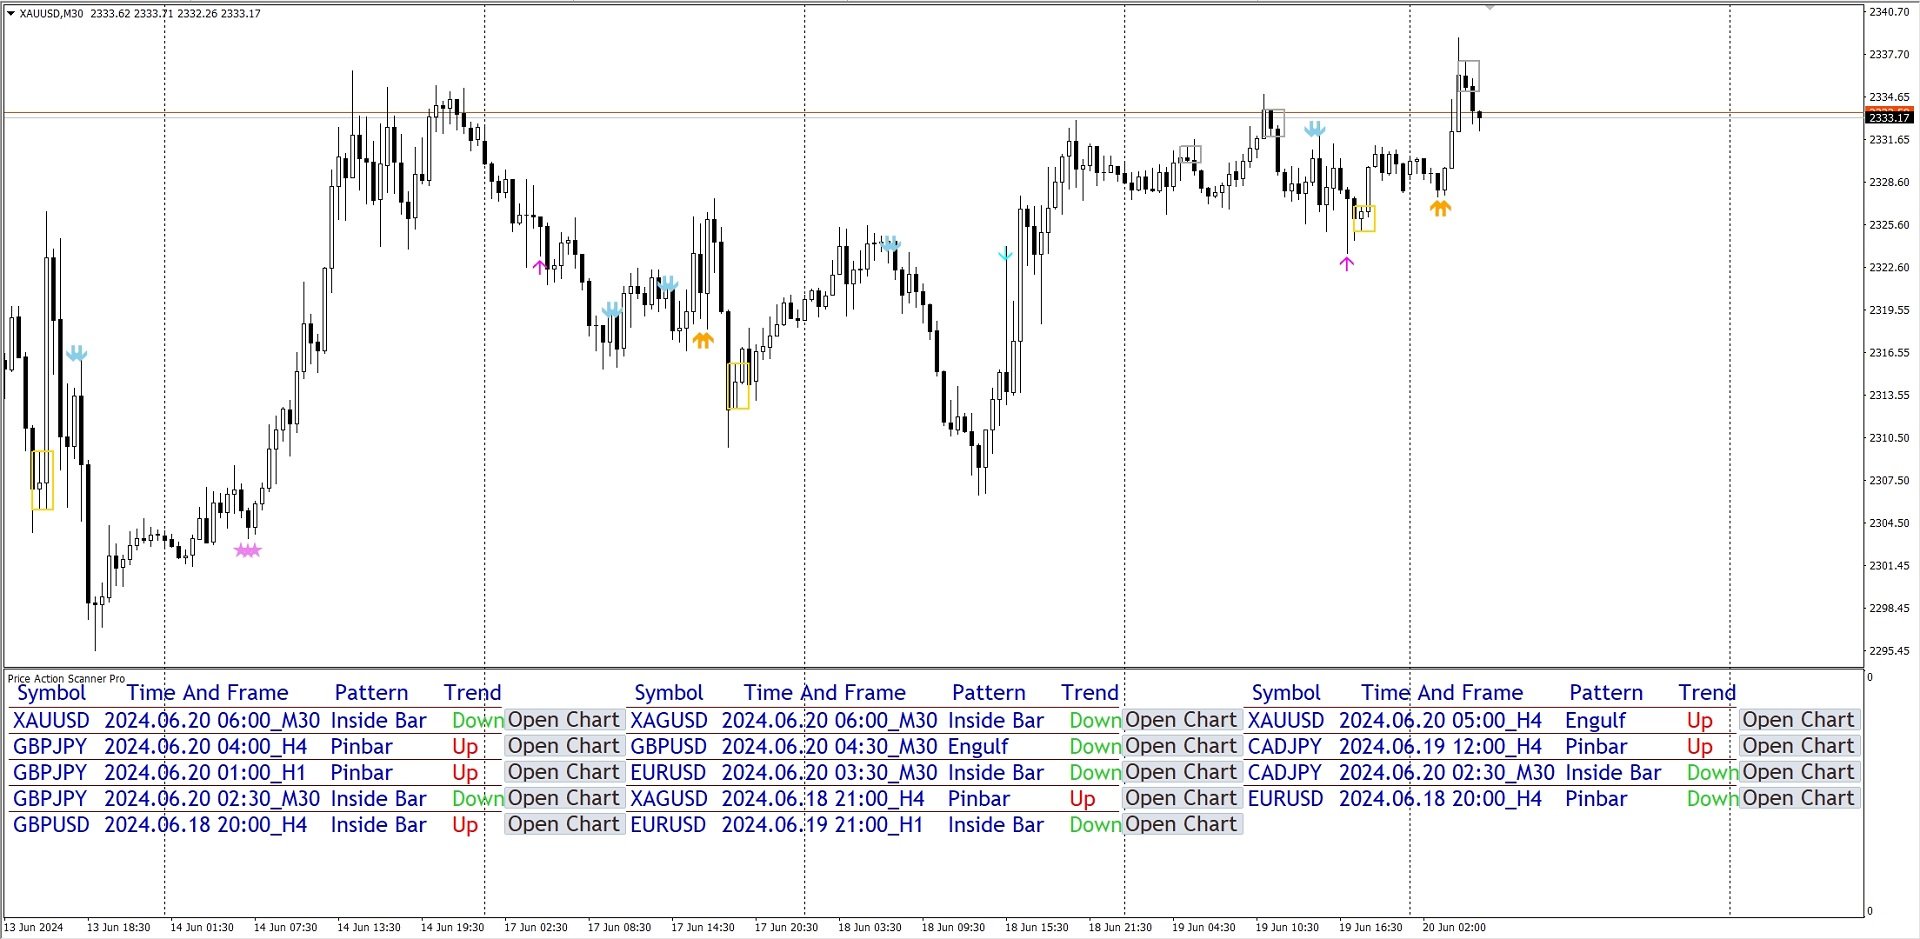
By setting a separator, you can add different symbol names and timeframes. The indicator can detect various common signal types including Pinbar, Engulfing Pattern, Inside Bar, Morning Star, Evening Star, Fakey, displaying corresponding information in separate subcharts and indicating signal directions. You can click the "Open Chart" button to view the respective symbol's chart for better observation. Customization options include setting colors and sizes for each signal.
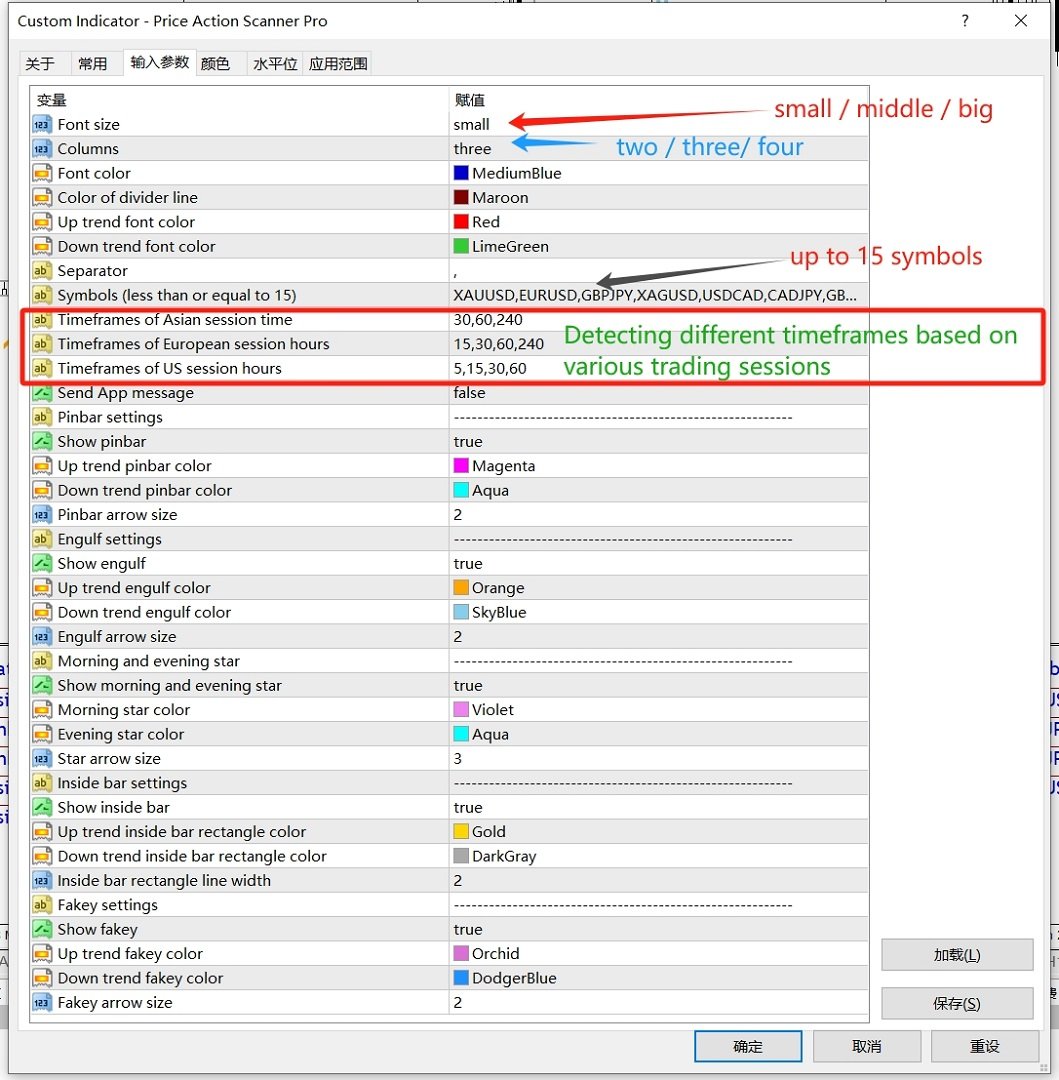
In terms of display, the indicator offers flexibility based on screen resolution, allowing you to choose between two, three, or four columns and adjust font sizes (small, middle, big) accordingly.
Signals are filtered based on trend conditions to improve accuracy: it avoids suggesting long signals at the end of an uptrend and short signals at the end of a downtrend. For enhanced trading precision, it is recommended to use key levels in conjunction with these signals.
Parameters:
- Font size: Choose between small, middle, or big for display font size.
- Columns: Select two, three, or four columns for display layout.
- Separator: Used to separate symbol names and timeframes, one character only (default is comma).
- Symbols (less than or equal to 6): Enter up to 6 symbol names separated by the separator.
- Timeframes: Specify the timeframes to monitor (1 for M1, 5 for M5, 15 for M15, 30 for M30, 60 for H1, 240 for H4, 1440 for D1).
- Send App message: Select 'true' to send signal information to your mobile MT4 app. Enable push notifications in MT4 on your PC ("Tools-Options-Notifications") and enter your MQID from the mobile app.
- Timeframes of Asian session time: Specify timeframes to monitor during the Asian session.
- Timeframes of European session time: Specify timeframes to monitor during the European session.
- Timeframes of US session time: Specify timeframes to monitor during the US session.
Furthermore, if you have any suggestions or encounter issues while using the indicator, feel free to discuss them with me.