RC ATR Based Trendlines MT5
- 지표
-
Francisco Rayol
 MQL5 | MQL4 | PINESCRIPT | NINJASCRIPT
RC ATR Volatility Hedge Zones: https://www.mql5.com/en/market/product/114742 - 버전: 2.0
- 업데이트됨: 18 10월 2024
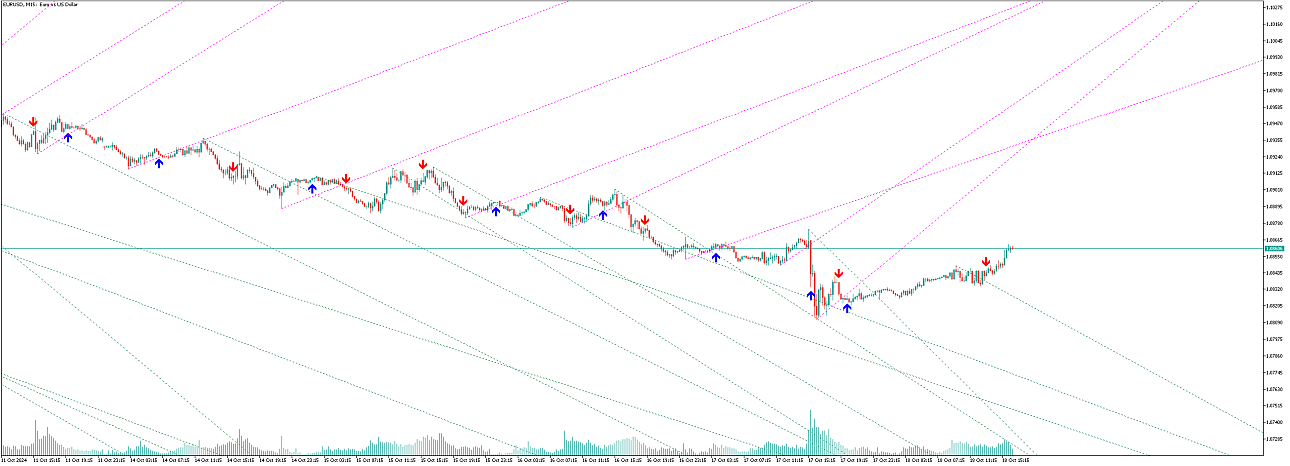
이 지표는 TradingView의 "ATR Based Trendlines - JD" by Duyck를 MetaTrader 5용으로 변환한 버전입니다.
작동 방식
이 지표는 가격뿐만 아니라 ATR이 감지한 변동성을 기반으로 자동적·지속적으로 추세선을 그립니다. 따라서 추세선의 각도는 ATR(의 일정 비율)에 의해 결정됩니다.
추세선의 각도는 피벗 포인트가 감지되는 순간의 ATR에 따라 가격 변화를 따라갑니다. ATR 백분율은 추세선이 ATR 변화율을 그대로 따를지(100%), 일부만 반영할지(<100%), 아니면 배수로 반영할지(>100%)를 결정합니다.
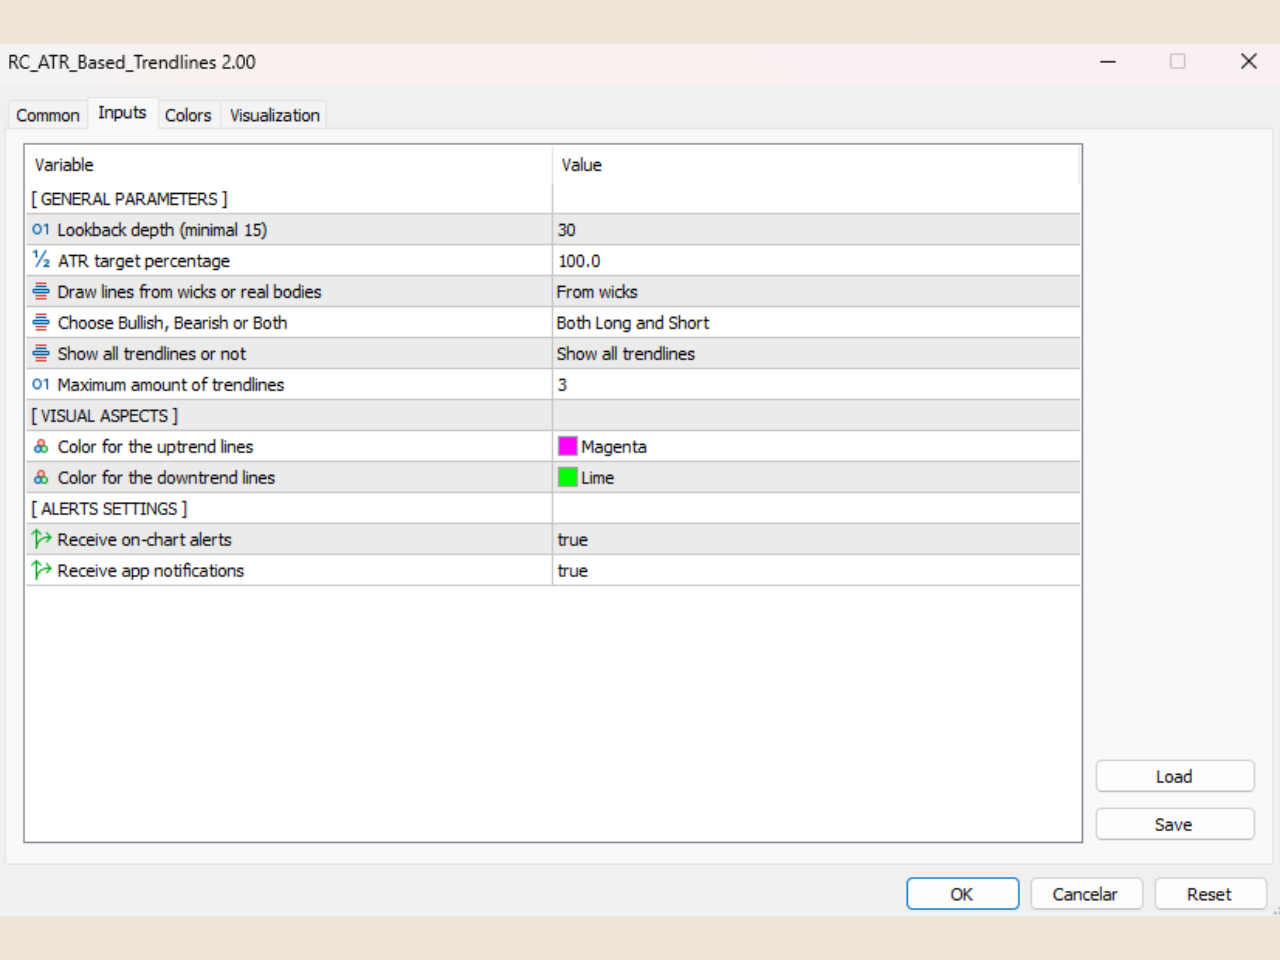
입력 매개변수
-
Lookback depth: 피벗 발생 여부를 확인할 캔들 수 설정
-
ATR target percentage: 추세선 방향에 대한 ATR 효과의 민감도 조정
-
Draw lines from wicks or real bodies: 피벗 및 ATR 계산 시 캔들 몸통 또는 심지 사용 여부 선택
-
추세선 방향 (상승, 하락, 또는 둘 다)
-
모든 추세선 표시 여부
-
최대 추세선 수 ('Show all trendlines' 비활성화 시 적용)
-
상승 추세선 색상 설정
-
하락 추세선 색상 설정
-
차트 알림 수신
-
앱 알림 수신
거래 전략
이 전략은 제가 개발한 두 지표—"RC ATR Based Trendlines"와 "RC ATR Volatility Hedge Zones"—를 결합해 진입 신호를 확인합니다. 핵심 원칙은 두 지표가 모두 동의할 때만 거래를 시작하는 것입니다.
-
추세선 감지:
-
"RC ATR Based Trendlines"는 ATR 계산을 기반으로 주요 상승·하락 추세선을 식별합니다.
-
이는 잠재적 가격 움직임과 시장 추세를 정확히 반영합니다.
-
-
변동성 헤지 존 확인:
-
상승 추세선의 경우, 추세선 위쪽에 강세 신호가 나타나야 합니다.
-
하락 추세선의 경우, 추세선 아래쪽에 약세 신호가 나타나야 합니다.
-
이를 통해 추세와 변동성이 일치하는지 확인합니다.
-
-
거래 실행:
-
추세선 신호와 변동성 존 확인이 모두 이루어진 후에만 진입합니다.
-
이는 거짓 신호를 걸러내고 승률을 높이는 데 도움이 됩니다.
-
자세한 전략은 "Strategies for RC ATR Based Trendlines Indicator" 글을 참조하세요.
면책 조항
본 지표를 구매 및 사용함으로써, 사용자는 이 지표 사용으로 발생할 수 있는 모든 클레임, 손해, 손실 또는 책임으로부터 개발자를 면책하는 데 동의합니다. 거래와 투자에는 내재적 위험이 따르므로, 지표 사용 전 재정 상황과 위험 감내 능력을 신중히 평가하시기 바랍니다.