MACD Classic Smoothed
- 지표
- 버전: 1.0
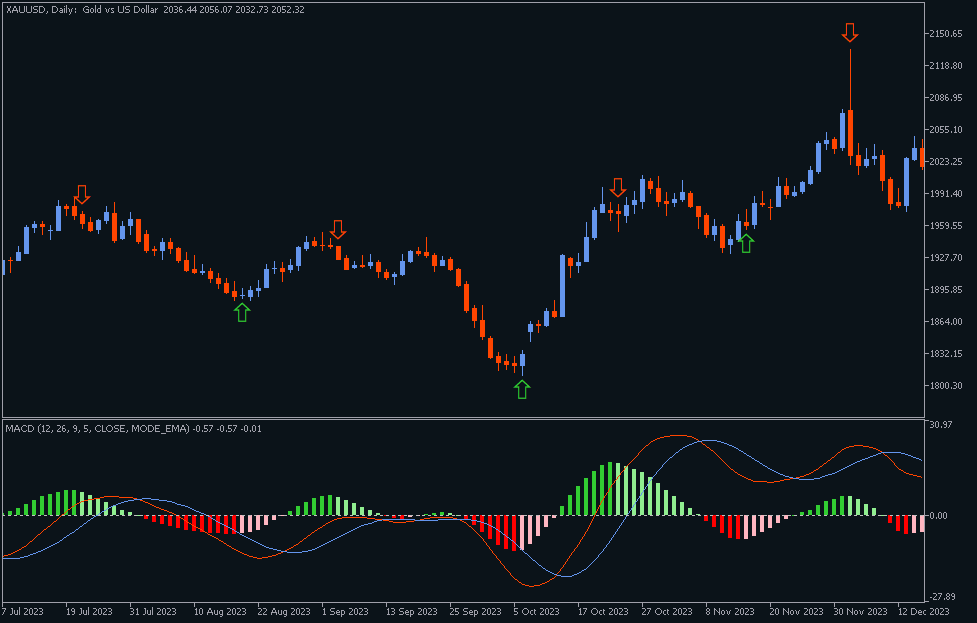
Classic MACD
- It has MACD line, Signal line, and Histogram.
- The Histogram has 4 colors, showing its movement direction as simple as possible.
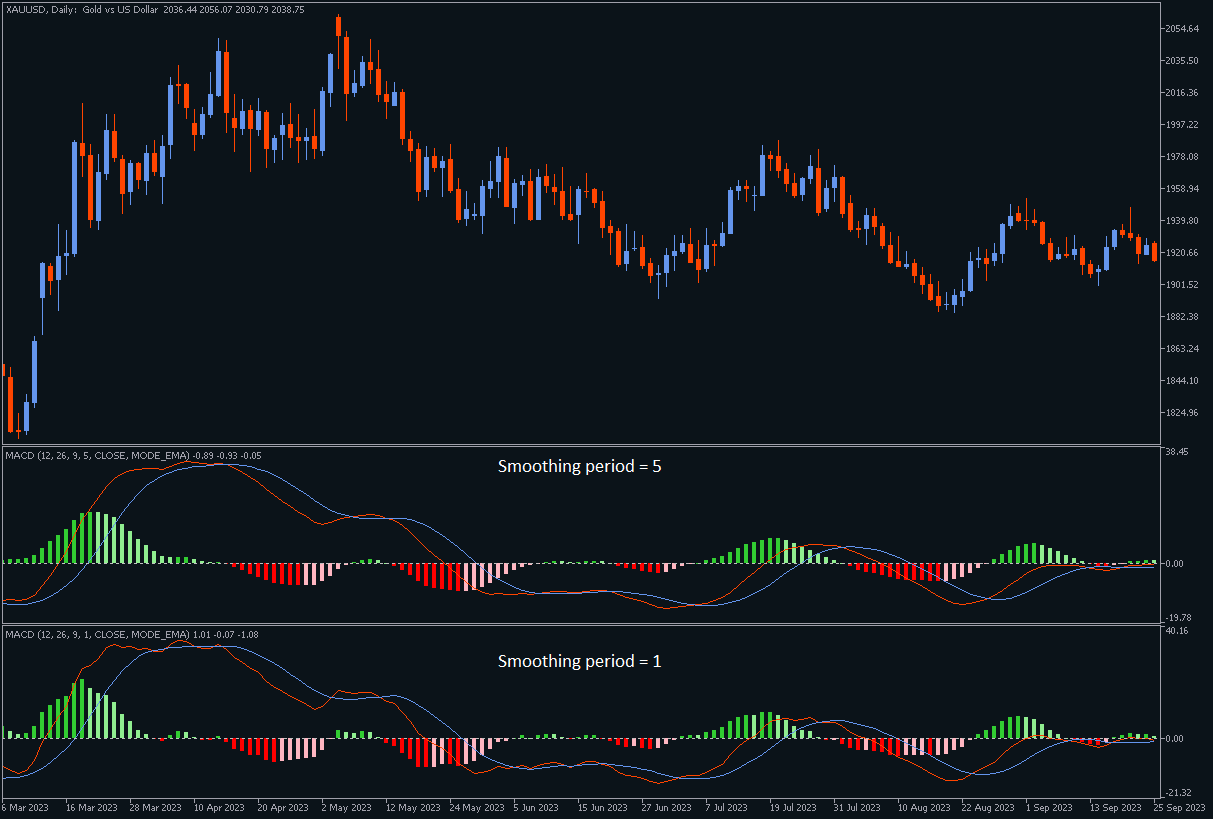
- The smoothing factor in the input helps to eliminate noisy signals.
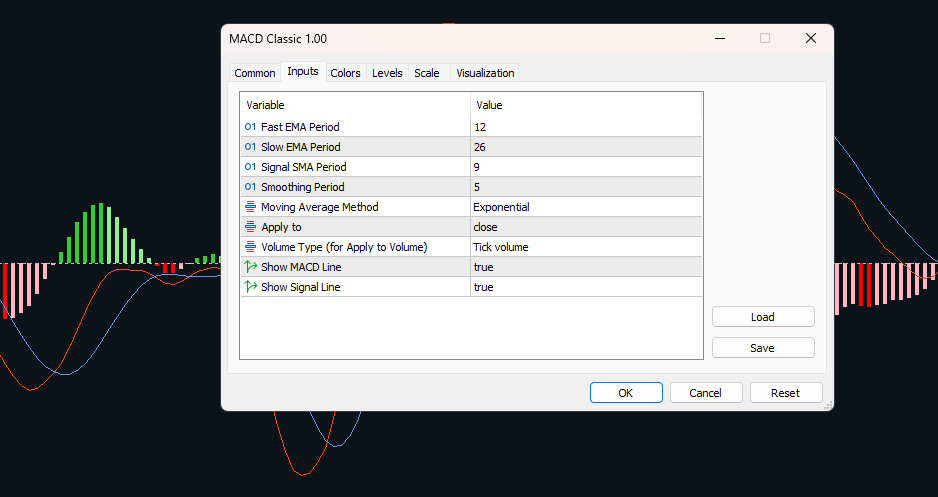
- Besides different price types (hlc, hlcc, ohlc, ...), there is an option to use volume data as the source for MACD calculations (which is better to be used by real volume not unreliable tick volume).
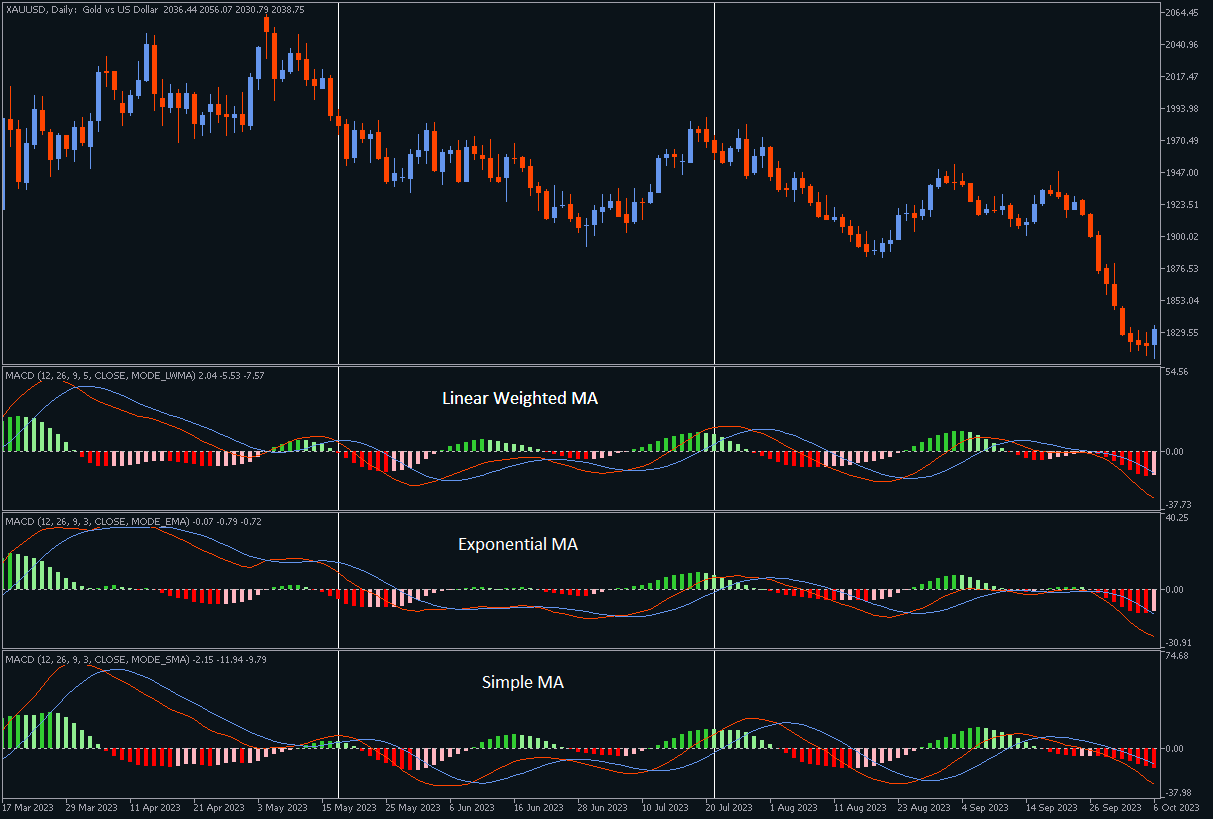
- While the original MACD indicator uses Exponential Moving Average, this indicator provides the flexibility to choose from various moving average methods, including SMA, SMMA, and LWMA.
-
There are two true/false options to show/hide MACD & Signal lines.
I believe this covers all functionalities available with the MACD indicator without additional customization. Enjoy your trading experience, and feel free to share your comments and reviews to make me happy.


a must have if you use the MACD and are used to it from other platforms.