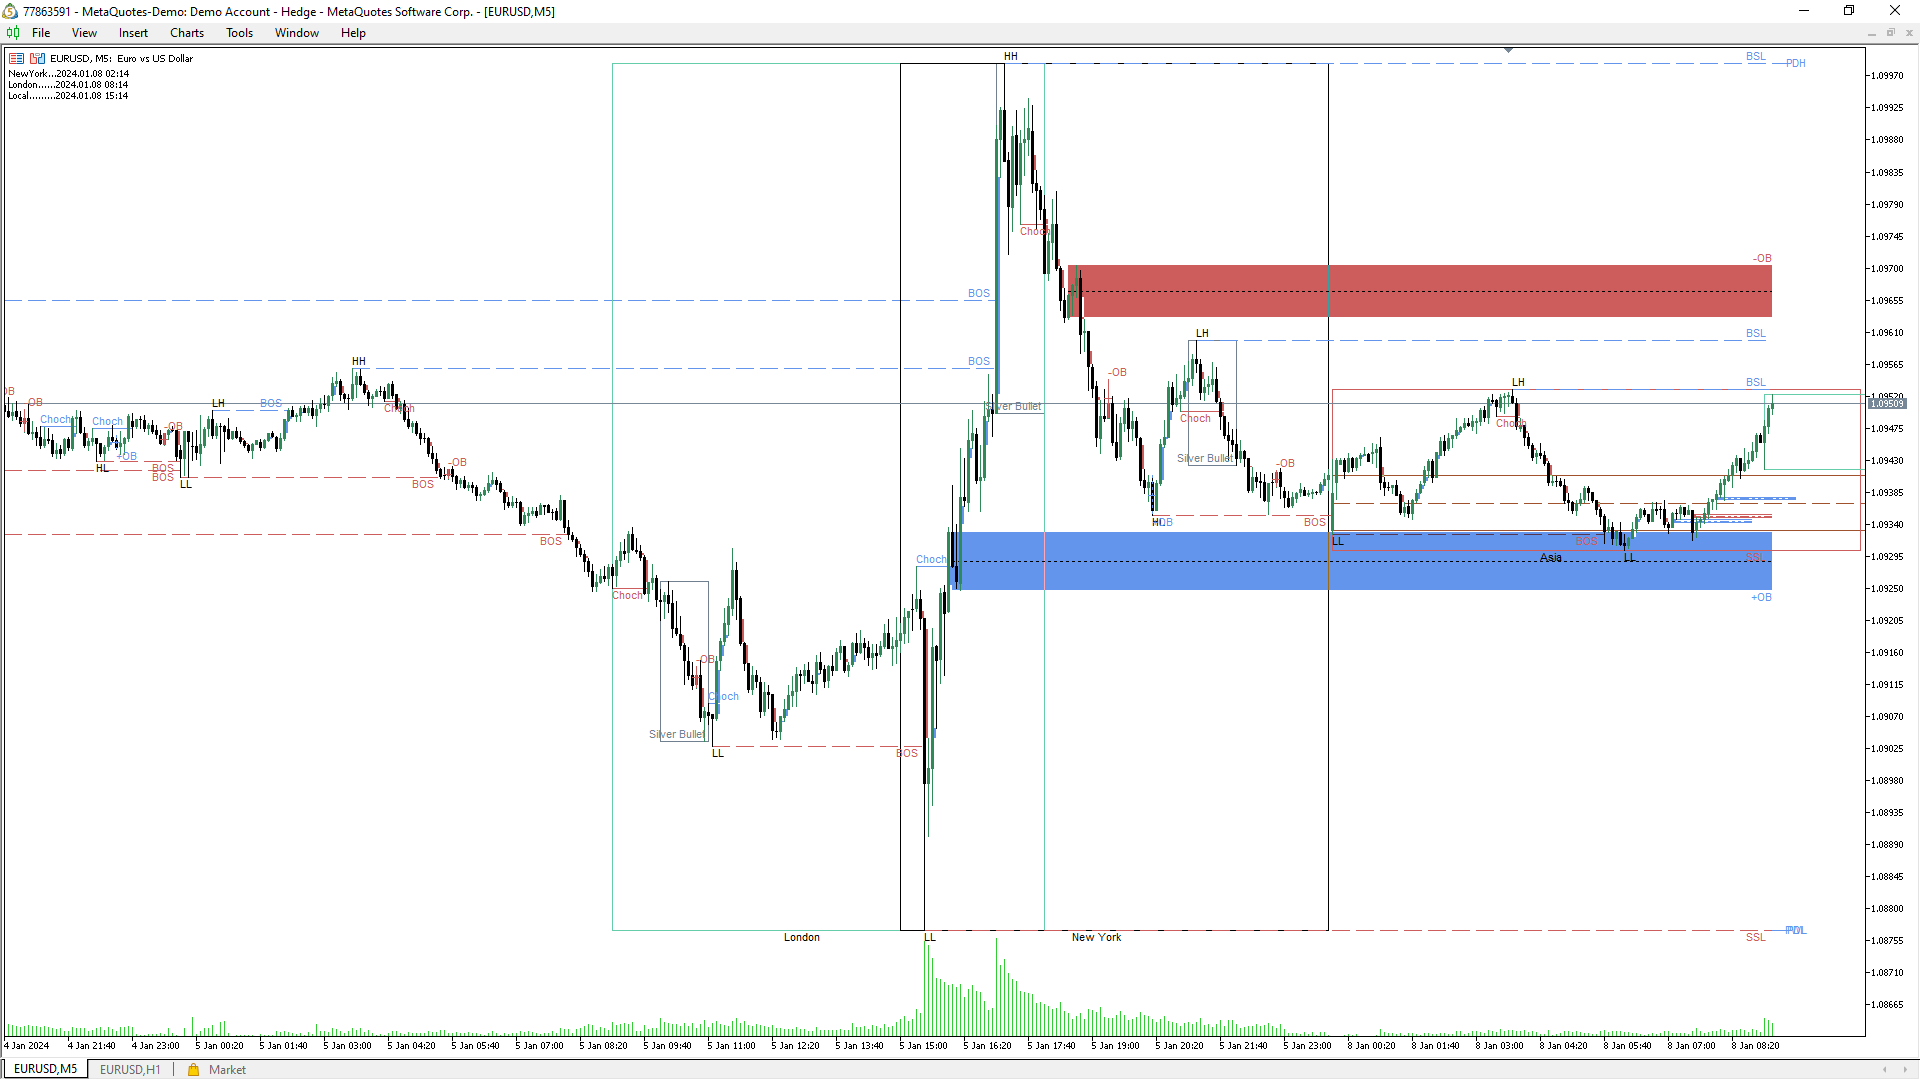
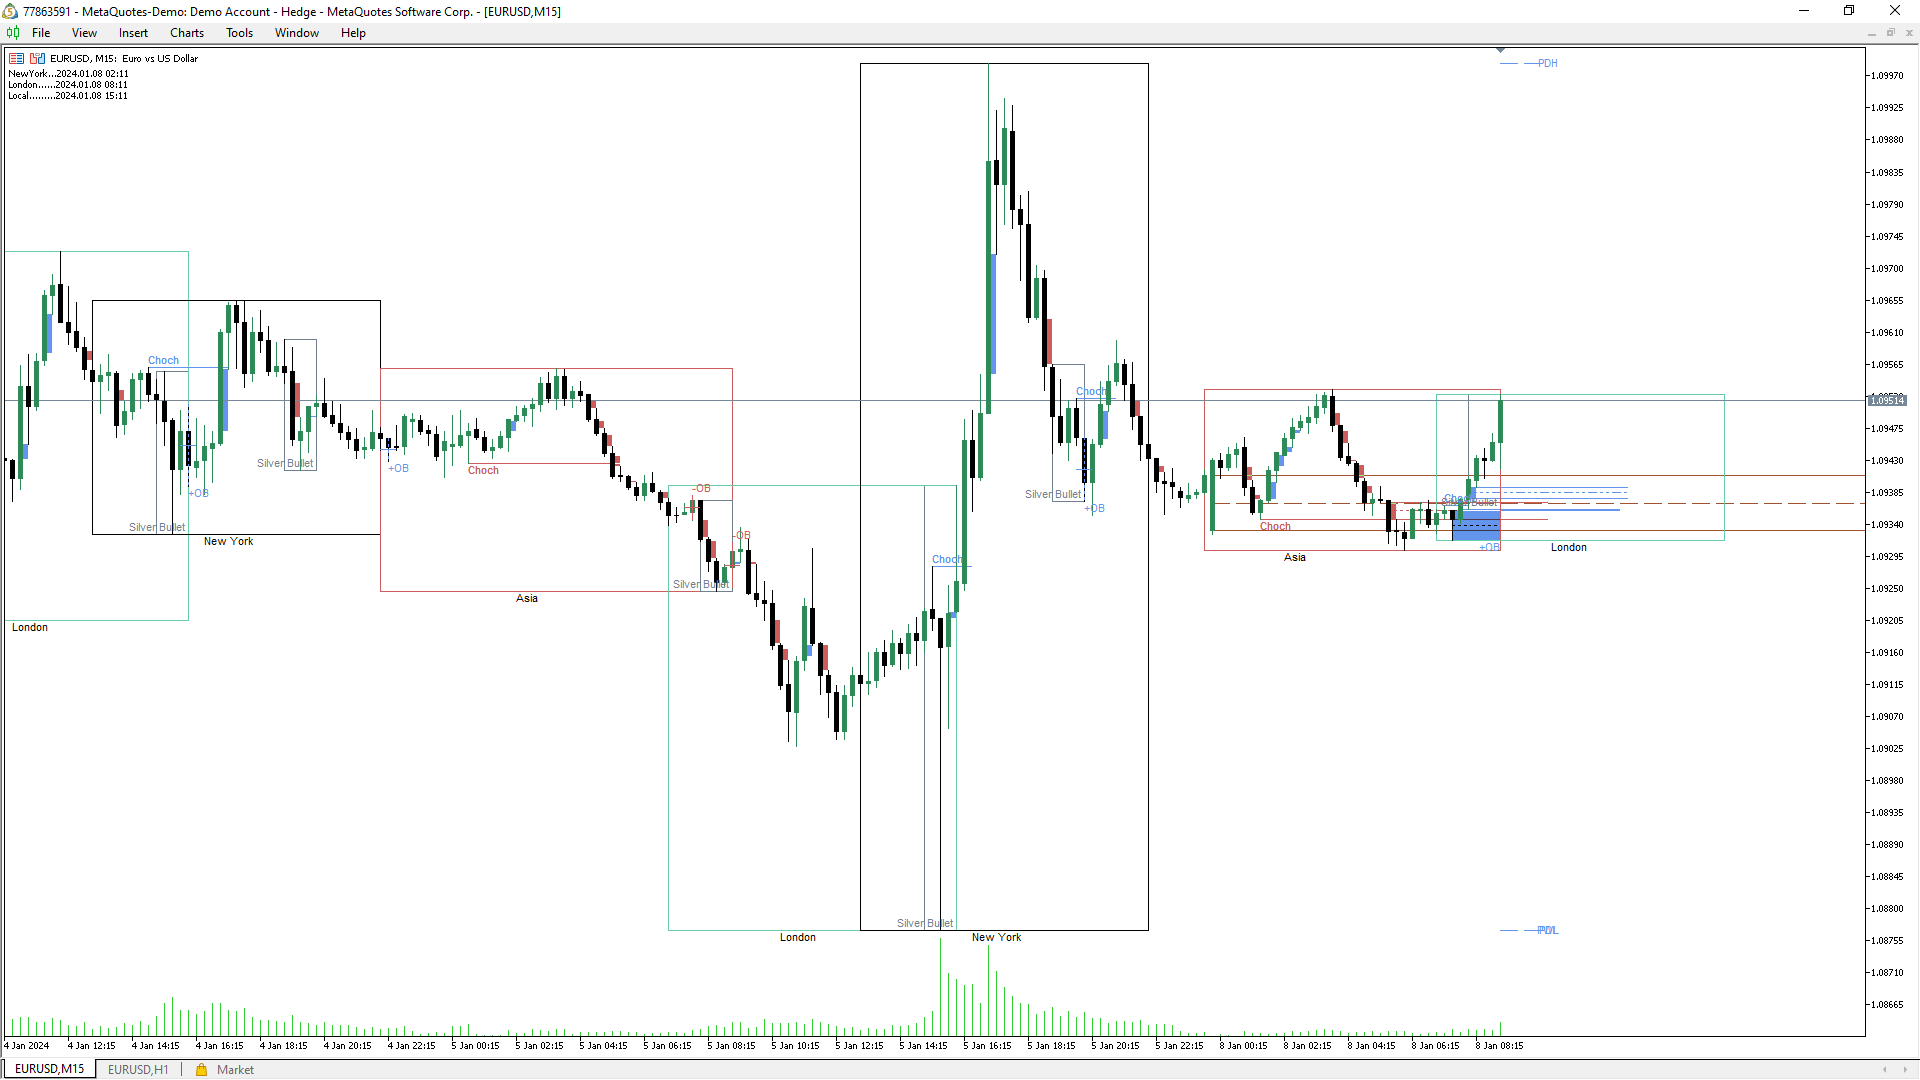
ICT Market Structure
- 지표
- 버전: 1.0
- 활성화: 10

안녕하세요, 이것은 빙입니다. ICT 개념을 거래하기 위한 신뢰할 수 있는 지표를 찾고 있다면, ICT Market Structure는 보다 고급 전략을 사용하는 트레이더들을 위한 사용자 매뉴얼을 제공합니다.
이 올인원 지표는 ICT 개념(스마트 머니 개념)에 초점을 맞추고 있습니다. ICT Market Structure는 기관들이 어떻게 거래하는지 이해하려고 하며, 그들의 움직임을 예측하는 데 도움이 됩니다. 이 전략을 이해하고 활용함으로써, 트레이더들은 시장 움직임에 대한 귀중한 통찰력을 얻고 가격 행동에 기반한 더 실용적인 진입 및 청산 포인트를 찾을 수 있습니다.
다음은 일부 기능에 대한 간단한 소개입니다:
- 비재페인팅, 비리드로잉, 비래깅 지표
- 오더 블록(상승 및 하락), 볼륨 메트릭스와 얼럿이 있는 오더 블록
- 실시간 시장 구조와 스윙 구조 고점과 저점(HH, HL, LL, LH)과 얼럿이 있는
- 구조 붕괴(BOS), 성격 변화(CHoCH)/ 모멘텀 변화(MS)
- 브레이커 블록 라벨링과 얼럿이 있는
- 공정 가치 갭(상승 및 하락 FVG) 검출과 얼럿이 있는
- 실버 불릿 타임 표시
- 거래 시간 세션 표시: 뉴욕, 런던, 아시아
- 모든 텍스트와 블록의 색상을 사용자 정의할 수 있습니다.
관련 주제:
ICT, SMC, Smart Money Concept, ICT Analysis, SMC Strategies, Smart Concepts,스마트 개념, 스마트 인사이트, 기관적 관점, 유동성 분석, 기관 거래, 시장 예측, 가격 움직임, 거래 기관, 추세 분석, 가격 행동, 시장 구조, 오더 블록, 지지 저항, BOS CHOCH, 모멘텀 변화, 수요 공급, 강한 불균형, 상승 고점, 하락 저점, 공정 가치, 피보나치 회귀, 동일 고점, 동일 저점, 다중 시간대, 다중 시간대 대시보드, 고시간대, 고시간대 구조, 유동성 공백, 시장 구조, 시간대, 시장 세션, 이전 고점 저점, 기술적 분석, 유동성 풀, 시장 조작, 시장 감성, 가격 분석, 시장 인사이트, 시장 참여자, 거래량 분석, 시장 심리, 오더 플로우, 시장 해석, 시장 예측, 거래 패턴, 거래 전략

Nice Job , great indicator ICT work perfectly !