ADX Color Indicator
- 지표
-
Adrian Hernandez Castellanos
 Ingeniero en computación con más de 25 años de experiencia en el sector de las tecnologías de la información con maestría en Gestión de Tecnologías de la información. He trabajado en una variedad de empresas, desde pequeñas startups hasta grandes corporaciones, en una variedad de roles, con un
 - 버전: 2.1
- 업데이트됨: 29 2월 2024
- 활성화: 20
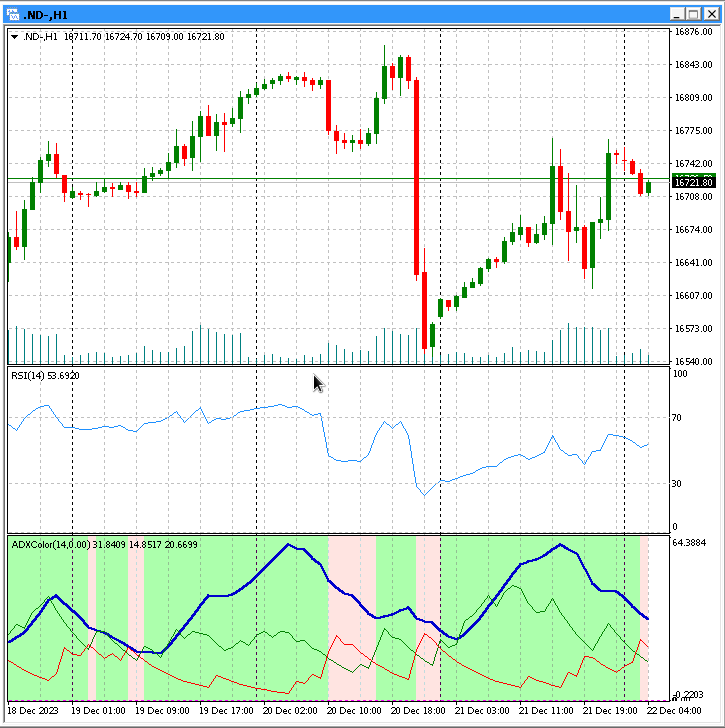
평균 방향성 지수 (Average Directional Movement Index - ADX) 지표는 매수 또는 매도 추세에 따라 배경을 색칠합니다.
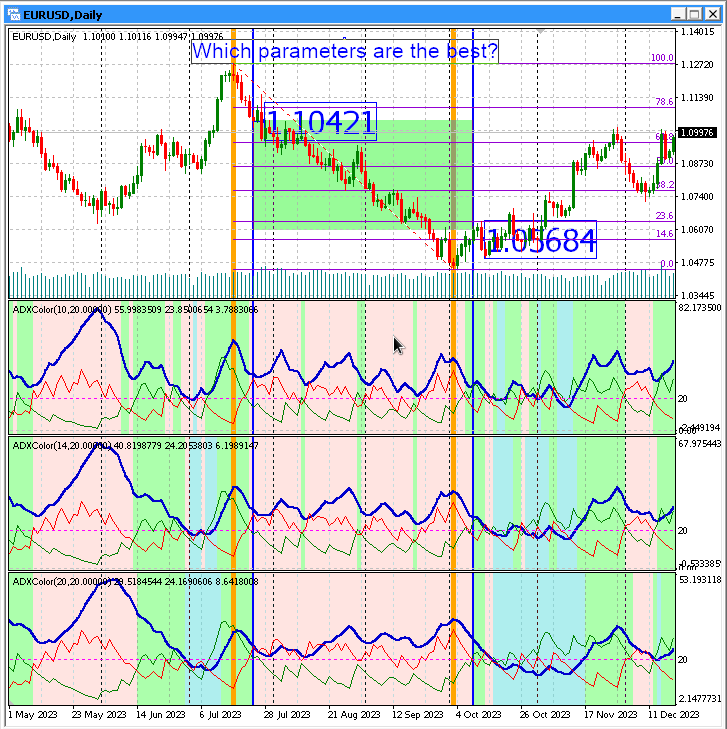
ADXColor 지표는 추세의 강도를 측정하는 데 사용되는 기술 지표입니다. 지표의 배경 색상은 해당 매개 변수에 의해 결정되며 마지막 400개의 막대만 표시합니다.
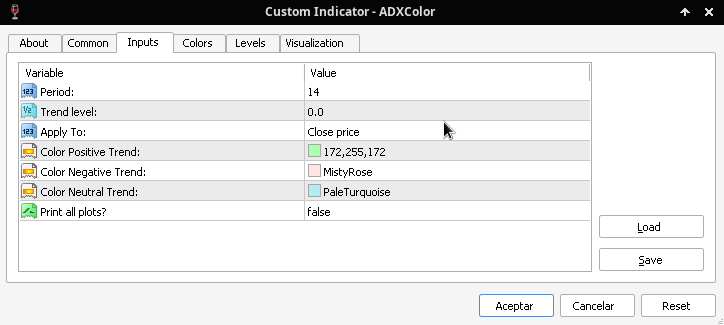
변경할 수 있는 매개변수는 다음과 같습니다.
- Period: ADX 지표의 기간입니다.
- Trend Level: ADX 지표가 상승 추세 또는 하락 추세로 간주되기 위해 도달해야 하는 최소 수준 (기본값은 0.0입니다.)
- Apply To: 지표가 적용될 가격 (Close price, Open price, High price, Low price, Median price, Typical price, Weighted price)
- Color Positive Trend: 상승 추세의 배경 색상
- Color Negative Trend: 하락 추세의 배경 색상
- Color Neutral Trend: 중립 추세의 배경 색상
- Print all plots?: 기본적으로 지표는 지난 2주간의 값만 표시합니다. 그래프의 처음부터 값을 표시하려면 이 매개변수를 "true"로 설정합니다.
사용 방법
지표를 사용하려면 간단히 차트에 드래그 앤 드롭합니다. MetaTrader에서 사용한 다른 지표와 동일하게 작동합니다.
결론
이 지표는 ADX 지표를 사용하는 시장 거래자들에게 유용한 도구입니다. 실시간으로 상승, 하락 및 중립 추세를 식별하는 데 도움이 됩니다.
참고 사항
- 리소스 사용량과 실행 속도가 높기 때문에 "Print all plots?" 매개변수를 "false"로 설정하는 것이 좋습니다. 이렇게 하면 지표가 얻은 값이 최대 2주로 제한됩니다.
- 400개의 막대만 사용하는 이유는 시장 거래자가 일반적으로 빠른 시각적 데이터를 필요로 하기 때문입니다. 이 문제에 대한 의견은 해당 부서에 문의하십시오. 단, 일시적으로 이 제한을 초과해야 하는 경우 첫 번째 참고 사항에 언급된 무료 도구를 사용할 수도 있습니다. 두 도구는 호환됩니다.