Galaxy Quest EA
- Experts
-
Michael Prescott Burney
 저는 MetaTrader 5를 위한 고성능 리스크 중심 트레이딩 시스템을 개발하는 전문 트레이더이자 Expert Advisor(자동매매 시스템) 개발자입니다. 저의 경쟁력은 실제 시장 경험에서 비롯되었으며, 드로우다운을 극복하고 전략을 지속적으로 개선하며, 실전 환경에서도 일관되게 작동하는 규율 있고 재현 가능한 트레이딩 프레임워크를 구축해 왔습니다.
 - 버전: 5.0
- 업데이트됨: 25 6월 2026
- 활성화: 20
Galaxy Quest Portfolio for EURJPY H1
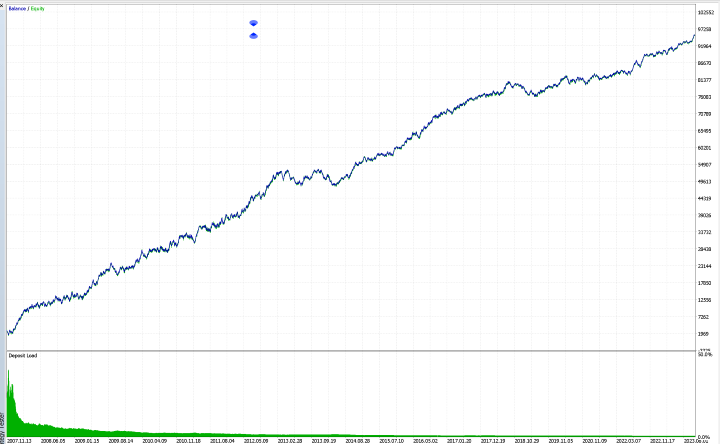
Galaxy Quest Portfolio is a professional MetaTrader 5 Expert Advisor for EURJPY on the H1 timeframe, running on the Expert Advisor HQ universal portfolio framework.
It is designed for structured automated trading on EURJPY H1, with clear on-chart feedback for entries, exits, protections, and live performance so you can see how the EA is operating in real time.
Overview
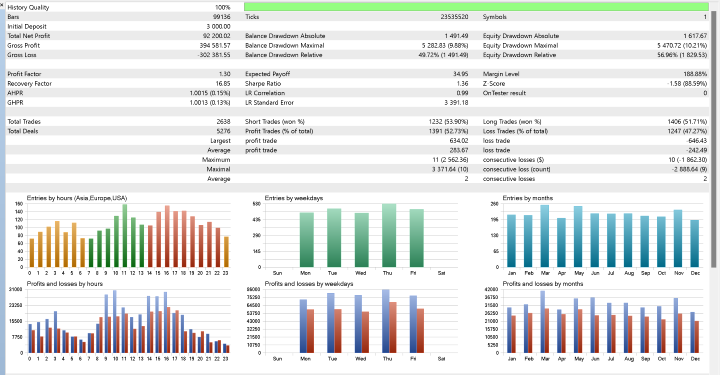
Galaxy Quest Portfolio combines its portfolio-style strategy logic for EURJPY with the Expert Advisor HQ execution and protection engine. The focus is not only on identifying trade setups, but on passing every trade through a disciplined pipeline for filtering, execution, risk control, and monitoring across the full position lifecycle.
The framework provides layered entry, daily, and account protections, automatic broker fill-type negotiation, a retry engine for transient execution issues, an integrated news filter aligned with the MetaTrader 5 economic calendar, and a TradingView-style analytics dashboard. Together, these components create a transparent and controlled operating environment for EURJPY trading.
Recommended Market
Symbol: EURJPY
Timeframe: H1
This product is intended for the EURJPY chart on the H1 timeframe. Running the EA on other symbols or timeframes is not recommended and may lead to behavior and results that differ from the validated deployment.
How the EA works
Galaxy Quest Portfolio operates through a structured pipeline. On every tick, the EA updates protection state, refreshes key dashboard metrics, and checks whether any critical limits have been reached. On each new bar, it performs a full analytics update, verifies that the chart is within the configured trading session, gathers strategy signals, applies all protection gates, and routes valid orders to the execution engine.
Before an order is sent, the EA can evaluate spread conditions, maximum allowed open positions, total open lots, daily protection status, account protection status, and the state of the news filter. If any condition blocks the entry, the trade is cancelled and the reason can be reviewed in the terminal journal, so “no trade” situations are explainable rather than opaque.
Main framework features
Galaxy Quest Portfolio uses a three-layer protection architecture. Entry protections can prevent new positions when spread is higher than the configured limit, when the maximum number of positions has already been reached, or when the lot exposure ceiling has been hit. Daily protections can close positions and suspend new entries after a specified daily loss or daily drawdown threshold is reached, and account protections can close positions and remove the EA from the chart after a critical equity event so you can review conditions before restarting.
The execution engine is designed to adapt to different broker environments. Orders are pre-checked, and the EA can automatically negotiate the appropriate fill mode across IOC, FOK, RETURN, and BOC. A bounded retry loop handles transient issues such as requotes, price changes, timeouts, and connectivity interruptions, helping to stabilize order placement without constant manual intervention.
The integrated news filter uses the MetaTrader 5 economic calendar to pause new entries around selected medium- and high-impact events. When enabled on a live or demo account, this can help keep the strategy out of scheduled macro releases that may affect EUR and JPY volatility.
Trade management
The EA manages positions through a structured signal model. Each signal defines direction, whether it is an entry or exit, stop loss distance, take profit distance, trailing behavior, and whether an opposite signal should close and reverse an existing position. Stop loss and take profit levels are calculated from current market prices and are automatically widened when broker stop-level rules require more distance.
When trailing features are active in the strategy, the EA can trail positions using a bar-based method that tracks the previous bar high or low. The trailing stop only moves to lock in profit and never moves backward, helping to protect gains while still allowing price to evolve naturally on EURJPY H1.
Dashboard and chart tools
Galaxy Quest Portfolio includes the full EAHQ real-time analytics dashboard. The panel can show equity, balance, floating profit and loss, number and volume of open positions, a rolling equity curve with current drawdown from peak, and recent performance windows, along with a per-position strategy breakdown. Lightweight updates run during tick flow, and full recomputations occur on new bars.
On the chart, the EA can draw signal arrows at each entry and display live trade projection overlays that show entry price, stop loss zone, and take profit zone. These visuals are intended to make the EA’s decisions transparent and easy to supervise during live trading.
Input structure
The EA uses the standard Expert Advisor HQ portfolio input layout. Core parameters include fixed lot size and a base magic number, followed by grouped settings for entry protections, daily protections, account protections, news filter configuration, statistics, and visual preferences.
This consistent structure makes configuration straightforward. Traders who already use other Expert Advisor HQ portfolio products can apply the same operating workflow to Galaxy Quest Portfolio with minimal adjustment.
Important usage notes
For correct operation, attach the EA to the EURJPY H1 chart, ensure Algo Trading is enabled in platform options and on the toolbar, and assign a unique magic number if you are running multiple EAs on the same account. It is also recommended to configure protection parameters intentionally, avoid changing the magic number while positions are open, and run the terminal on a VPS for stable 24/5 execution.
As with any automated system, testing Galaxy Quest Portfolio on a demo account before going live is advisable. Observing how it behaves across different sessions, spread conditions, and news events on EURJPY will help you fine-tune your configuration and risk settings to match your broker and trading objectives.
Best for
This EA is suitable for traders who want an automated EURJPY H1 portfolio system that combines structured strategy logic with a professional execution and protection framework. It is particularly suited for traders who value clear chart feedback, robust risk controls, and an integrated dashboard instead of running a closed black-box EA.
Support and updates
Customers receive developer support through the MQL5 product page, and updates are delivered via the standard Market update mechanism. Galaxy Quest Portfolio is part of the Expert Advisor HQ portfolio line, which follows an ongoing maintenance and compatibility process as the MetaTrader 5 platform evolves.
Risk disclosure
Trading forex and other leveraged instruments involves substantial risk of loss. Automated trading systems carry the same market risks as manual trading, and past performance from backtests or live trading does not guarantee future results. Always configure risk in line with your tolerance and never trade capital you cannot afford to lose.