Aroon Precision Trends MT5

Introducing the Aroon Indicator - Your Ultimate Trend Analysis Tool!

Are you looking to take your trading game to the next level? Want to identify lucrative entry and exit points in the financial markets with ease? Look no further! The Aroon Indicator is here to revolutionize your trading strategy and help you make informed decisions like never before.

Developed by the brilliant mind of Tushar Chande, the Aroon Indicator is a powerful technical analysis tool designed to measure the strength and direction of trends in any market. Whether you're trading stocks, forex, cryptocurrencies, or commodities, this indicator will be your trusted ally in the quest for profitable trades.


How It Works:

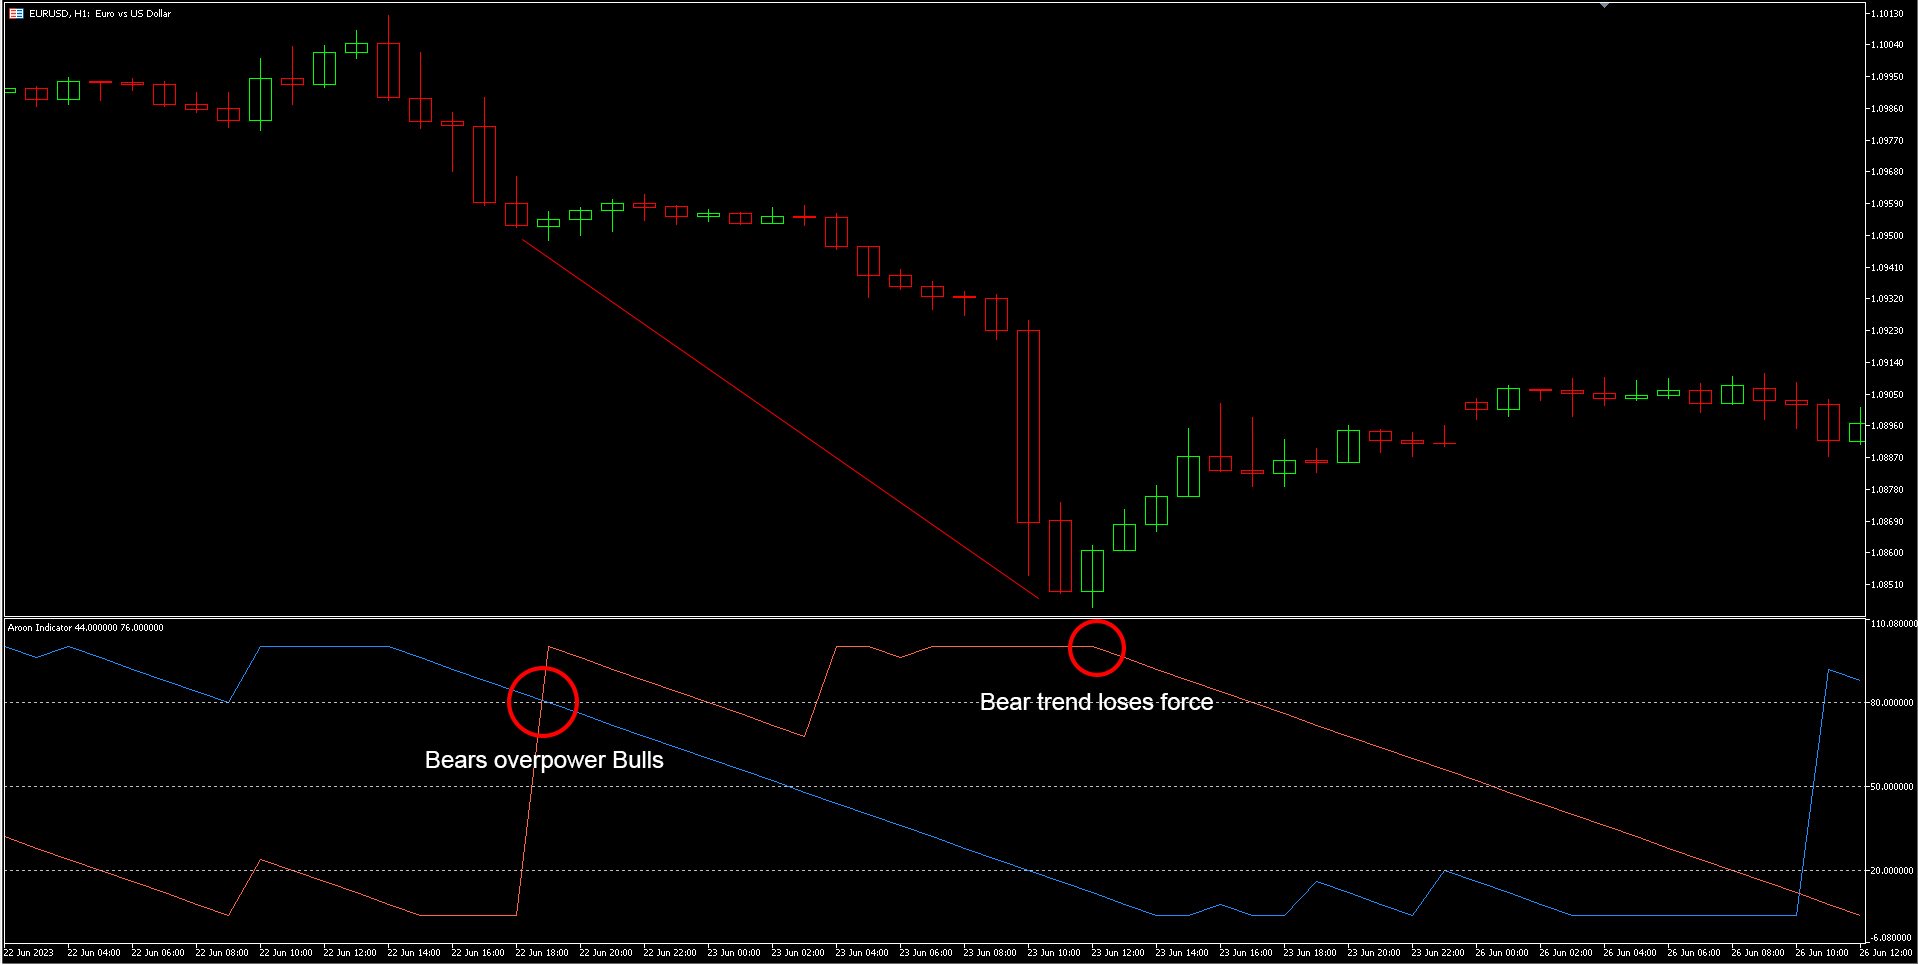
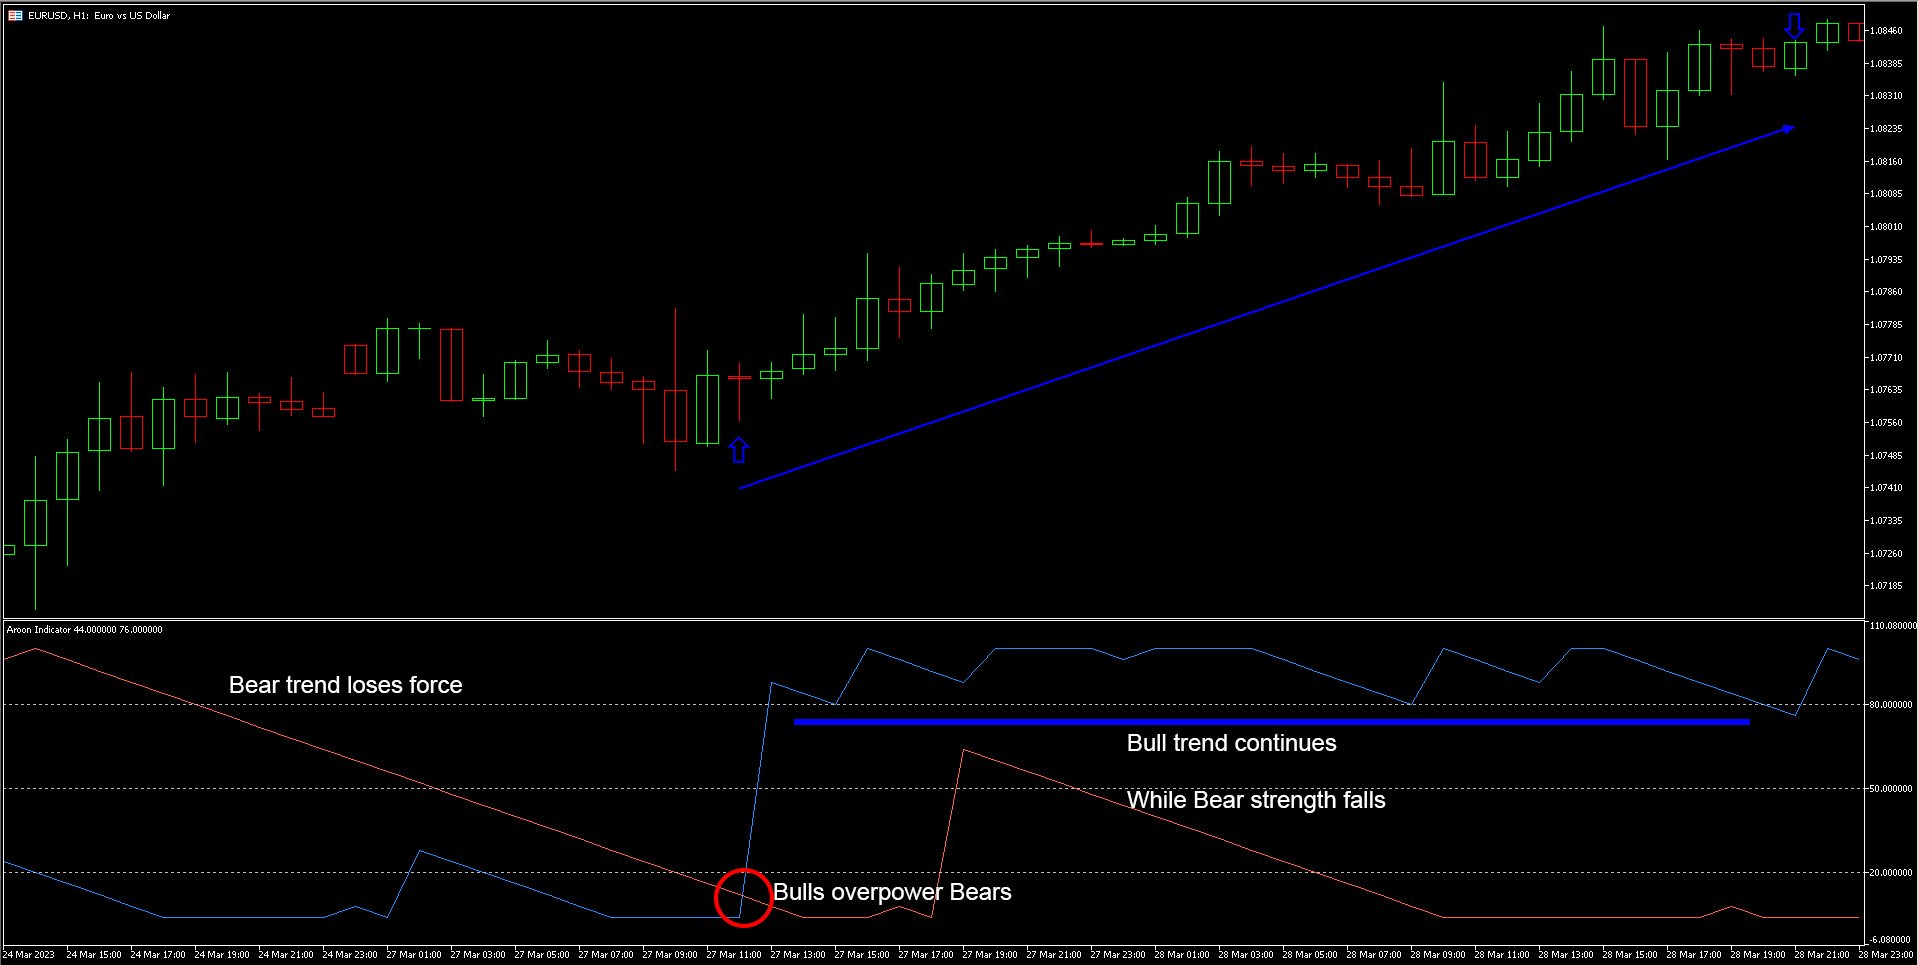
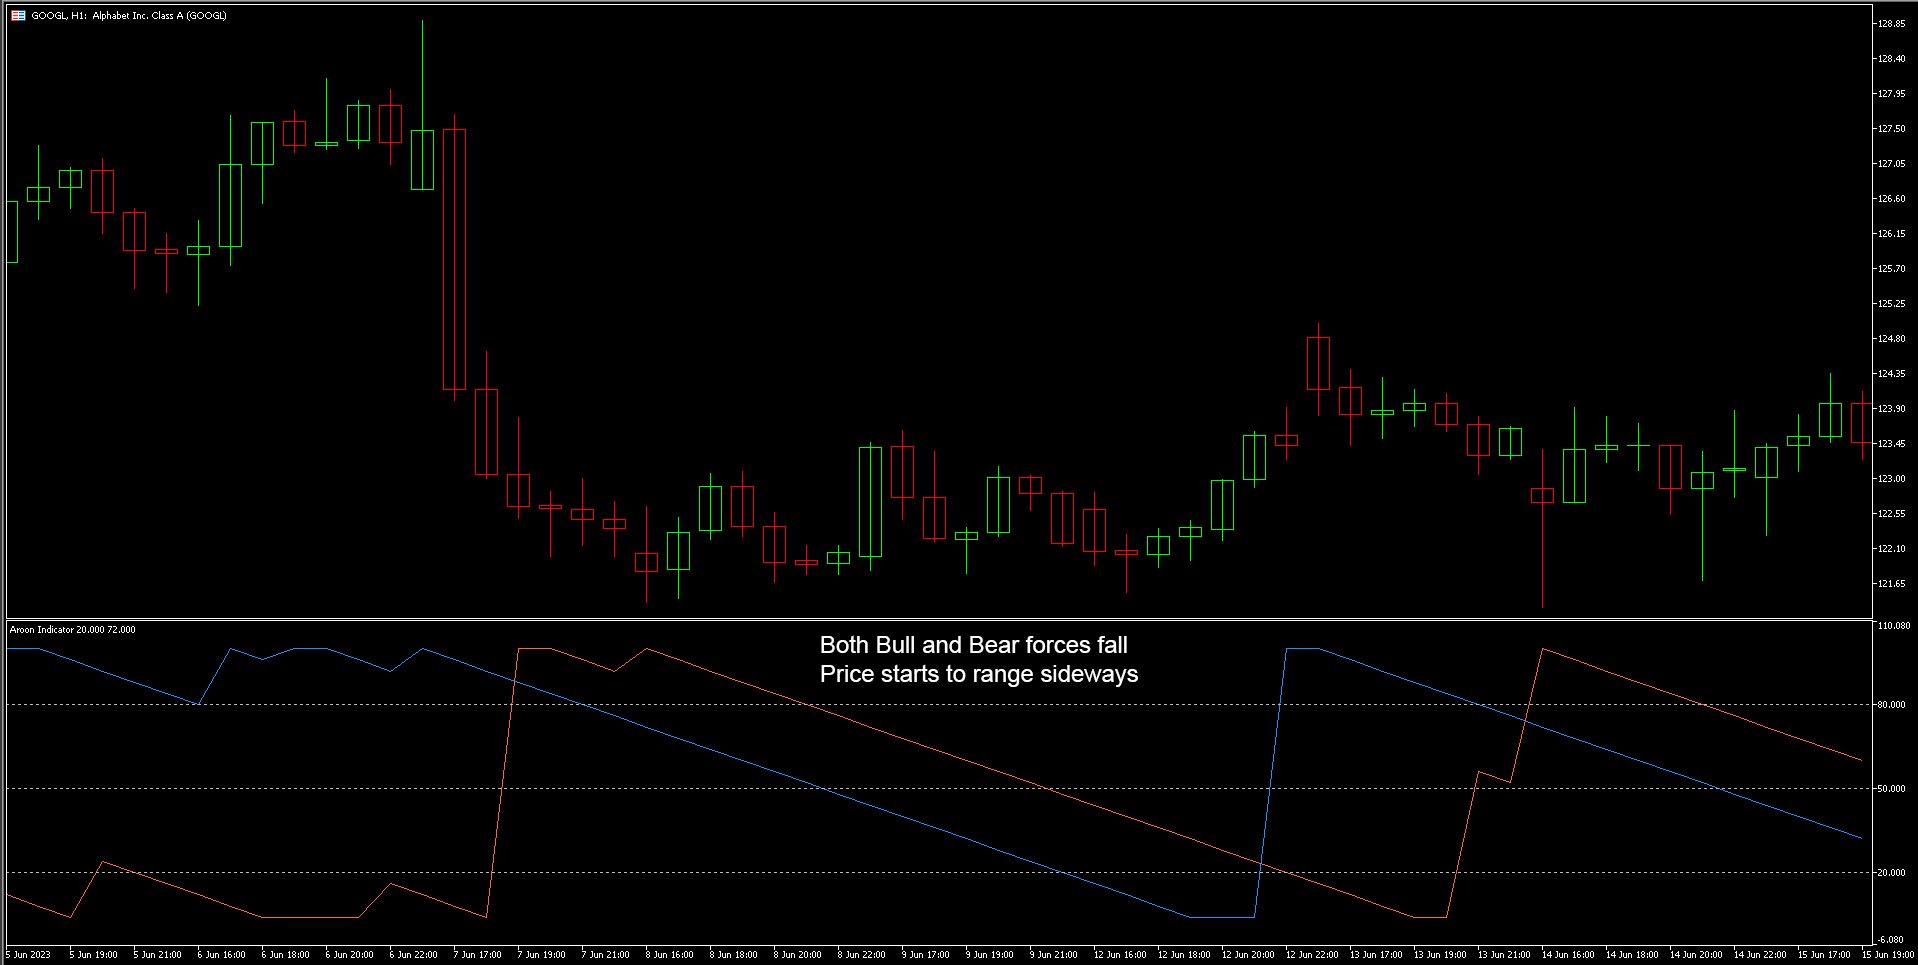
The Aroon Indicator comprises two dynamic lines - Aroon Up and Aroon Down. These lines gauge the time elapsed since the highest high and lowest low within a specified period, respectively. By analyzing the interplay between these lines, the Aroon Indicator provides crystal-clear insights into market trends.


Key Features and Benefits:

  1. Identify Trends Like a Pro: Say goodbye to guesswork! The Aroon Indicator clearly defines whether a market is experiencing an uptrend, downtrend, or a sideways movement. No more second-guessing, only data-driven decisions.

  2. Precise Entry and Exit Points: Never miss a profitable opportunity again! The Aroon Indicator's timely signals will guide you towards the perfect moments to enter or exit trades, maximizing your profits and minimizing risks.

  3. Evaluate Trend Strength: With values ranging from 0 to 100, you can now gauge the strength of the trend at a glance. Capitalize on strong trends and sidestep weak ones effortlessly.

  4. Customizable for Your Strategy: Tailor the Aroon Indicator to suit your trading style. Adjust the number of periods to fine-tune its sensitivity and align it with your preferred timeframes.

  5. Backed by Proven Success: Tushar Chande's creation has stood the test of time and garnered accolades from seasoned traders worldwide. Join the ranks of successful investors who rely on the Aroon Indicator.


How to Get Started:

  1. Download and Install: Access the Aroon Indicator instantly by downloading right here. Installation is a breeze, allowing you to get started in no time.

  2. Understand the Signals: Even if you're new to technical analysis, you'll grasp its concepts effortlessly. The two lines shown are the Aroon UP (in blue by default) representing the strength of Bull trends and Aroon Down (in orange by default) representing the Bear trends.

  3. Integrate with Your Strategy: Combine the Aroon Indicator with your existing tools and techniques for a comprehensive trading approach. Unlock new possibilities for profit and growth.


Don't let market uncertainty hold you back! Equip yourself with the Aroon Indicator and elevate your trading game to new heights. Take control of your financial future and embark on a journey of profitable trades today!


Try it for Yourself - Download the Demo Version Now!

Not quite convinced yet? We understand that you may want to experience the power of the Aroon Indicator firsthand before making a commitment. That's why we offer a fully functional demo version for you to explore its potential without any risk.

Our demo version grants you access to all the essential features of the Aroon Indicator, allowing you to analyze historical market data and see how it would have influenced your past trading decisions. Gain insights into its accuracy, simplicity, and how it seamlessly integrates into your trading strategy.


Share Your Experience - Leave a Review!

Leaving a review is simple and helps us understand how the Aroon Indicator has positively impacted your trading journey. Whether you've just started using it or have been a loyal user for some time, your insights can be invaluable to both us and fellow traders.


[Disclaimer: The Aroon Indicator is a powerful tool, but prudent risk management and careful analysis are essential for successful trading. Past performance is not indicative of future results. Always remember to do your due diligence and consult with financial experts before making any investment decisions.]
추천 제품
Probability Advanced Indicator
Dioney De Jesus Batista Alves
ProbabilityAdvancedIndicator 는 스캘핑(scalping) 및 데이 트레이딩(day trading)을 위해 설계된 정교한 트렌드 확률 분석 도구입니다. 여러 기술 지표와 다중 시간대 분석을 결합하여 매수/매매 확률을 시각적으로 명확하게 표시합니다. ProbabilityAdvancedIndicator 는 다음과 같은 트레이더를 위한 종합 솔루션입니다: 확률 기반 의사 결정 통합 기술 분석 다양한 트레이딩 스타일 적용 가능 직관적이고 사용자 정의 가능한 인터페이스 전문가 팁:   특히 지지/저항 구역에서 신호 확인률을 높이려면 가격 행동 분석(price action)과 함께 사용하는 것이 효과적입니다. (참고: '스캘핑'과 '데이 트레이딩'은 한국어로도 동일한 용어로 통용됩니다)
Golden Swing
Goyani Piyushbhai
Golden Swing EA: Master Market Swings with Precision and Power! The Golden Swing EA is a sophisticated trading tool that leverages the timeless power of Fibonacci , advanced money management , and cutting-edge risk controls ️ to deliver exceptional performance across all markets. Designed for traders of all levels, this EA combines intelligence, efficiency, and flexibility to achieve a high win rate and consistent results. Core Features of Golden Swing EA Fibonacci Precision A
Noize Absorption Index
Ekaterina Saltykova
Noize Absorption Index - is the manual trading system that measures the difference of pressure between bears forces and bulls forces. Green line - is a noize free index that showing curent situation. Zero value of index shows totally choppy/flat market.Values above zero level shows how powerfull bullish wave is and values below zero measures bearish forces.Up arrow appears on bearish market when it's ready to reverse, dn arrow appears on weak bullish market, as a result of reverse expectation.
The Inside Bar e one is a reversal/continuation candle formation, and is one of the most traded candle patterns. Robot F1 allows you to configure different trading strategies, Day Trade or swing trade, based on the Inside Bar as a starting point.  This pattern only requires two candles to perform. Robot F1 uses this extremely efficient pattern to identify trading opportunities. To make operations more effective, it has indicators that can be configured according to your strategy. Among the o
지표 공급 수요 RSJ PRO는 그래프에 "공급" 및 "수요" 영역을 계산하고 표시하여 영역 유형(약함, 강함, 확인됨, 입증됨)을 식별하고 영역을 다시 테스트하는 경우 몇 번인지 보여줍니다. 재시험했다. "공급" 구역은 수요보다 공급이 더 많이 발생하여 가격을 낮추는 가격 구역입니다. "수요" 구역은 공급보다 많은 수요가 발생하여 가격을 상승시키는 가격 구역입니다. 구성 가능한 기능 및 경고가 포함된 전문가용 버전을 사용해 보십시오: Suppy Demand RSJ PRO 구역 분류 약함: 다시 테스트할 경우 위반될 가능성이 있는 가격 영역입니다. 강함: 추세의 방향을 변경했고 그렇게 빨리 재시험될 가능성이 없는 가격 영역. 검증됨: 최대 1~3번의 재테스트가 있었지만 가격이 해당 영역을 깰 수 없는 강한 가격 영역. 입증됨: 3회 이상의 재시험이 있었지만 가격이 해당 지역을 돌파하지 못한 강한 가격 영역. Broken/Turncoat: 지지의 경우 저항이 되고 지지의 경우
Master Calendar Osw
William Oswaldo Mayorga Urduy
OSW 마스터 캘린더 이 지표는 처음에는 개인적인 용도로 만들어졌지만 조금씩 개선해 나가고 있으며 일상적인 거래에 도움이 되는 기능을 구현하고 있으며 유용하다면 계속해서 기능을 구현할 예정입니다. 달력 세부정보. > 날짜, 국가, 통화, 뉴스 분야, 뉴스 이름, 이전, 예측 및 현재 데이터와 같은 데이터가 포함된 현재 날짜에 가까운 뉴스의 모바일 및 상세 캘린더입니다. >캘린더는 5분마다 자동으로 업데이트됩니다. > 메뉴에서 색상, 거래 세션 및 시작 시간을 구성하여 중요도에 따라 보고 싶은 뉴스를 선택할 수 있습니다. 색상 변경 >캘린더에는 색상을 변경하는 내부 기능이 있습니다. 현재 값이 이전 값보다 크면 파란색으로 변하고, 그렇지 않으면 빨간색으로 변하고, 중립은 회색으로 변합니다. >뉴스의 색상과 중요도에 따라 뉴스 설명 텍스트의 색상을 메뉴에서 구성할 수 있습니다. > 뉴스로 인해 통화가 강화되면 통화 이름과 국가가 파란색으로 설정되고, 그렇지 않으면 빨간색
Maximum Trend Arrows OT MT5
Mulweli Valdaz Makulana
STRICTLY FOR BOOM INDEX ONLY!!!!! Here I bring the Maximum Trend Arrows OT1.0 MT5 indicator. This indicator is made up of a combination of different trend indicators for entries and exits, for entries an orange arrow will paint on the chart below the current market and a red flag for closing of trades and it produces buy arrows only. When the orange arrow appears, it will appear along with it's sound to notify you. The 1H timeframe is recommended, don't use it anywhere else than on the 1H timefr
BlockOscilationDay
Everton Fernando Da Silva Messias
BlockOscilationDay - 전문 시장 분석 도구 설명 BlockOscilationDay는 시장 움직임을 명확하고 우아하게 시각화하는 정교한 기술 지표입니다. 단순성과 효율성을 중시하는 트레이더를 위해 개발된 이 지표는 깔끔하고 직관적인 인터페이스 내에 여러 정보 계층을 결합합니다. 미니멀리스트 디자인 철학은 차트를 복잡하게 하지 않으면서 필수 시장 데이터를呈现하여 더 빠르고 정확한 거래 결정을 가능하게 합니다. 이 도구의 지능형 색상 코딩 시스템은 시장 방향과 주요 오실레이션 수준을 즉시 신호하며, 사용자 정의 가능한 구성 요소는 모든 시간대에 걸친 다양한 거래 스타일 및 전략에 완벽하게 적응할 수 있도록 합니다. 주요 특징   다중 시간대 분석 모든 시간대에서 구성 가능한 동적 추세선 이전 거래 세션의 중요한 수준 시각화 지능형 색상 코딩 시스템을 가진 일일 오실레이션 사각형   스마트 색상 시스템 녹색 사각형 : 현재 가격 ≥ 일일 중간점   [(고
PipFinite Trend PRO MT5
Karlo Wilson Vendiola
4.84 (556)
Breakthrough Solution For Trend Trading And Filtering With All Important Features Built Inside One Tool! Trend PRO's smart algorithm detects the trend, filters out market noise and gives entry signals with exit levels. The new features with enhanced rules for statistical calculation improved the overall performance of this indicator. Important Information Revealed Maximize the potential of Trend Pro, please visit www.mql5.com/en/blogs/post/713938 The Powerful Expert Advisor Version Automatin
Golden Limit
Renato Fridschtein
There are no limits! Golden Limit is the ultimate indicator to get clear and easy readings of price movements on charts. It projects support and resistance ranges, calculated by statistical models involving Price Action and the Fibonacci sequence, revealing in advance the behavior of prices and the best places to trade and not to trade. It also has two moving averages to help choose the best entries. The Golden Limit method was created from a proven model. In summary: We use the names of precio
Your Trend Friend
Luigi Nunes Labigalini
5 (1)
The trend is your friend! Look at the color of the indicator and trade on that direction. It does not  repaint. After each candle is closed, that's the color of the trend. You can focus on shorter faster trends or major trends, just test what's most suitable for the symbol and timeframe you trade. Simply change the "Length" parameter and the indicator will automatically adapt. You can also change the color, thickness and style of the lines. Download and give it a try! There are big movements w
Delta Profile Volume
Teresinha Moraes Correia
기술 설명 – MetaTrader 5용 Delta Profile Delta Profile 은 MetaTrader 5에서 정의된 캔들 범위 내의 거래량 흐름을 세부적으로 분석하기 위해 설계된 지표입니다. 이 도구는 각 가격 수준에서 양의 거래량(상승과 관련) 과 음의 거래량(하락과 관련) 간의 불균형을 구조화하고 시각화합니다. 이를 통해 사용자는 실제로 거래가 집중되는 가격 영역과 시장 불균형이 형성되는 구간을 명확하게 파악할 수 있습니다. 핵심 개념 지표는 가격 레벨 을 인식하고 이를 양의 거래량, 음의 거래량 및 순 델타(양-음 차이)로 분류합니다. 각 가격 레벨은 수평 막대 로 차트에 표시되며, 거래가 집중되는 구간을 직관적으로 보여줍니다. 사용자는 분석할 캔들의 개수 , 가격 반올림 정밀도 , 최대 표시 레벨 수 , 표시 옵션 등을 직접 설정할 수 있습니다. 주요 기능 가격 레벨 매핑 : 사용자가 지정한 자릿수에 맞게 가격을 반올림하여 거래량을 집계합니다. 순 델타 계산 : 양
Magic Finger can help you identify trends and trading opportunities clearly. The finger points to the open position signal, and the discoloration line is confirmed by the trend. If you are a day trader, you can choose to trade during a period of active trading, referring to the discoloration line as the basis for the next order, finger signal as a filter. If you are a trend trader, you can choose a period above H1, wait for the appearance of the finger signal in the key price area, and enter th
Volume Profile Indicator used by professional Traders at Traders Inside Ltd. If you want to succeed in trading you need to know if current price is cheap, expensive or fair valued. Key features: Fair price (Point of control, POC), high and low price zones (POH, POL) POC in different timeframes for better orientation Symbol and timeframe Chart resize on open positions/orders, VPRmax/min Historic POC - see, how POC has changed the last periods Button to show/hide VPR Calculated Bars (best results)
Atomic Analyst MT5
Issam Kassas
4.18 (22)
우선적으로 언급할 점은이 거래 지표가 다시 그리지 않고 지연되지 않으며 이를 통해 수동 및 로봇 거래 모두에 이상적이라는 점입니다. 사용자 매뉴얼: 설정, 입력 및 전략. Atomic Analyst는 가격의 강도와 모멘텀을 활용하여 시장에서 더 나은 이점을 찾는 PA Price Action Indicator입니다. 고급 필터를 장착하여 잡음과 거짓 신호를 제거하고 거래 잠재력을 높이는 데 도움이 됩니다. 복잡한 지표의 다중 레이어를 사용하여 Atomic Analyst는 차트를 스캔하고 복잡한 수학적 계산을 간단한 신호와 색상으로 변환하여 초보 트레이더가 이해하고 일관된 거래 결정을 내릴 수 있도록합니다. "Atomic Analyst"는 새로운 및 경험이 풍부한 트레이더를위한 종합적인 거래 솔루션입니다. 프리미엄 지표와 최고 수준의 기능을 하나의 거래 전략에 결합하여 모든 종류의 트레이더에 대한 다재다능한 선택지가되었습니다. 인트라데이 거래 및 스캘핑 전략 : 빠르고 정확한 일일
Mac-Binary option Signals is unique mathematical concept to trade iqoptions,binary,rocketoptions specter or any other binary options company 1 min 5 expiry run robot 30min everyday and fill profit and loss ratios inside mt2iq/mt2binary and run or 1min to 5min expiry ...go to setting in mt2iq robot allow otc and digital options. and select risk 500and profit 300$ per day it can stop automatically after profit or loss... If it can close after loss restart and Reset profit and loss button run again
Mine Farm
Maryna Kauzova
Mine Farm is one of the most classic and time-tested scalping strategies based on the breakdown of strong price levels. Mine Farm is the author's modification of the system for determining entry and exit points into the market... Mine Farm - is the combination of great potential with reliability and safety. Why Mine Farm?! - each order has a short dynamic Stop Loss - the advisor does not use any risky methods (averaging, martingale, grid, locking, etc.) - the advisor tries to get the most
"Impulses and Corrections 5" is created to help traders navigate the market situation. The indicator shows multi-time frame upward and downward "Impulses" of price movements. These impulses are the basis for determining the "Base" , which is composed of zones of "Corrections" of price movements, as well as "Potential" zones for possible scenarios of price movement. Up and down impulses are determined based on a modified formula of Bill Williams' "Fractals" indicator. The last impulse is always
Gann Time–Price Square Cycles (MT5) This indicator applies the concept of time–price balance introduced by W.D. Gann. It detects price swings on the chart and projects Quarter, Half, and Full cycle time intervals forward, marking them with vertical lines. The tool is designed to help traders study the relationship between swing size and elapsed time directly on MT5 charts. Functions Detects swing highs and lows based on pivot depth and minimum swing size. Projects Quarter, Half, and Full harmon
Owl Smart Levels MT5
Sergey Ermolov
4.03 (32)
MT4 버전  |  FAQ Owl Smart Levels Indicator 는 Bill Williams 의 고급 프랙탈, 시장의 올바른 파동 구조를 구축하는 Valable ZigZag, 정확한 진입 수준을 표시하는 피보나치 수준과 같은 인기 있는 시장 분석 도구를 포함하는 하나의 지표 내에서 완전한 거래 시스템입니다. 시장과 이익을 취하는 장소로. 전략에 대한 자세한 설명 표시기 작업에 대한 지침 고문-거래 올빼미 도우미의 조수 개인 사용자 채팅 ->구입 후 나에게 쓰기,나는 개인 채팅에 당신을 추가하고 거기에 모든 보너스를 다운로드 할 수 있습니다 힘은 단순함에 있습니다! Owl Smart Levels 거래 시스템은 사용하기 매우 쉽기 때문에 전문가와 이제 막 시장을 연구하고 스스로 거래 전략을 선택하기 시작한 사람들 모두에게 적합합니다. 전략 및 지표에는 눈에 보이지 않는 비밀 공식 및 계산 방법이 없으며 모든 전략 지표는 공개되어 있습니다. Owl Smart Levels를 사
Key level analysis : The indicator tracks the nearest annual high and low to the current price over a chosen number of years. Proximity alerts : It triggers an alert when the price reaches a specified number of pips from the nearest high or low. Customizable notification intervals : You can set how often alerts repeat, for example, every 30 minutes. Historical perspective : Enables long-term tracking of market levels and effective planning of trading strategies. Multi-currency support : This ind
Liquidity Oscillator
Paolo Scopazzo
3 (2)
A powerful oscillator that provide Buy and Sell signals by calculating the investor liquidity. The more liquidity the more buy possibilities. The less liquidity the more sell possibilities. Please download the demo and run a backtest! HOW IT WORKS: The oscillator will put buy and sell arrow on the chart in runtime only . Top value is 95 to 100 -> Investors are ready to buy and you should follow. Bottom value is 5 to 0 -> Investors are ready to sell and you should follow. Alert + sound will appe
Inverted_Chart_EA Utility Expert Advisor Inverted_Chart_EA creates and maintains a mirror-inverted chart of any symbol and timeframe. It automatically generates a custom instrument (e.g. US30_INV ) and keeps its price history updated in real time, with bars mirrored around a chosen pivot. This utility gives traders a new way to analyze the market from a different perspective by flipping the chart upside down. Why use an inverted chart? Highlight hidden patterns – price formations that look ordin
Mercadulls Trade
Gilberto Rodrigues
The   Mercadulls   Indicator gives to you many signals types, detecting supports, resistances and accumulation/distribution zones. The indicator constantly checks the graph for direct analysis and the appearance of long trends. Main characteristics No repaint! Stop loss and take profit levels are provided by the indicator. Suitable for Day Traders, Swing Traders, and Scalpers. Optimized algorithm to increase the accuracy of signals. Technical analysis indicator for all assets available in the m
Overview The Market Perspective Structure Indicator is a comprehensive MetaTrader indicator designed to provide traders with a detailed analysis of market structure across multiple timeframes. It identifies and visualizes key price action elements, including swing highs and lows, Break of Structure (BOS), Change of Character (CHOCH), internal structures, equal highs/lows, premium/discount levels, previous levels from higher timeframes, and trading session zones. With extensive customization opt
TrendView Ultimate — A Complete Trading System for Trend Clarity, Profit Insight, and Strategic Entries TrendView Ultimate is a professional trading system designed to help traders identify trend direction, high-quality entries, and potential exits with clarity, confidence, and measurable performance. More than just a trend indicator, it offers non-repainting signals, dynamic visual feedback, and a powerful statistics panel with real-time analytics, allowing traders to test, adapt, and valida
Double HMA MTF for MT5
Pavel Zamoshnikov
4 (4)
This is an advanced multi-timeframe version of the popular Hull Moving Average (HMA) Features Two lines of the Hull indicator of different timeframes on the same chart. The HMA line of the higher timeframe defines the trend, and the HMA line of the current timeframe defines the short-term price movements. A graphical panel with HMA indicator data from all timeframes at the same time . If the HMA switched its direction on any timeframe, the panel displays a question or exclamation mark with a tex
WanaScalper
Isaac Wanasolo
1 (1)
A scalping indicator based on mathematical patterns, which on average gives signals with relatively small SL, and also occasionally helps to catch big moves in the markets (more information in the video) This indicator has three main types of notifications: The first type warns of a possible/upcoming signal on the next bar The second type indicates the presence of a ready signal to enter the market/open a position The third type is for SL and TP levels - you will be notified every time price re
Premium level Pro
Dmitriy Kashevich
Premium level is a unique indicator with more than 80% accuracy of correct predictions! This indicator has been tested for more than two months by the best Trading Specialists! The author's indicator you will not find anywhere else! From the screenshots you can see for yourself the accuracy of this tool! 1 is great for trading binary options with an expiration time of 1 candle. 2 works on all currency pairs, stocks, commodities, cryptocurrencies Instructions: As soon as the red arrow app
Cobra Arrow
Pieter Gerhardus Van Zyl
The Cobra Arrow indicator is a precision-engineered signal tool designed for MT5 that identifies potential market turning points using a unique hybrid of volatility, momentum, and exhaustion dynamics. It visualizes trade opportunities directly on the chart through clear orange and magenta arrows positioned with adaptive ATR-based offsets for enhanced readability and context awareness. Internally, it blends short-term oscillator sensitivity with price strength evaluation to detect when momentum
이 제품의 구매자들이 또한 구매함
ARIPoint
Temirlan Kdyrkhan
1 (1)
ARIPoint is a powerful trading companion designed to generate high-probability entry signals with dynamic TP/SL/DP levels based on volatility. Built-in performance tracking shows win/loss stats, PP1/PP2 hits, and success rates all updated live. Key Features: Buy/Sell signals with adaptive volatility bands Real-time TP/SL/DP levels based on ATR Built-in MA Filter with optional ATR/StdDev volatility Performance stats panel (Success, Profit/Loss, PP1/PP2) Alerts via popup, sound, push, or email Cu
TrendMaestro5
Stefano Frisetti
note: this indicator is for METATRADER4, if you want the version for METATRADER5 this is the link:  https://www.mql5.com/it/market/product/108106 TRENDMAESTRO ver 2.4 TRENDMAESTRO recognizes a new TREND in the bud, he never makes mistakes. The certainty of identifying a new TREND is priceless. DESCRIPTION TRENDMAESTRO identifies a new TREND in the bud, this indicator examines the volatility, volumes and momentum to identify the moment in which there is an explosion of one or more of these data a
AriX
Temirlan Kdyrkhan
1 (4)
AriX Indicator for MT5 A powerful trend-following and signal-evaluation tool AriX is a custom MT5 indicator that combines Moving Averages and ATR-based risk/reward logic to generate clear buy/sell signals. It visualizes dynamic SL/TP levels, evaluates past trade outcomes, and displays win/loss statistics in a clean on-chart panel. Key features include: Buy/Sell signals based on MA crossovers ATR-based SL/TP1/TP2/TP3 levels with visual lines and labels Signal outcome tracking with real-time stat
무료 AUX 인디케이터와 EA 지원을 받으세요 직접 다운로드 — 여기를 클릭 [ D.I.C.E ] Divergence in Chaos Environment는 엘리엇 파동 이론과 트레이딩 카오스 기법을 함께 사용하는 트레이더를 위해 설계된 MT5 전문 도구입니다. 가격 움직임의 숨겨진 및 일반 다이버전스를 감지하며, 빌 윌리엄스가 설명한 혼돈 시장 환경과 동기화됩니다. 주요 특징 엘리엇 파동 정렬 다이버전스: 파동 구조에 조화된 강세 및 약세 다이버전스를 탐지하여 파동 카운팅 정확도를 높입니다. 카오스 기법 통합: AO(오썸 오실레이터) 및 시장 구조 원칙과 일치하도록 설계되었습니다. 다중 타임프레임 스캐닝: 다양한 시간 프레임에서 다이버전스를 분석하여 모멘텀 변화와 추세 소진을 확인합니다. 시각적 알림 및 객체: 명확한 화살표, 선, 표시로 빠른 인식 가능. 적응형 시장 판독: 혼돈 시장 조건에 자동으로 조정되어 노이즈를 필터링하고 유효한 셋업만 유지합니다. Break Pullba
ARIScalping
Temirlan Kdyrkhan
ARIScalp is a powerful trading companion designed to generate high-probability entry signals with dynamic TP/SL/DP levels based on volatility. Built-in performance tracking shows win/loss stats, PP1/PP2 hits, and success rates all updated live. Key Features: Buy/Sell signals with adaptive volatility bands Real-time TP/SL/DP levels based on ATR Built-in MA Filter with optional ATR/StdDev volatility Performance stats panel (Success, Profit/Loss, PP1/PP2) Alerts via popup, sound, push, or email Cus
ARICoins
Temirlan Kdyrkhan
ARICoin is a powerful trading companion designed to generate high-probability entry signals with dynamic TP/SL/DP levels based on volatility. Built-in performance tracking shows win/loss stats, PP1/PP2 hits, and success rates all updated live. Key Features: Buy/Sell signals with adaptive volatility bands Real-time TP/SL/DP levels based on ATR Built-in MA Filter with optional ATR/StdDev volatility Performance stats panel (Success, Profit/Loss, PP1/PP2) Alerts via popup, sound, push, or email Cust
Heikin Ashi with Pivot
Anna Russel Abanes
ChartMaster Heikin Ashi with Pivot Indicator for MT5 Take your trading to the next level with ChartMaster Heikin Ashi with Pivot Indicator , a powerful tool that combines the clarity of Heikin Ashi candles with advanced pivot-point analysis. This indicator is designed for traders who want to identify market trends, reversals, and key support/resistance zones with precision. Key Features: Heikin Ashi Visualization – Smooths out market noise for cleaner trend identification. Automatic Pivot
" Dynamic Scalper System MT5 " 지표는 추세 파동 내에서 스캘핑 방식으로 거래하도록 설계되었습니다. 주요 통화쌍 및 금에서 테스트되었으며, 다른 거래 상품과의 호환성이 가능합니다. 추가적인 가격 변동 지원을 통해 추세에 따라 단기 포지션 진입 신호를 제공합니다. 지표의 원리 큰 화살표는 추세 방향을 결정합니다. 작은 화살표 형태의 스캘핑 신호를 생성하는 알고리즘은 추세 파동 내에서 작동합니다. 빨간색 화살표는 상승 방향을, 파란색 화살표는 하락 방향을 나타냅니다. 민감한 가격 변동선은 추세 방향으로 그려지며, 작은 화살표의 신호와 함께 작용합니다. 신호는 다음과 같이 작동합니다. 적절한 시점에 선이 나타나면 진입 신호가 형성되고, 선이 있는 동안 미결제 포지션을 유지하며, 완료되면 거래를 종료합니다. 권장되는 작업 시간대는 M1~H4입니다. 화살표는 현재 캔들에 형성되며, 다음 캔들이 이미 시작되었더라도 이전 캔들의 화살표는 다시 그려지지 않습니다. 입
Price Momentum Matrix
Satya Prakash Mishra
Price Momentum Matrix - Advanced Multi-Timeframe Trading Indicator Revolutionary Market Analysis Tool **Price Momentum Matrix** is a cutting-edge MetaTrader 5 indicator that combines the power of Fibonacci retracements, moving averages, and multi-timeframe analysis to give you an unparalleled edge in the markets. Key Features  **Multi-Timeframe Trend Analysis** - **11 Timeframe Analysis**: From M3 to Weekly charts - **Real-time Trend Detection**: Instant bullish/bearish/sideways signals - **Per
Weis Wave with Alert MT5
Trade The Volume Waves Single Member P.C.
4.94 (17)
Rental/Lifetime Package Options and Privileges  Rent Monthly Six Months   Yearly/Lifetime Weis Wave with Speed with Alert+Speed Index x x x Manual  x x x Quick Set up Video x x x Blog x x x Lifetime Updates x x x Setup and Training Material x x Discord Access Channel "The SI traders"          x Rectangle Break Alert Tool      x How to trade with it:    http://www.tradethevolumewaves.com   ** If you purchase please contact me to setup your  : Training Room and  complete manual access.  Wei
Gann Zone Pro MT5
Kirill Borovskii
This indicator identifies and displays zones, as it were areas of strength, where the price will unfold. The indicator can work on any chart, any instrument, at any timeframe. The indicator has two modes. The indicator is equipped with a control panel with buttons for convenience and split into two modes. Manual mode: To work with manual mode, you need to press the NEW button, a segment will appear. This segment is stretched over the movement and the LVL button is pressed. The level is displayed
Eternal Spike Detector
Emma-ekong Ben Eshiet
Eternal Spike Detector Pro - M5 Mastery System   HOW TO TRADE THIS SYSTEM   TRADING RULES For CRASH 500/900/1000: SELL SETUP: · Wait for RED DOWN ARROW to appear · Enter SELL at the close of the M5 candle where arrow appears · Stop Loss: 1.5x ATR above the entry high · Take Profit: 2-3x ATR below entry · Only trade maximum 7 signals per day For BOOM 500/900/1000: BUY SETUP: · Wait for GREEN UP ARROW to appear · Enter BUY at the close of the M5 candle where arrow appears · Stop Loss: 1.5
Big Bull Scalper
Israr Hussain Shah
Big bull scalper Short Description Master market structure with the precision of the popular Big bull scalper  This tool automatically identifies key pivot highs and lows, plotting unique "angling" trend lines that dynamically define market context. It visually confirms Breaks of Structure (BOS) and Changes of Character (CHoCH), removing all guesswork from your analysis. Key Features:    Automatic Pivot Detection Instantly spots significant swing highs and lows.    Dynamic Angling Lines Visual
Pantera Indicator
Temirlan Kdyrkhan
5 (1)
A tool for on-chart strategy backtesting and performance analysis. A utility for developing, debugging, and testing custom trading ideas and indicator functions. An indicator designed to quickly test trading concepts and visualize the effectiveness of different input parameters. An all-in-one sandbox for testing everything from simple crossovers to complex, multi-condition trading systems.
SupportResistancePeaks Indicator indicator - is the combination of dynamic support/resitance and price action pattern. As a rule support/resistance indicators uses already calculated, history levels. The most disadvantage of this method - new(incomming) levels always are not the same as were on history, in other words accuracy is not so high as expected. My indicator is looking for dynamic/live levels that are forming right now after trend lost it's power and choppy market starts. As a rule exac
Hello I Want to introduce The Forex Buy Sell Arrow Premium MT5 i recently release this premium indicator! its 1000% Non Repaint Indicator, It Work Perfectly Well,, i tested it day by day, Just mind blowing Result,  Including Powerful trend Algorithm! How It Work? well, it work market trend formula, when trend Bullish Or when trend Bearish,  Recommend Timeframe M30, H1 it work all timeframe, and all currency pair, 100% non repaint, How to take signal From Forex Buy Sell Arrow Premium Ind
Big Player Range
Thalles Nascimento De Carvalho
5 (3)
BigPlayerRange – MT5 최고의 지표 BigPlayerRange 는 MetaTrader 5에서 미니 인덱스와 미니 달러를 위한 최고의 지표 로 평가받고 있습니다. 이 도구는 주요 기관 투자자들의 전략적 영역을 강조하여 높은 정확도의 기관 기술 분석을 제공합니다. BigPlayerRange 사용법: 이 지표는 매수 구간(녹색선)과 매도 구간(빨간선)을 표시합니다. 가격이 이 구간 밖에서 마감되면 추세 움직임이 예상됩니다. 녹색선 위에서 마감: 강한 매수세와 상승 추세 가능성. 빨간선 아래에서 마감: 매도 압력과 하락 가능성. 범위 내에서 마감: 횡보 시장, 돌파 신호 대기. 주요 혜택: 기관 투자자 영역 매핑: 주요 투자자들의 활동 구간을 식별합니다. 자동 목표 지점 산출: 거래 종료에 적합한 목표 지점을 제공합니다. 풀백 분석: 리스크 관리를 위한 가격 반등 가능성 평가. 활용 방법: BigPlayerRange와 함께 Imba
VTrende Pro
Andrii Diachenko
5 (1)
VTrende Pro - MTF indicator for trend trading with a display panel for MT5 *** Videos can be translated into any language using subtitles (video language - Russian) Although the signals of the VTrende Pro indicator can be used as signals of a full-fledged trading system, it is recommended to use them in conjunction with the Bill Williams TS. VTrende Pro is an extended version of the VTrende indicator. Difference between Pro version and VTrende: - Time zones - Signal V - signal 1-2 waves -    S
Tragos
David Chokumanyara
TRAGOS Indicator – The GOAT of All Trading Indicators TRAGOS (Greek for “male goat”) isn’t just a name — it’s the GOAT: Greatest of All Time in trading indicators. Designed for Forex, Indices, Gold, Crypto, and Deriv Synthetic Indices (Boom & Crash, Volatility 75, Step, Jump, etc.), it gives you non-repainting buy, sell, and exit signals with unmatched clarity. Why TRAGOS? Non-Repainting Signals – 100% reliable. Audible, Email & Push Alerts – Never miss a trade. Trend Following – Rid
SYSTEM INTRODUCTION:   The Binary Options Momentum System Is Specifically Designed For Binary Options Trading. Unlike Other Systems And Indicators That Were Adopted From Other Trading Environments For Binary Options. Little Wonder Why Many Of Such Systems Fail To Make Money . Many End Up Loosing Money For Their Users.  A Very Important Fact That Must Be Noted Is The Fact That Application Of Martingale Is not Required. Thus Making It Safer For Traders Usage And Profitability. A Trader Can Use Fi
금융 지표 SolarTrade Suite: 수은 시장 지표 - 금융 시장 세계에서 신뢰할 수 있는 가이드! 우리의 외환 거래 프로그램은 실시간으로 시장 데이터를 분석하는 강력한 인공지능을 탑재하고 있습니다. 이 인공지능은 가격 변동을 정확하게 예측하여 트레이더가 정보에 입각한 결정을 내릴 수 있도록 도와줍니다. 고급 알고리즘을 통해 우리의 지표는 전략을 최적화하고 위험을 최소화합니다. 특별하고 혁신적이고 진보된 알고리즘을 사용하여 가치를 계산하고 눈을 즐겁게 하는 디자인을 갖춘 이동 평균입니다. 파란색 - 매수, 빨간색 - 매도 등 이 지표의 수치를 이해하는 것은 매우 간단합니다. 색상이 밝을수록 신호가 강해집니다. 설명 하단에서 다른 SolarTrade Suite 제품을 확인하세요. 투자 및 금융 시장의 세계를 자신있게 탐색하고 싶습니까? SolarTrade Suite Financial Indicator: Mercury Market Indicator는 정보에 입각한 투자 결
Advance GannAngles MT5
Satya Prakash Mishra
Core Concept: Naveen Saroha's Advanced time and price angles are drawn from significant highs or lows at specific geometric ratios that represent the relationship between price movement and time. The Main Gann Angles and Percentage together Most Important: 1x1 Angle : One units of price for one unit of time  1x2 Angle : One unit of price for two units of time  1x3 Angle 1x4 Angle 1x5 Angle 1x6 Angle 1x7 Angle 1x8 Angle: (45) : Eight unit of price for one unit of time - considered the most i
MatadorGate
Metin Erkamoglu
MATADOR (MT5) is a fusion indicator that turns trend + momentum + volatility + SMC into one actionable trading plan. The core engine blends ATR-based SuperTrend bias, an HTF EMA gate, ADX/DI, momentum (MACD/RSI/SMI/MFI/Heikin-Ashi), volatility regimes (Bollinger/Donchian/Keltner, Choppiness/Squeeze), Session VWAP and ADR/ATR with SMC+ (Order Block, FVG, BOS/CHOCH) to produce a pScore (0..1). When conditions pass, MATADOR prints Entry / SL / TP1-TP3 on the chart, fires an alert, and also covers
Scalping Fast2
Ywsf Hsyn Hmad Alrsh
This factor is traded on the 5M five-minute frame Please see the explanations in the attached images Trading is done according to the trend. If the trend is upward, we buy only when the red line is touched If the trend is downward, we sell only when the blue line is touched In the case of a sideways trend, we can sell when the blue line is touched and buy when the red line is touched When the price reaches the red buy line or the sell line from above, we enter a deal and stop the loss at 5
The Second-Level Tick Candlestick Generator is a professional-grade MT5 indicator tool specifically designed for high-frequency trading and short-term scalping. It can convert raw tick data into highly customizable second-level candlestick charts in real-time, helping traders accurately capture micro-market fluctuations and optimize entry and exit timing. This tool provides clear chart displays, allowing you to more intuitively identify price action patterns and improve trading decision efficien
Bullhouse Marketprofile
Luiz Vinicius Pereira Rocha -
Bullhouse MarketProfile Description The MarketProfile indicator collects and distributes traded volume at different price levels, creating a horizontal histogram that highlights areas of institutional interest. How it helps in trading It helps traders identify strong support and resistance zones, balance areas, and points of control (POC), offering insights into where the market participants are most active. ️ How to use Set the desired range of candles or session. The indicator will
XCalper TFO
Aecio de Feo Flora Neto
This oscillator was developed exclusively by xCalper in 2015 based on moving averages calculations to indicate and try predicting oversold and overbought levels. The fast line (white, by default) oscillates basically between values -0.5 (oversold) and +0.5 (overbought). Whenever this line crosses upward value -0.5, it means an oversold price level. When it crosses downward value +0.5, it means an overbought price level. When fast line crosses value 0.0 and returns, it is a strong pull-back indic
Pan PrizMA CD Phase
Aleksey Panfilov
The Expert Advisor and the video are attached in the Discussion tab . The robot applies only one order and strictly follows the signals to evaluate the indicator efficiency. Pan PrizMA CD Phase is an option based on the Pan PrizMA indicator. Details (in Russian). Averaging by a quadric-quartic polynomial increases the smoothness of lines, adds momentum and rhythm. Extrapolation by the sinusoid function near a constant allows adjusting the delay or lead of signals. The value of the phase - wave s
Классификатор силы тренда. Показания на истории не меняет. Изменяется классификация только незакрытого бара. По идее подобен полной системе ASCTrend, сигнальный модуль которой, точнее его аппроксимация в несколько "урезанном" виде, есть в свободном доступе, а также в терминале как сигнальный индикатор SilverTrend . Точной копией системы ASCTrend не является. Работает на всех инструментах и всех временных диапазонах. Индикатор использует несколько некоррелируемых между собой алгоритмов для класси
제작자의 제품 더 보기
Hull Moving Average MT5
Maestri Investment Group Ltd.
4.67 (3)
We value your feedback and believe that your experience with the Hull Moving Average (HMA) is essential to us and other traders. Help us continue to improve and refine our product by sharing your thoughts and insights through a review! The Hull Moving Average (HMA) Indicator – Your Key to Smoother Trends and Profitable Trades! Are you tired of lagging and choppy moving averages that hinder your ability to spot profitable trading opportunities? Look no further! The Hull Moving Average (HMA) is t
FREE
Bull vs Bear Price Strength Oscillator
Maestri Investment Group Ltd.
Introducing the "Bull vs Bear Price Strength Oscillator" Indicator: Your Key to Smart Trading Decisions! Are you looking for a trading tool that can provide you with a clear and visual representation of price trend strength? Look no further! The Price Strength Indicator is here to transform the way you analyze the markets and make trading decisions. Uncover Hidden Market Strength: The Price Strength Indicator is designed to help you assess the market's momentum with ease. It does this by evaluat
필터:
리뷰 없음
리뷰 답변