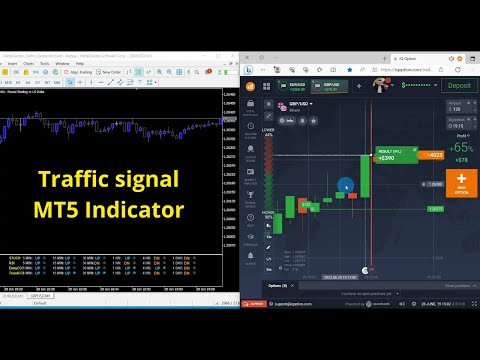
Traffic Signal

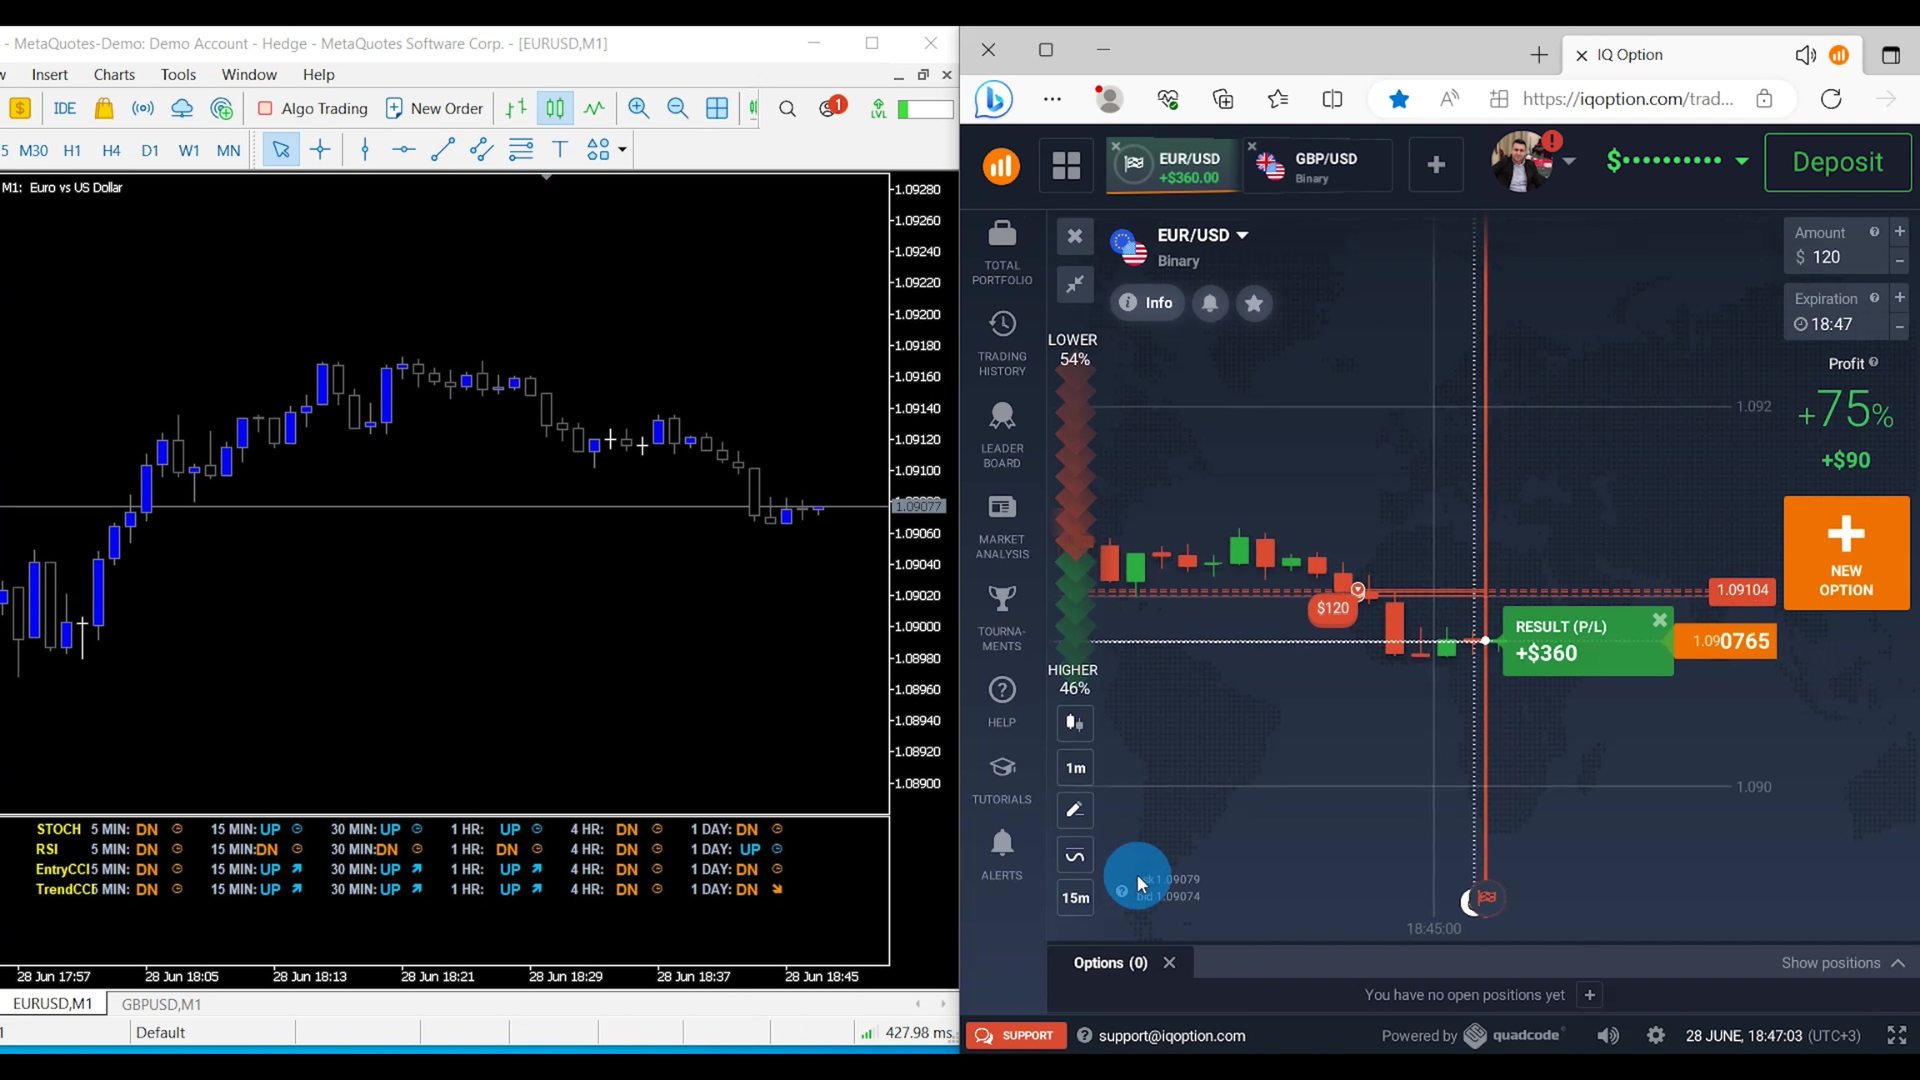
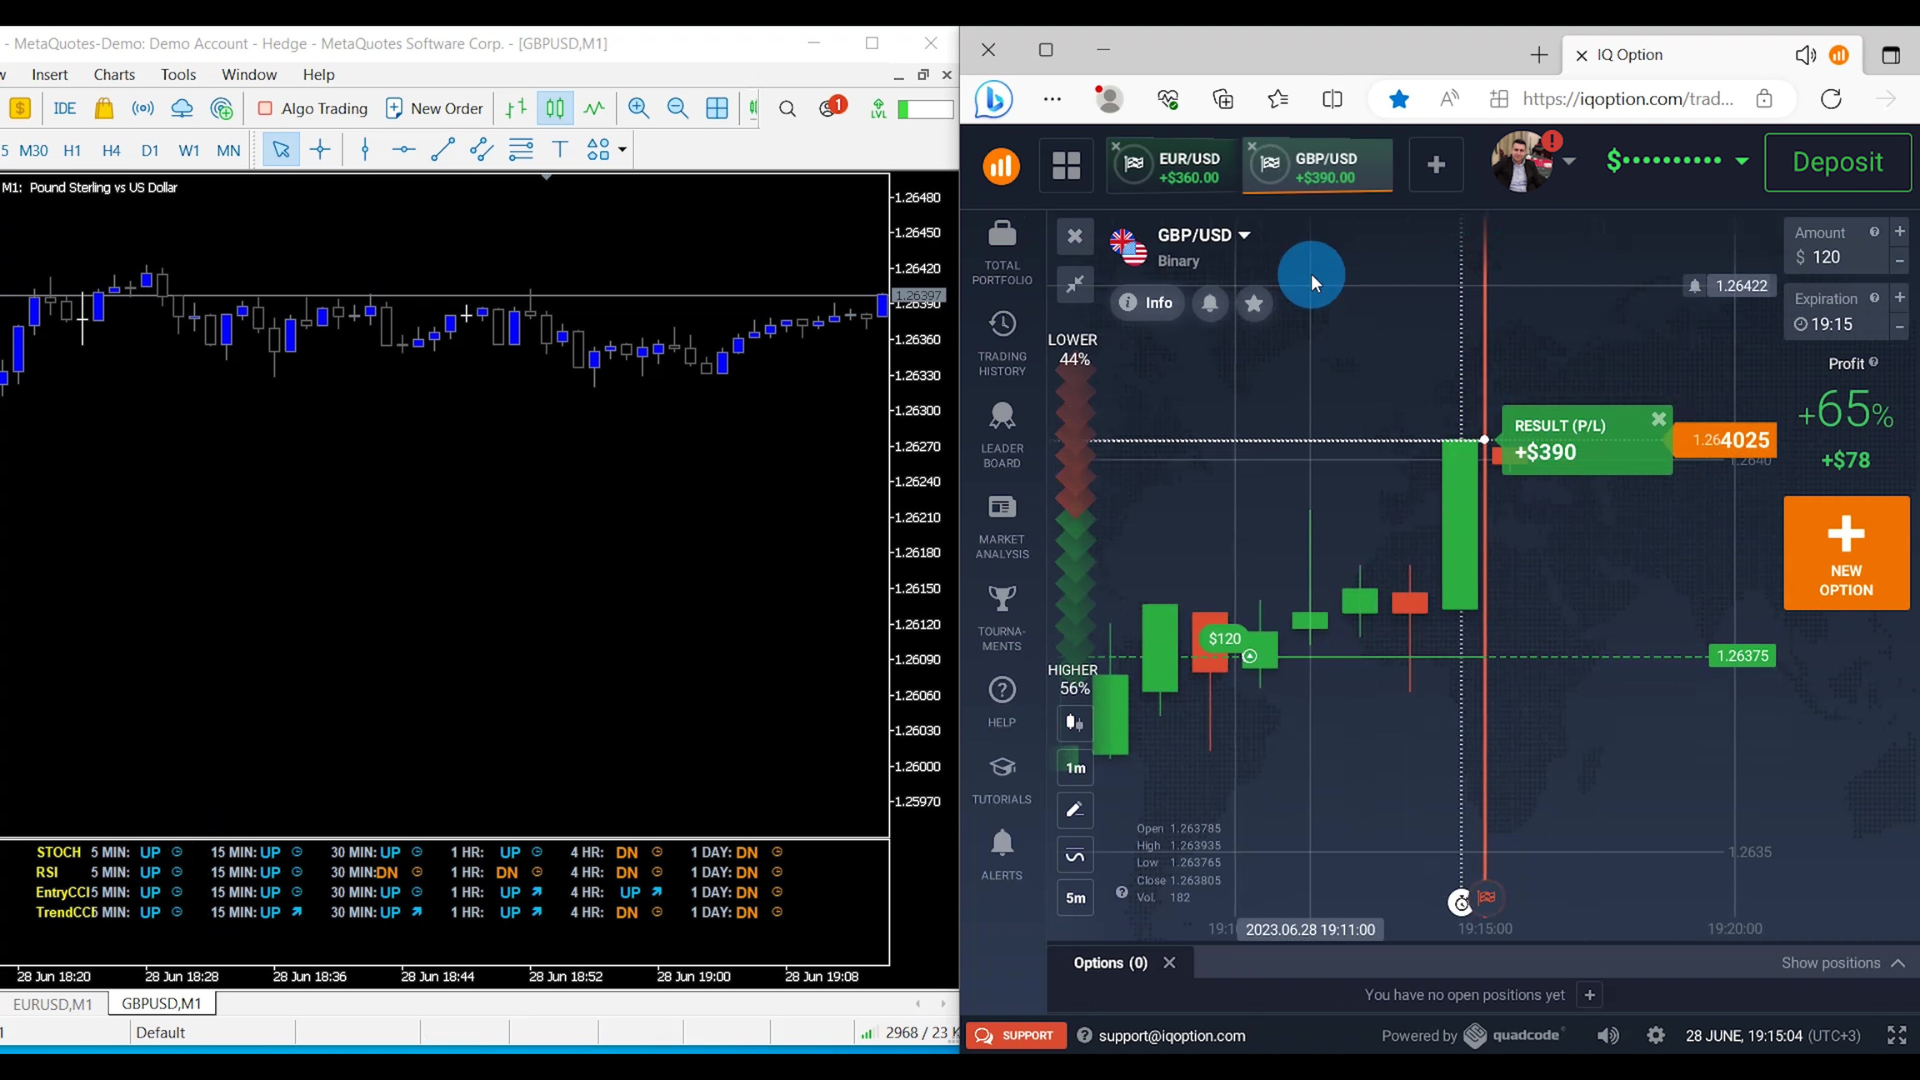
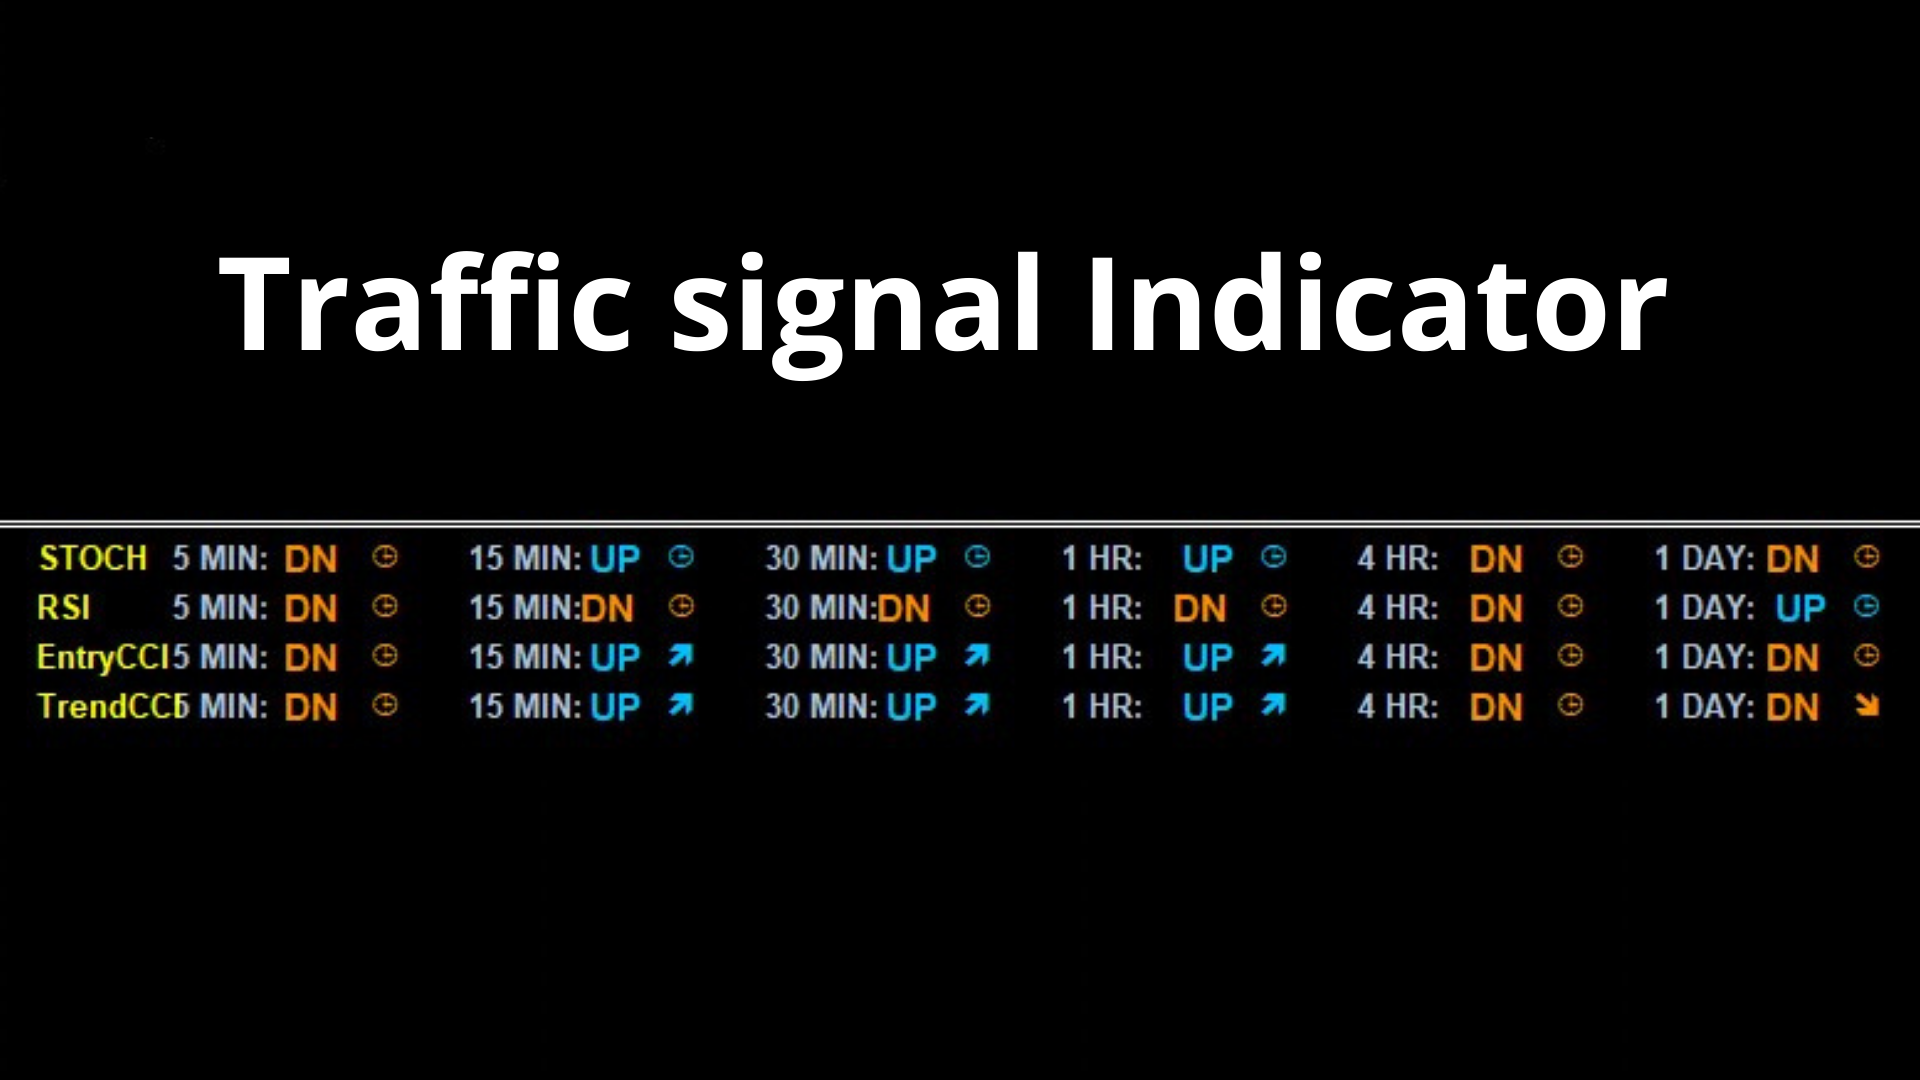
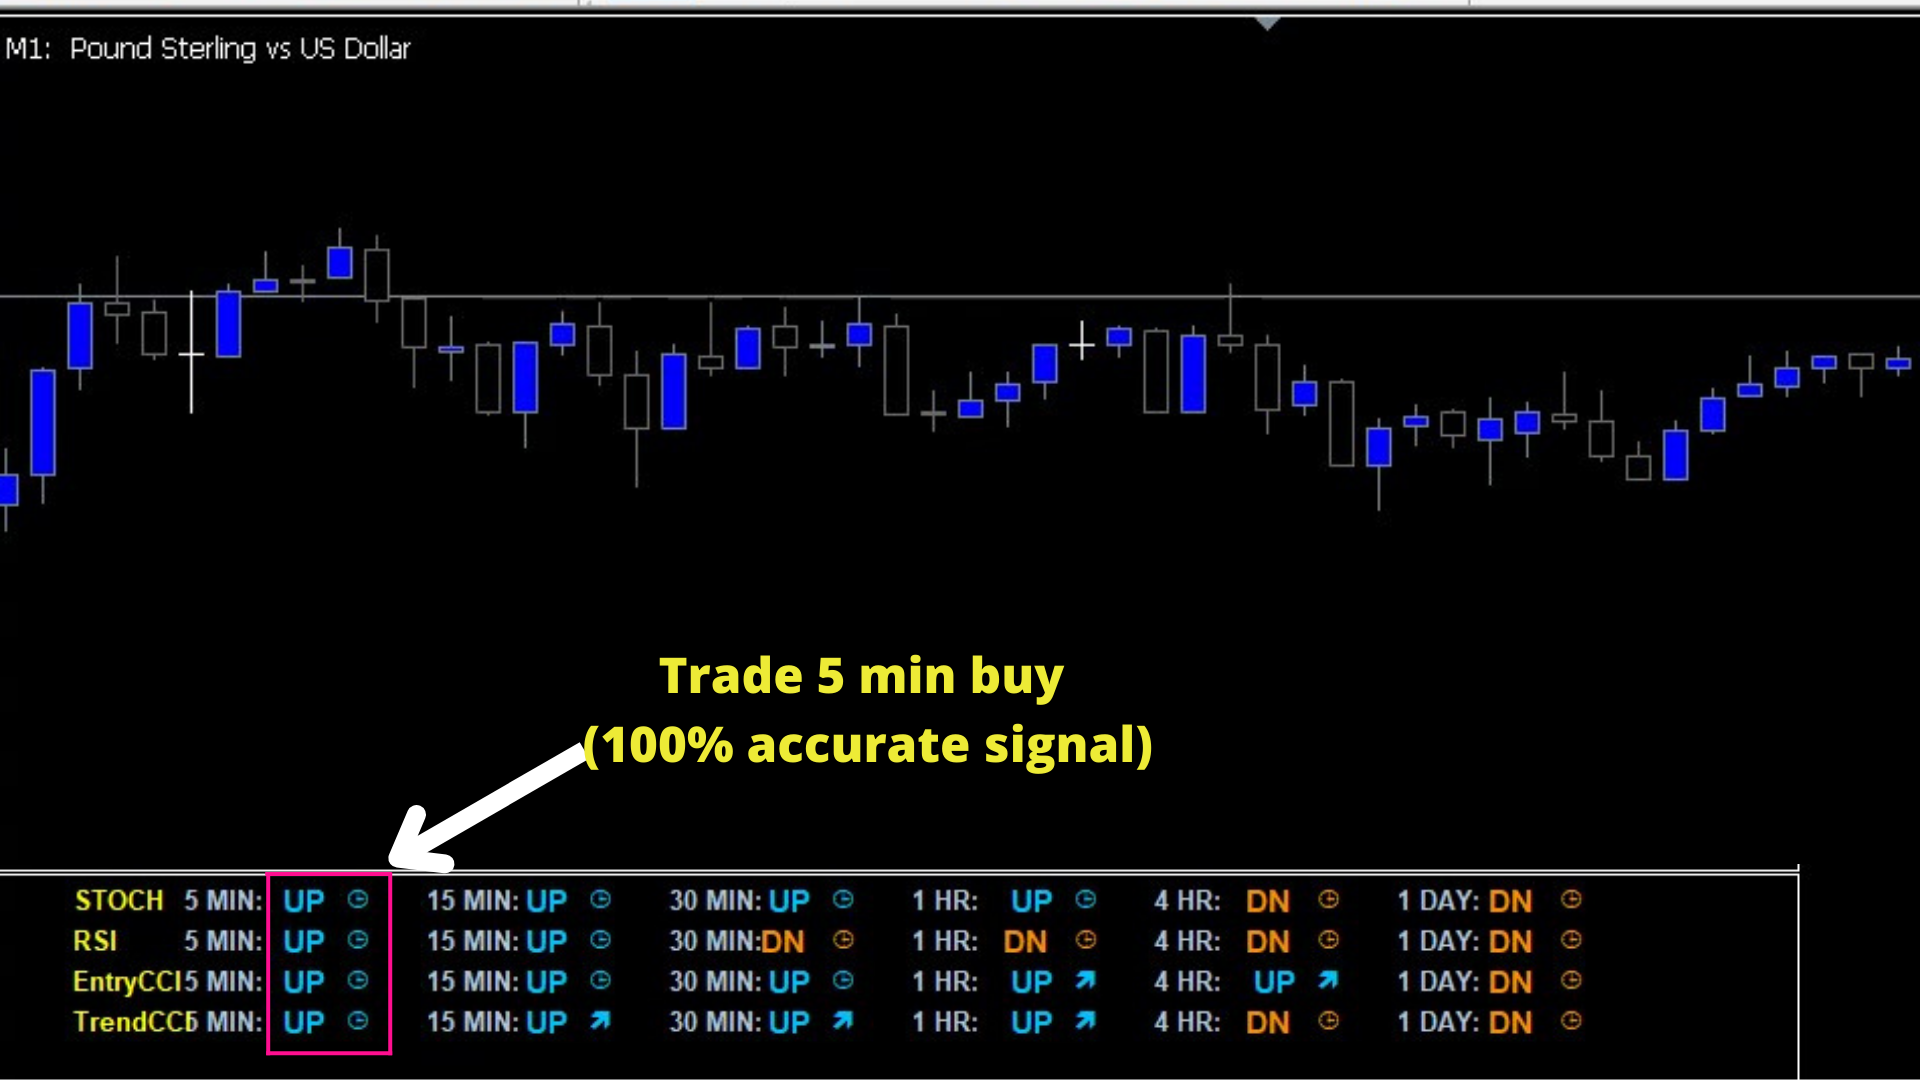
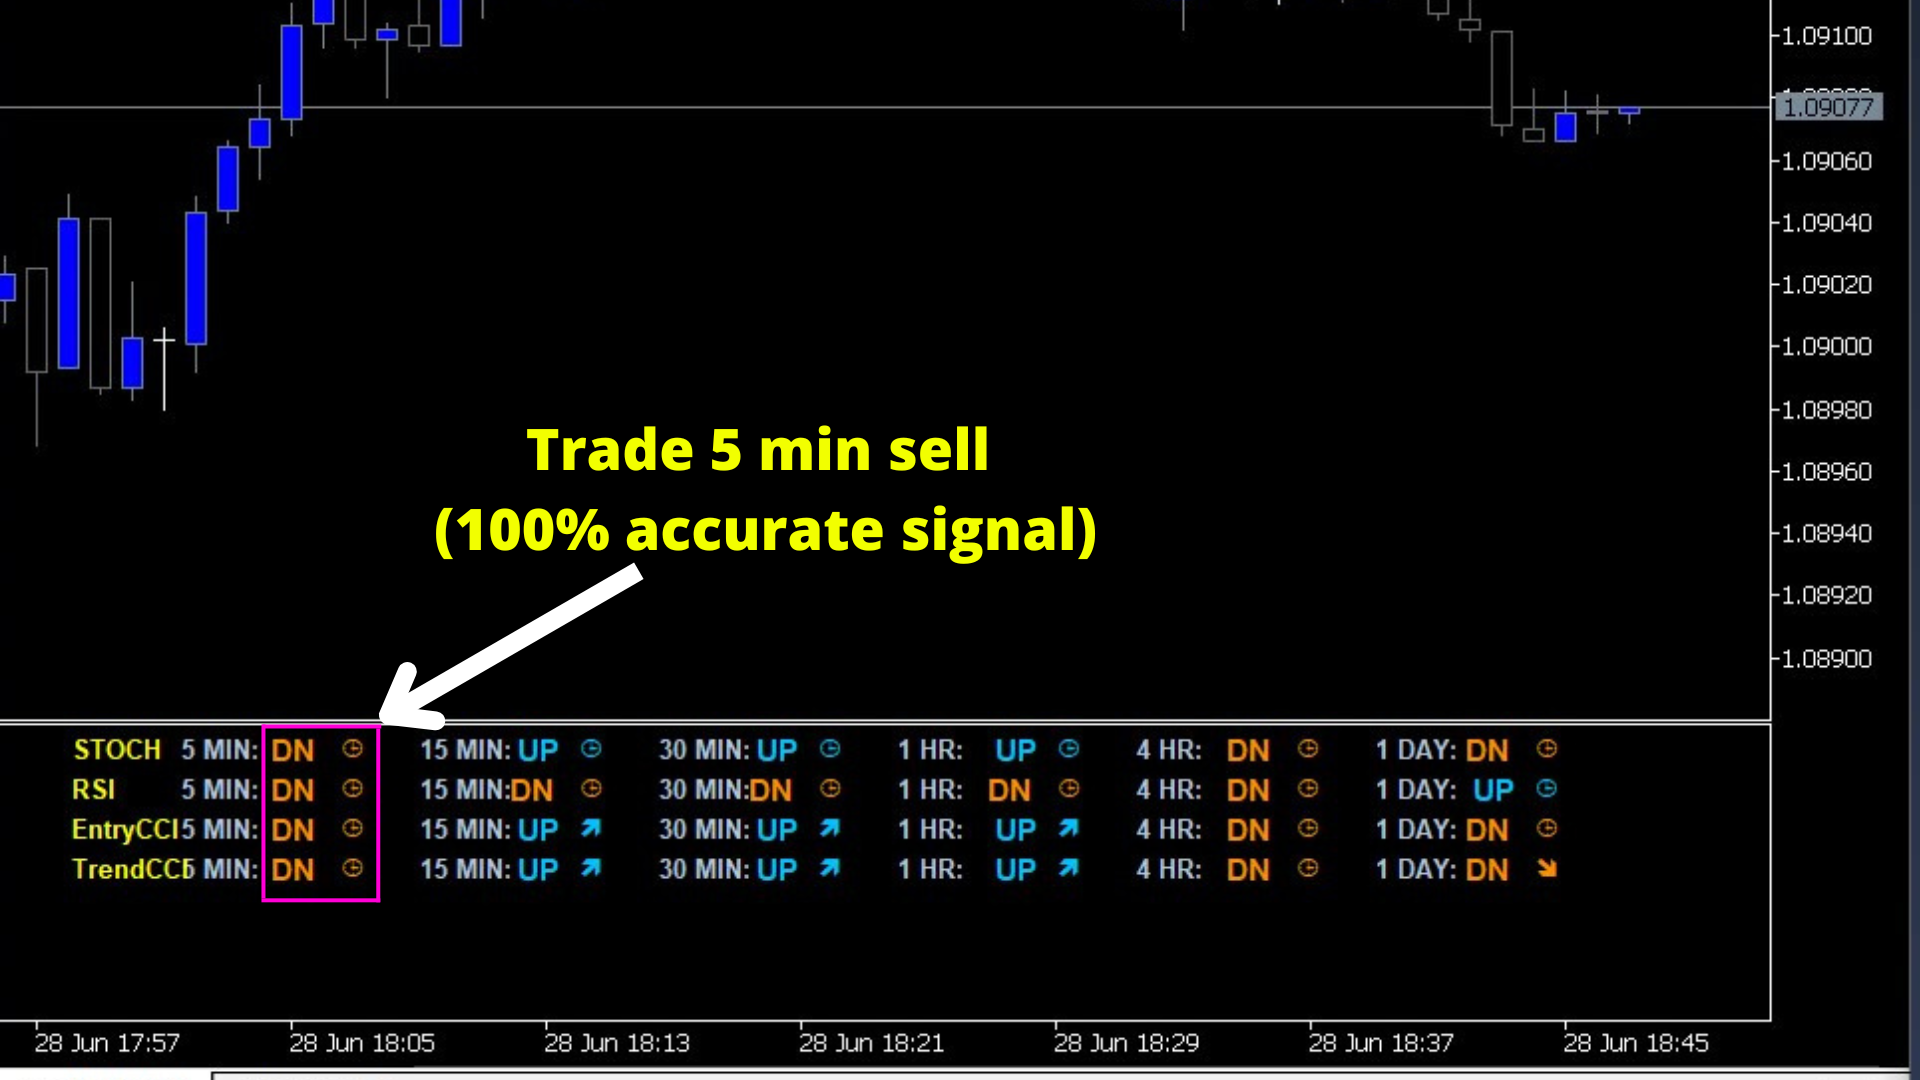
혁신적인 MT5 지표 '트래픽 신호'를 소개합니다 - 성공적인 트레이딩 세계로의 문을 열어드립니다! 정확성과 전문지식을 바탕으로 설계된 이 혁신적인 지표는 RSI, 스토캐스틱, CCI 및 모든 시간프레임의 트렌드 분석에 기반한 특별한 전략으로 가장 정확한 진입 신호를 생성합니다. 트래픽 신호는 무적의 자신감으로 시장을 탐색할 수 있도록 최상의 정확성을 제공합니다.

트래픽 신호를 통해 가장 수익성 높은 트레이딩 기회를 감지하기 위해 정밀하게 조정된 주요 기술적 지표의 철저한 분석에 접근할 수 있습니다. 불확실성에 작별을 고하고 정보 기반의 의사 결정의 새로운 시대를 맞이하세요. RSI, 스토캐스틱, CCI 및 트렌드의 잠재력을 트래픽 신호 내에서 완벽하게 융합하여 전례없는 시장의 역학을 생생하게 그려냅니다.

트래픽 신호를 통해 시장의 트렌드와 패턴을 쉽게 탐색하면서 모든 시간프레임을 주시할 수 있습니다. 단기적인 고조 또는 장기적인 전략적 플레이를 선호하든지, 이 뛰어난 지표는 여러분의 트레이딩 스타일을 수용하며 시장의 흐름과 변동을 종합적으로 파악할 수 있습니다.

트래픽 신호의 정확성은 여러분의 성공의 기반이 됩니다. 철저한 연구와 개발을 바탕으로 이 지표는 섬세하게 조정된 정확한 타이밍의 신호를 제공합니다. 잘못된 긍정적 신호에 작별을 고하고 신뢰성의 새로운 수준을 환영하세요. 마치 믿을 수 있는 동반자가 여러분 곁에 있어 확실한 수익 기회로 안내해주는 것과 같습니다.

직관적인 인터페이스와 이해하기 쉬운 신호로 여러분은 자신감 있게 트레이딩의 즐거움을 경험할 수 있습니다. 경험풍부한 트레이더이든 처음 시작하는 중이든, 이 탁월한 지표는 시장의 복잡성을 단순화하여 모든 수준의 트레이더에게 접근 가능하게 만들어줍니다. 여러분의 배경이나 경험에 상관없이 트래픽 신호는 여러분에게 공정한 성공 기회를 제공합니다.

이 기회를 놓치지 마세요. Traffic Signal로 성공적인 트레이딩의 미래를 향해 나아가세요! 고급 분석, 종합적인 지표, 그리고 비할 데 없는 정확성을 결합한 MT5 지표인 Traffic Signal로 트레이딩 결과의 변화를 목격하세요. 이 필수적인 도구로 트레이딩의 성공 파도를 타고 올라가십시오. 여러분은 트레이딩 게임을 새로운 높이로 끌어올릴 준비가 되어 있나요? Traffic Signal 지표가 여러분의 성공을 안내해 드립니다.


추천 제품
WhaleFinder MT5
Kazuya Yamaoka
Considering the main theories of Forex (Dow Theory, support lines, chart patterns, and Fibonacci retracements), It tells you the price range where whales (large investors) are likely to appear. You can trade at the price points that professionals also aim for. You no longer have to warry about where to aim next. We are live-streaming the actual operation of the system. Please check for yourself if it is usable. Please check it out for yourself. https://www.youtube.com/@ganesha_forex We do not
Glider
Vitalii Zakharuk
The Glider indicator gives accurate and timely signals to enter and exit the transaction that appear on the current candle. Using the indicator is very simple. When a dot and a blue line appear, open a buy deal. When a dot and a red line appear, open a sell deal. The main purpose of this indicator is to determine the moments of entry and exit from transactions, therefore the Glider indicator will display only the trend line and entry points, i.e. displays displays the entry points to the marke
RoboTick Signal
Mahir Okan Ortakoy
Hello, In this indicator, I started with a simple moving average crossover algorithm. However, in order ot get more succesfull results, I created different scenarios by basin the intersections and aptimized values of the moving averages on opening, closing, high and low values. I am presenting you with the most stable version of the moving averages that you have probably seen in any environment. We added a bit of volume into it. In my opinion, adding the Bollinger Band indicator from the ready-
CISD Levels Pro automatically draws CISD Buy and Sell levels directly on your chart. It highlights pending levels while they are forming, then marks confirmed levels after the confirmation candle closes. Optional confirmation arrows help you spot the signal quickly. This tool is designed for traders who want clean, simple CISD level visualization without extra indicators or clutter. Key Features Draws Bullish (BUY) CISD levels and Bearish (SELL) CISD levels Shows Pending levels (dashed) and
CChart
Rong Bin Su
Overview In the fast-paced world of forex and financial markets, quick reactions and precise decision-making are crucial. However, the standard MetaTrader 5 terminal only supports a minimum of 1-minute charts, limiting traders' sensitivity to market fluctuations. To address this issue, we introduce the Second-Level Chart Candlestick Indicator , allowing you to effortlessly view and analyze market dynamics from 1 second to 30 seconds on a sub-chart. Key Features Support for Multiple Second-Level
Quantumcoremt5
Dayanand Pandey
*Quantum Core MT5 - AI-Powered Swing Trading EA for XAUUSD (Gold)**   **PROFESSIONAL | SAFE | LOW-FREQUENCY**   A premium swing trading advisor delivering **15-30 high-quality trades/month** with advanced risk management.   **KEY FEATURES:**   **AI-Enhanced Strategy**: Combines MQL5 algorithms with AI-driven market analysis for precise entries/exits.   **Compounding & Auto-Lot Sizing**: Automatically adjusts position sizes based on equity growth (user-configurable).   **Flexible Risk Co
Introduction to Fractal Pattern Scanner Fractal Indicator refers to the technical indicator that makes use of the fractal geometry found in the financial market. Fractal Pattern Scanner is the advanced Fractal Indicator that brings the latest trading technology after the extensive research and development work in the fractal geometry in the financial market. The most important feature in Fractal Pattern Scanner is the ability to measure the turning point probability as well as the trend probabil
"수동 채널 그리기? 더 이상은 아닙니다. 시장 구조가 자동으로 드러나게 하세요." "장기 가격대를 연중무휴 24시간 실시간으로 추적하세요." 실제 트레이더의 고충 피벗 포인트를 수동으로 식별하려면   시간과 노력이 많이 듭니다 . 적응하기 어려움   높은 변동성   및 정확한   신뢰할 수 있는 채널 아이디어 복사 "시장은 잠들지 않습니다. 왜 분석을 멈춰야 할까요?" "하루에 수십 개의 자산을 어떻게 관리하고 계신가요?" 핵심 주장 오토채널   시장 구조를 자동으로 읽어 수작업을 줄여줍니다. "기계의 정밀성과 인간의 직관으로 분석" 기술 분석 주요 기능 설명 자동 피벗 감지 지그재그 기반 실시간 분석 멀티 타임프레임 분석 강력한 신호를 위해 더 높은 시간대를 활용 채널 채점 시스템 볼륨, 각도, 길이, 중요도 등을 평가합니다. 유사성 필터링 깔끔한 UI를 위해 중복 채널 제거 동적 지그재그 감도 시장 범위 및 기간에 맞게 조정 시각적 하이라이트 중요도에
Liquidity Map
Alex Amuyunzu Raymond
Liquidity Map  Overview The Liquidity Map indicator is an advanced visualization tool based on ICT Smart Money Concepts . It automatically identifies daily Buy Zones , Sell Zones , and Liquidity Levels , showing where price is likely to reverse or continue based on institutional order flow. It calculates key levels from the daily session — such as the previous day’s high, low, and midpoint — then derives a premium (sell bias) and discount (buy bias) structure. When price trades into these mapped
# SSL ST Strategy MT5 Indicator - Korean Version SSL ST Strategy MT5 지표는 거래자가 거래 차트에서 매수 및 매도 신호를 명확하게 식별하도록 도와주기 위해 설계된 기술 분석 도구입니다. 선과 화살표 같은 시각적 지표, 음성, 팝업 및 푸시 알림을 제공하여 거래 기회가 발생할 때 거래자에게 즉시 알립니다. ## 주요 장점 - 색상이 지정된 선(SSL1 및 기준선)과 매수(녹색 삼각형) 및 매도(빨간색 삼각형) 신호를 위한 화살표를 사용하여 차트에서 직접 명확한 시각 신호를 제공합니다. - 음성 알림, 팝업 알림 및 모바일 푸시 알림을 지원하여 거래자가 화면에서 멀리 있어도 중요한 신호를 놓치지 않도록 합니다. - 신호 로직 반전을 허용하여 다양한 거래 전략이나 시장 조건에 적응할 수 있습니다. - 고가, 저가 및 종가를 기반으로 한 지수 이동 평균(EMA)을 사용하여 보다 반응성 높고 부드러운 신호 생성을 제공합니다. - 동
Manyal trading system, CovEchoTrend Robot, focuses on reliability and flexibility. By employing statistical analysis methods to study the relationships between the base indicator and market patterns, the system enables a deeper understanding of market processes. Intelligent pattern analysis: The application of statistical data processing helps identify key trend reversal points more accurately, signaling significant market shifts. Informed decision-making is based on the intersection of indicato
Unlock Market Insights: Dynamic Trend Analysis with Statistical Precision for MT5 Are you seeking a deeper understanding of market movements? Many traditional tools may not fully capture the complex, non-linear dynamics often seen in financial markets. This can sometimes lead to uncertainty in identifying subtle trend shifts. Introducing Adaptive PolyBands Optimizer – an advanced MQL5 indicator designed to enhance your market analysis. Unlike some conventional tools, Adaptive PolyBands Optimizer
Linear Trend Predictor - 진입 지점과 방향성 지원선을 결합한 추세 지표입니다. 고가/저가 채널을 돌파하는 원칙에 따라 작동합니다. 지표 알고리즘은 시장 노이즈를 걸러내고 변동성과 시장 역학을 고려합니다. 표시기 기능  평활화 방법을 사용하여 시장 추세와 BUY 또는 SELL 주문을 시작하기 위한 진입 시점을 보여줍니다.  모든 기간의 차트를 분석하여 단기 및 장기 시장 움직임을 파악하는 데 적합합니다.  어떠한 시장과 시간대에도 적용할 수 있으며, 입력 매개변수를 통해 거래자는 자신에게 맞게 지표를 독립적으로 사용자 지정할 수 있습니다.  설정된 지표 신호는 사라지거나 다시 그려지지 않습니다. 이는 캔들 마감 시 결정됩니다.  여러 유형의 알림이 화살표와 결합되어 있습니다.  이 지표는 독립적인 거래 시스템으로 사용할 수도 있고, 다른 거래 시스템에 추가하는 용도로도 사용할 수 있습니다.  모든 수준의 경험을 가진 거래자가 사용할 수 있습니다. 주요 매
Connix MT5
Garry James Goodchild
Connix Smart Trading – MT5 Multi-Currency Smart Money & ICT Scanner Connix Smart Trading is a multi-currency, multi-timeframe dashboard for MT5 designed for traders using Smart Money Concepts (SMC) and ICT-style methodologies . It allows you to scan up to 28 symbols simultaneously (anything in Market Watch) and view market structure, order blocks, fair value gaps, VWAP bias, and range data across multiple timeframes from one central dashboard. The number of symbols and all timeframes are fully c
Volatility zone
Slobodan Manovski
ATR Volatility Zones Indicator Multi-Level Volatility Measurement Tool with Visual Alerts This advanced indicator analyzes market volatility using Average True Range (ATR) to identify five distinct volatility zones, helping traders adapt their strategies to current market conditions. Key Features: 5-Zone Volatility Classification - Precisely identifies: • LOW (Cyan) • MEDIUM-LOW (Lime Green) • MEDIUM (Yellow) • HIGH-MEDIUM (Orange) • HIGH (Red) Smart Dynamic Ranges - Automatically adjust
ABC Indicator
Denys Babiak
The ABC Indicator analyzes the market through waves, impulses, and trends, helping identify key reversal and trend-change points. It automatically detects waves A, B, and C, along with stop-loss and take-profit levels. A reliable tool to enhance the accuracy and efficiency of your trading. This product is also available for MetaTrader 4 =>  https://www.mql5.com/en/market/product/128179 Key Features of the Indicator: 1. Wave and Trend Identification:    - Automatic detection of waves based on mov
이 지표는 실제 거래에 완벽한 자동 파동 분석 지표입니다! 사례... 참고:   웨이브 그레이딩에 서양식 이름을 사용하는 데 익숙하지 않습니다. Tang Lun(Tang Zhong Shuo Zen)의 명명 규칙의 영향으로 기본 웨이브를   펜   으로 명명하고 2차 웨이브 밴드를   세그먼트   로 명명했습니다. 동시에, 세그먼트에는 추세 방향이 있습니다.   주요 추세 세그먼트에는   이름이 지정되지만(이 이름 지정 방법은 향후 노트에서 사용됩니다. 먼저 말씀드리겠습니다.) 알고리즘은 굴곡 이론과 거의 관련이 없으므로 그렇게 해서는 안 됩니다. 이는 나의 시장 분석을   통해 요약된 끊임없이 변화하고 복잡한 운영 규칙을   반영합니다. 밴드는 더 이상 사람마다 다르지 않도록 표준화되고 정의되었습니다. 인위적인 간섭의 드로잉 방법은 시장 진입을 엄격하게 분석하는 데 핵심적인 역할을 합니다. 이 지표를 사용하는 것은 거래 인터페이스의 미학을 개선하고 원래의 K-line 거래를
VWAP indicator for MT5
Renaud Herve Francois Candel
Moving VWAP Indicator Moving VWAP is an important indicator drawing the Volume-Weighted Average Price (VWAP). The VWAP is a reference used by institutional traders and acts as a level of support / resistance. If price is above VWAP then means market is bullish. If price is below VWAP then means market is bearish. It can be used to enter in the market with low risk (near VWAP) and also identify the correct direction of the market. The Moving VWAP is as simple as a Simple Moving Average. The m
CSI Pro - Confluence Signal Intelligence A professional-grade trading signal system for MetaTrader 5 that analyzes market conditions across multiple dimensions to identify high-probability trade setups. CSI Pro cuts through market noise by requiring agreement among diverse analytical methods before generating a signal. Works Best With Our Complete Suite CSI Pro is designed to work alongside our companion indicators CSI Pro CEI (Cycle Exhaustion Index) and CSI Pro PRG (Probability Reversal Gauge
Frontier Pivots
Nestor Jose Mendez Boza
FRONTIER PIVOTS - Geometric Levels Indicator This indicator plots support and resistance levels/ranges on the chart using mathematical calculations. It helps traders identify potential price reaction zones based on geometric patterns. Main Features: Automatically calculates and displays key price levels Plots both support and resistance lines Uses daily price data for level calculation Clean visual presentation with different colors for different level types No repainting - levels remain static
Alphabet AI MT5
Sergei Pomytkin
3.43 (7)
알파벳 AI는 평균 회귀 전략을 기반으로 하는 어드바이저입니다. 즉, 시장의 자연스러운 특성인 큰 변동 후 평균값으로 회귀하는 특성을 활용합니다. 이 알고리즘은 자산의 현재 가격을 지속적으로 분석하여 계산된 평균값과 비교합니다. 가격이 평균값에서 크게 벗어나면 어드바이저는 이를 행동 신호로 해석합니다. 상한선을 초과하면 가격 하락을 예상하여 숏 포지션을, 하한선 아래로 떨어지면 가격 상승을 예상하여 롱 포지션을 취합니다. 저희 어드바이저의 특징은 채널 경계를 파악하고 잘못된 신호를 걸러내는 적응형 접근 방식으로, 중간 정도의 추세에서도 효과적으로 작동한다는 것입니다. 특히 가격 채널 내에서 급격한 변동을 보이는 통화쌍에서 탁월한 성과를 보입니다. Advisor는 20년 넘게 데이터 테스트를 거쳤으며 그 기간 동안 가장 불안정한 기간도 견딜 수 있습니다. 컴퓨터를 연중무휴 24시간 실행할 수 없다면 VPS 서버 서비스를 이용하는 것이 좋습니다. 고문은 12개월 이상 낮은 손실률로 안
TrendFlow Tracker
David Macharia Kamau
TrendCatcherBot: Find Your Edge in the Market Don't guess the trend—catch it. The TrendCatcherBot is an Expert Advisor designed for MetaTrader 5 that simplifies your trading strategy. By leveraging the power of moving average crossovers, this bot provides clear, visual signals directly on your chart, so you always know when to act. Watch for the unmistakable green, red, and black dots in the corner of your screen to instantly see if the market is signaling a buy, sell, or hold. It's the perfect
Introduction This indicator detects volume spread patterns for buy and sell opportunity. The patterns include demand and supply patterns. You might use each pattern for trading. However, these patterns are best used to detect the demand zone (=accumulation area) and supply zone (=distribution area). Demand pattern indicates generally potential buying opportunity. Supply pattern indicates generally potential selling opportunity. These are the underlying patterns rather than direct price action. T
"MACD 리본 다이내믹 PRO: 변동성을 추세로 전환하세요" 간략 설명: "단 하나의 선에만 의존하지 마세요. 시장의 깊이를 파악하세요. 스프레드 오류 없이 비트코인, 금, 외환에 최적화된 차세대 추세 추종 도구입니다." 제품 상세 정보: MACD 리본 다이내믹을 선택해야 하는 이유? 기존 지표는 비트코인이나 금처럼 변동성이 높은 자산에서 잘못된 신호를 생성할 수 있습니다. MACD 리본 다이내믹은 다층 알고리즘을 사용하여 시장의 노이즈를 걸러냅니다. 주요 기능: 다층 분석: 단일 신호 대신 50개 이상의 동적 분석선을 통해 추세의 진정한 강도를 확인하세요. 암호화폐 친화성(고가 수정): $100,000 수준의 BTCUSD와 같은 자산에서도 수학적 오류 없이 작동하는 특수 알고리즘입니다. 스프레드 없음 기술: 종가에 초점을 맞춘 깔끔한 계산 방식으로 스프레드 확대에 영향을 받지 않습니다. 추세의 힘: 밴드가 넓어질 때 추세에 진입하고, 밴드가 좁아질 때
TMA Centered Bands Indicator
Irina Cherkashina
5 (1)
The TMA Centered Bands Indicator for MT5 draws bands on the chart and shows the overall price trend. It displays three bands - the lower and upper boundaries of the channel and the median.   The bands are made up of moving averages, and each of them has an MA period. The name TMA comes from triangular moving averages, as the indicator draws triangular bands.   The price will fluctuate between these ranges whenever the trend changes direction, thus creating entry and exit points.   How to trade
FREE
This indicator is based on a mathematical formula which gives you the possibility to seek and find the right frequency of the movement, and to determine its key level; just adjust the frequency parameter! Simple and highly effective; using this indicator you can easily predict the next support and  resistance    levels of the day. Also, this indicator determines the range and the next two importants levels of the movement outside this range so far. SGFL3 and RGFL3  are levels with high certainty
Aureus Quantum Surge-H1의 금 자동 거래 잠재력 확보 특별 할인: 현재 가격 $799 (한정 할인)!다음 가격: 899달러 실제 계정 신호 주소: https://www.mql5.com/en/signals/2297864?source=Site+ 소개 + 판매자 Aureus Quantum Surge-H1은 H1 타임프레임 내에서 XAUUSD(금)를 거래하도록 설계된 첨단 전문가 컨설턴트(EA)입니다.다양한 기술 지표와 안정적인 위험 관리 전략을 결합하여 불안정한 금 시장에서 지속적인 성과를 제공합니다. EA 정보: Aureus Quantum Surge-H1은 2003년부터 2018년까지 4~6개의 최적화 단계의 점진적 순방향 최적화 방법을 사용하여 엄격하게 개발되고 최적화되었습니다.이 방법은 뛰어난 노봉성을 확보하고 과도한 최적화를 피하며 실제 거래 환경에서 매우 신뢰할 수 있도록 한다.또한 2020 년까지 EA는 실시간으로 사용되어 왔으며 테스트 결과
Candlestick Patterns Scanner MT5
KEENBASE SOFTWARE SOLUTIONS
KT Candlestick Patterns Scanner is a Multi-Symbol and Multi-Timeframe scanner that fetches and shows various candlestick patterns on 28 currency pairs and 9 time-frames concurrently . The scanner finds the candlestick patterns by loading the KT Candlestick Patterns indicator as a resource in the background. Features The scanner can find the candlestick patterns on 252* combinations of symbols and time-frames from a single chart. Open the signal's chart loaded with a predefined template with a s
Xtrade Trend Detector
Dago Elkana Samuel Dadie
Xtrade Trend Detector is an indicator capable of finding the best opportunities to take a position in any stock market. Indeed, it is a great tool for scalpers but also for Daytraders. You could therefore use it to identify areas to trade, it fits easily on a chart. I use it to detect trends on Big timeframes and take positions on Small timeframes. Don't hesitate to give me a feedback if you test it.
Adaptive SR Zones Breakout
Alex Amuyunzu Raymond
Adaptive SR Zones – Breakout Edition Adaptive SR Zones is a next-generation MetaTrader 5 indicator that automatically maps support and resistance zones and tracks breakout activity in real time. Designed for traders who rely on market structure and zone confluence, it combines multi-timeframe analysis , breakout confirmation logic , and customizable alerts into one powerful tool. No repainting. Core Features Dynamic Support & Resistance Mapping Detects zones from swing highs/lows and reaction po
이 제품의 구매자들이 또한 구매함
무료 AUX 인디케이터와 EA 지원을 받으세요 직접 다운로드 — 여기를 클릭 [ D.I.C.E ] The DICE Indicator  Divergence in Chaos Environment는 엘리엇 파동 이론과 트레이딩 카오스 기법을 함께 사용하는 트레이더를 위해 설계된 MT5 전문 도구입니다. 가격 움직임의 숨겨진 및 일반 다이버전스를 감지하며, 빌 윌리엄스가 설명한 혼돈 시장 환경과 동기화됩니다. 주요 특징 엘리엇 파동 정렬 다이버전스: 파동 구조에 조화된 강세 및 약세 다이버전스를 탐지하여 파동 카운팅 정확도를 높입니다. 카오스 기법 통합: AO(오썸 오실레이터) 및 시장 구조 원칙과 일치하도록 설계되었습니다. 다중 타임프레임 스캐닝: 다양한 시간 프레임에서 다이버전스를 분석하여 모멘텀 변화와 추세 소진을 확인합니다. 시각적 알림 및 객체: 명확한 화살표, 선, 표시로 빠른 인식 가능. 적응형 시장 판독: 혼돈 시장 조건에 자동으로 조정되어 노이즈를 필터링하고 유효한 셋업만
ARIPoint
Temirlan Kdyrkhan
1 (1)
ARIPoint is a powerful trading companion designed to generate high-probability entry signals with dynamic TP/SL/DP levels based on volatility. Built-in performance tracking shows win/loss stats, PP1/PP2 hits, and success rates all updated live. Key Features: Buy/Sell signals with adaptive volatility bands Real-time TP/SL/DP levels based on ATR Built-in MA Filter with optional ATR/StdDev volatility Performance stats panel (Success, Profit/Loss, PP1/PP2) Alerts via popup, sound, push, or email Cu
Rtc ML Ai Predictor
Muhammad Faisal Sagala
Rtc ML Ai | Predictor CORE MACHINE LEARNING ENGINE Adaptive ML Market Predictor – Multi-Bar Trend & Candle Forecast What This Indicator Does This indicator is a  real-time market prediction engine  designed to analyze price behavior and estimate  future market tendencies . Unlike conventional indicators, this system  does not rely on static parameters or historical curve-fitting , but adapts its internal state dynamically during live market operation. Instead of using static rules, the indic
Meravith MT5
Ivan Stefanov
이 인디케이터는 임의의 지점에서 거래량을 분석하고 해당 거래량의 시장 소진(exhaustion) 수준을 계산합니다. Meravith 주요 라인: 강세 거래량 소진선 – 목표로 사용됩니다. 약세 거래량 소진선 – 목표로 사용됩니다. 추세선 – 시장 추세를 나타냅니다. 시장이 강세인지 약세인지에 따라 색상이 변경되며, 추세 지지선 역할을 합니다. 사용 방법: 보라색 세로선을 더블 클릭한 후 원하는 위치로 이동시키십시오. 추세와 조정을 포함해 무엇이든 분석할 수 있습니다. 인디케이터를 시장의 상단, 하단 또는 중요하다고 생각되는 임의의 지점으로 이동시킬 수 있습니다. 좋은 방법은 시장이 소진선 사이에 머물도록 Meravith를 설정하는 것입니다. 이렇게 하면 추적할 수 있는 명확한 목표를 갖게 됩니다. 초기 소진선이 돌파되면 새로운 소진선이 나타나며, 추가로 거래 가능한 채널이 형성됩니다. 소진 수준에 도달하면 인디케이터의 위치를 다시 조정하거나 다른 시간 프레임으로 전환하여 새로운 소진
Max Ribbon Mt5
Stefano Frisetti
WARNING: This indicator is distributed EXCLUSIVELY on MQL5.com MT4 version:   https://www.mql5.com/it/market/product/160363 MT5 version:   https://www.mql5.com/it/market/product/160410 ============================================================================================= MAX RIBBON ver 1.00 The indicator that shows you the TREND clearly and unambiguously! ============================================================================================= DESCRIPTION MAX RIBBON is an advanced tre
TrendMaestro5
Stefano Frisetti
note: this indicator is for METATRADER4, if you want the version for METATRADER5 this is the link:  https://www.mql5.com/it/market/product/108106 TRENDMAESTRO ver 2.5 TRENDMAESTRO recognizes a new TREND from the start, he never makes mistakes. The certainty of identifying a new TREND is priceless. DESCRIPTION TRENDMAESTRO identifies a new TREND in the bud, this indicator examines the volatility, volumes and momentum to identify the moment in which there is an explosion of one or more of these da
Pantera Indicator
Temirlan Kdyrkhan
5 (1)
A tool for on-chart strategy backtesting and performance analysis. A utility for developing, debugging, and testing custom trading ideas and indicator functions. An indicator designed to quickly test trading concepts and visualize the effectiveness of different input parameters. An all-in-one sandbox for testing everything from simple crossovers to complex, multi-condition trading systems.
+++++++++++++++++++++++++++++++++++++++++++++++++++++++++++++++++++++++++++++++++++++++++++++++++ +++ Link to EURUSD Only Free Version -->  https://www.mql5.com/en/market/product/156904?source=Unknown +++++++++++++++++++++++++++++++++++++++++++++++++++++++++++++++++++++++++++++++++++++++++++++++++ Hallo Trader, This is a traditional GANN & FIBONACCI strategy based on detection of an impulsive move in the opposite direction. This is called a Breakout. At the moment of Breakout, the indicator draw
MATADOR GOLD – XAUUSD MT5 M5 Timeframe Scalp Signals MATADOR GOLD is a professional signal indicator designed for XAUUSD (Gold) scalping on the M5 timeframe , with optional higher-timeframe confirmation. This indicator does not open or manage trades automatically . It provides structured buy and sell signals, intelligent filtering, and alerts, allowing traders to execute trades using their own strategy and risk management rules. Core Concept (Multi-Concept Architecture) MATADOR GOLD is built
FXLAND Smart Reversal Indicator (MT5) FXLAND Smart Reversal Indicator is a professional technical analysis tool designed to help traders identify potential price reversal zones and key market turning points with clarity and precision. The best reversal indicator and price return by choosing only one ceiling or floor in each time frame A masterpiece of combining mathematics and Gann, fractal matrix, Fibonacci, movement angle and time. Completely intelligent Key Features Detects potenti
VTrende Pro
Andrii Diachenko
5 (1)
VTrende Pro - MTF indicator for trend trading with a display panel for MT5 *** Videos can be translated into any language using subtitles (video language - Russian) Although the signals of the VTrende Pro indicator can be used as signals of a full-fledged trading system, it is recommended to use them in conjunction with the Bill Williams TS. VTrende Pro is an extended version of the VTrende indicator. Difference between Pro version and VTrende: - Time zones - Signal V - signal 1-2 waves -    S
Hello I Want to introduce The Forex Buy Sell Arrow Premium MT5 i recently release this premium indicator! its 1000% Non Repaint Indicator, It Work Perfectly Well,, i tested it day by day, Just mind blowing Result,  Including Powerful trend Algorithm! How It Work? well, it work market trend formula, when trend Bullish Or when trend Bearish,  Recommend Timeframe M30, H1 it work all timeframe, and all currency pair, 100% non repaint, How to take signal From Forex Buy Sell Arrow Premium Ind
WanaScalper
Isaac Wanasolo
1 (1)
A scalping indicator based on mathematical patterns, which on average gives signals with relatively small SL, and also occasionally helps to catch big moves in the markets (more information in the video) This indicator has three main types of notifications: The first type warns of a possible/upcoming signal on the next bar The second type indicates the presence of a ready signal to enter the market/open a position The third type is for SL and TP levels - you will be notified every time price re
##   ONLY GOLD ##   Тiльки Золото ## **Mercaria Professional Trading Zones - Complete Guide** ## **Mercaria Professional Trading Zones - Повний посібник** ### **How Mercaria Zones Work / Як працюють зони Mercaria** **English:** Mercaria Zones is an advanced trading indicator that identifies high-probability support and resistance areas using ZigZag extremes combined with mathematical zone calculations. The indicator works on multiple timeframes simultaneously, providing a comprehensive view
Scalping Winning Signals Pro SWS
Muhammad Usman Siddique
5 (1)
UZFX SWS {스캘핑 승리 신호} 프로 v1.0은 빠르게 움직이는 시장에서 정확한 진입 신호를 찾는 스캘퍼, 데이 트레이더, 스윙 트레이더를 위해 Usman Zabir(UZFX LABS)가 특별히 개발한 강력하고 재도색되지 않는 지표입니다. 지연이나 잘못된 재도색 없이 신뢰할 수 있는 실시간 신호를 요구하는 트레이더에게 이상적입니다. 추천* 최적 시간대: 30분 이상. {1시간}이 가장 선호하며, 결과는 놀라울 정도입니다...! 주요 기능: 최근 및 과거 신호를 명확한 시각적 화살표로 표시(오래된 신호는 점으로 표시 옵션 포함). 자동 계산 및 그리기 기능: 진입선, 손절선(최근 스윙 저점/고점 기준), 다중 이익실현선(RRR 1:1, 2:1, 3.5:1 – 완전 커스터마이징 가능). 최신 신호 세부사항, 진입가, 손절선, 이익실현선을 표시하는 차트 내 정보 패널. 종합 알림: 팝업, 소리, 푸시 알림, 이메일. 차트 커스터마이징 옵션(색상, 배경, 캔들 스타일). 안전한
Enigma 112
issam rahhal sabour
Enigma 112 Indicator - User Manual Enigma 112 Indicator Complete User Manual - Ultimate Trading Solution Introduction The Enigma 112 is a comprehensive multi-timeframe trading indicator that combines advanced technical analysis concepts including Tesla 3-6-9 Gates, Huddleston Theory, PO3 Dealing Ranges, and sophisticated risk management systems. Tesla 3-6-9 Gates Based on Nikola Tesla's vortex mathematics for precise support and resistance levels Huddleston Theory Volume-based market
Pan PrizMA CD Phase
Aleksey Panfilov
The Expert Advisor and the video are attached in the Discussion tab . The robot applies only one order and strictly follows the signals to evaluate the indicator efficiency. Pan PrizMA CD Phase is an option based on the Pan PrizMA indicator. Details (in Russian). Averaging by a quadric-quartic polynomial increases the smoothness of lines, adds momentum and rhythm. Extrapolation by the sinusoid function near a constant allows adjusting the delay or lead of signals. The value of the phase - wave s
Классификатор силы тренда. Показания на истории не меняет. Изменяется классификация только незакрытого бара. По идее подобен полной системе ASCTrend, сигнальный модуль которой, точнее его аппроксимация в несколько "урезанном" виде, есть в свободном доступе, а также в терминале как сигнальный индикатор SilverTrend . Точной копией системы ASCTrend не является. Работает на всех инструментах и всех временных диапазонах. Индикатор использует несколько некоррелируемых между собой алгоритмов для класси
FFx Universal Strength Meter PRO is more than a basic strength meter. Instead of limiting the calculation to price, it can be based on any of the 19 integrated strength modes + 9 timeframes. With the FFx USM, you are able to define any period for any combination of timeframes. For example, you can set the dashboard for the last 10 candles for M15-H1-H4… Full flexibility! Very easy to interpret... It gives a great idea about which currency is weak and which is strong, so you can find the best pai
The FFx Universal MTF alerter shows on a single chart all the timeframes (M1 to Monthly) with their own status for the chosen indicator. 9 indicators mode (MACD-RSI-Stochastic-MA-ADX-Ichimoku-Candles-CCI-PSAR). Each can be applied multiple times on the same chart with different settings. Very easy to interpret. Confirm your BUY entries when most of the timeframes are showing green color. And confirm your SELL entries when most of the timeframes are showing red color. 2 Alert Options : input to s
FFx Watcher Pro MT5
Eric Venturi-Bloxs
The FFx Watcher PRO is a dashboard displaying on a single chart the current direction of up to 15 standard indicators and up to 21 timeframes. It has 2 different modes: Watcher mode: Multi Indicators User is able to select up to 15 indicators to be displayed User is able to select up to 21 timeframes to be displayed Watcher mode: Multi Pairs User is able to select any number of pairs/symbols User is able to select up to 21 timeframes to be displayed This mode uses one of the standard indicators
FFx Patterns Alerter gives trade suggestions with Entry, Target 1, Target 2 and StopLoss .... for any of the selected patterns (PinBar, Engulfing, InsideBar, OutsideBar) Below are the different options available: Multiple instances can be applied on the same chart to monitor different patterns Entry suggestion - pips to be added over the break for the entry 3 different options to calculate the SL - by pips, by ATR multiplier or at the pattern High/Low 3 different options to calculate the 2 TPs -
FFx Basket Scanner MT5
Eric Venturi-Bloxs
MetaTrader 4 version available here : https://www.mql5.com/en/market/product/24881 FFx Basket Scanner is a global tool scanning all pairs and all timeframes over up to five indicators among the 16 available. You will clearly see which currencies to avoid trading and which ones to focus on. Once a currency goes into an extreme zone (e.g. 20/80%), you can trade the whole basket with great confidence. Another way to use it is to look at two currencies (weak vs strong) to find the best single pairs
MetaTrader 4 version available here: https://www.mql5.com/en/market/product/25793 FFx Pivot SR Suite PRO is a complete suite for support and resistance levels. Support and Resistance are the most used levels in all kinds of trading. Can be used to find reversal trend, to set targets and stop, etc. The indicator is fully flexible directly from the chart 4 periods to choose for the calculation: 4Hours, Daily, Weekly and Monthly 4 formulas to choose for the calculation: Classic, Camarilla, Fibonac
Premium level Pro
Dmitriy Kashevich
Premium level is a unique indicator with more than 80% accuracy of correct predictions! This indicator has been tested for more than two months by the best Trading Specialists! The author's indicator you will not find anywhere else! From the screenshots you can see for yourself the accuracy of this tool! 1 is great for trading binary options with an expiration time of 1 candle. 2 works on all currency pairs, stocks, commodities, cryptocurrencies Instructions: As soon as the red arrow app
ClassicSBA
Umri Azkia Zulkarnaen
this indicator very simple and easy if you understand and agree with setup and rule basic teknical sba you can cek in link : please cek my youtube channel for detail chanel : an for detail info  contact me  basicly setup buy (long) for this indicator is Magenta- blue and green candle or magenta - green  and green candlestik and for setup sell (short) is Black - yellow - and red candle or black - red  and red candlestik
Pendiente de Precio
Cesar Juan Flores Navarro
Indicador en base a la pendiente de la linea de precio, dibuja una línea de color cuando sube a base de los precios que previamente has sido procesados o linealizados, y cuando baja la pendiente la linea linealizada toma otro color. En este caso se a considerado 6 lineas de diferentes procesos desde pendientes largas hacia las cortas, observándose que cuando coincidan las pendientes se produce un máximo o mínimo, lo que a simple vista nos permitirá hacer una COMPRA O VENTA.
Индикатор Coefficient Of Determination (COD) представляет собой значение коэффициента детерминации или квадрат коэффициента корреляции между зависимой переменной — ценой и объясняющей переменной — тиковым объемом. Что это дает нам на практике? COD отлично распознает кульминацию трендовых движений, что позволяет подбирать оптимальные точки и ловить развороты рынка. Как использовать индикатор: Наиболее популярная торговая стратегия строится совместно с трендовым индикатором Moving Average (MA), пе
Fibonacci Multiple 12
Cesar Juan Flores Navarro
Fibonacci Múltiple 12, utiliza la serie fibonacci plasmado en el indicador fibonacci, aumentadolo 12 veces según su secuencia. El indicador fibonacci normalmente muestra una vez, el presente indicador se mostrara 12 veces empezando el numero que le indique siguiendo la secuencia. Se puede utilizar para ver la tendencia en periodos cortos y largos, de minutos a meses, solo aumentado el numero MULTIPLICA.
Recommended TimeFrame >= H1. 100% Non Repainted at any moment.  Use it carefully, only with Trend Direction. Trading Usage: 2 Variants: as Range System or as BreakOut System (Both Only With Trend Direction)::: (Always use StopLoss for minimise Risk); [1] as Range System: (Recommended) in UP TREND:  - BUY in Blue Line , then if price goes down by 50 points (on H1) open Second BUY.   Close in any Profit you wish: TrailingStop(45 points) or Close when Price touches upper Gold Line. in DOWN TREND
제작자의 제품 더 보기
Miraculous Indicator – Gann Square of Nine 기반 100% 비리페인트 Forex 및 바이너리 도구 이 영상은 Miraculous Indicator 를 소개합니다. 이 지표는 Forex 및 바이너리 옵션 트레이더를 위해 특별히 개발된 매우 정확하고 강력한 트레이딩 도구입니다. 이 지표가 독특한 이유는 전설적인 **Gann Square of Nine(Gann 9의 사각형)**과 **Gann's Law of Vibration(Gann 진동의 법칙)**에 기반을 두고 있기 때문입니다. 이는 현대 트레이딩에서 가장 정밀한 예측 도구 중 하나로 손꼽힙니다. Miraculous Indicator는 완전히 비리페인트(non-repaint) 됩니다. 즉, 캔들이 마감된 후에도 신호가 변경되거나 사라지지 않습니다. 보이는 것이 곧 결과입니다. 이는 트레이더가 자신감을 가지고 거래에 진입하고 청산할 수 있는 신뢰할 수 있고 일관된 기반을 제공합니다. 주요 특징: Gann
F-16 비행기 지표를 소개합니다. 이것은 귀하의 거래 경험을 혁신하도록 설계된 최첨단 MT4 도구입니다. F-16 전투기의 비할 데 없는 속도와 정밀성에 영감을 받아이 지표는 고급 알고리즘과 최첨단 기술을 결합하여 금융 시장에서 압도적인 성능을 제공합니다. F-16 비행기 지표를 사용하면 실시간 분석을 제공하고 매우 정확한 거래 신호를 생성하여 경쟁을 앞서갈 수 있습니다. 다양한 자산 클래스에서 수익 기회를 식별하는 데 필요한 동적 기능을 갖추고 있어 확신을 가지고 정보에 근거한 결정을 내릴 수 있습니다. 사용자 친화적인 인터페이스로 구성된 F-16 비행기 지표는 인기있는 MetaTrader 4 플랫폼과 완벽하게 통합되어 원활하고 효율적인 거래 과정을 보장합니다. 초보자 트레이더든 경험 많은 전문가든 이 지표를 쉽게 사용자 정의하여 고유한 거래 스타일과 선호도에 맞출 수 있습니다. F-16 비행기 지표의 강력함을 경험해 보세요. 이 지표는 시장 트렌드를 정확하고 민첩하게 탐색하며
Green Frog EA
Ramzi Abuwarda
제목: 최고의 프로페셔널 EA 전문가 - 그린 프로그 EA 외환 거래의 세계에서는 시장이 빠르고 결정적으로 움직이기 때문에 신뢰할 수 있는 동반자가 있으면 큰 차이를 만들 수 있습니다. 그린 프로그 EA를 소개합니다. 최고의 프로페셔널 전문가 어드바이저(EA)로, 뛰어난 정확성과 효율성으로 트레이더들을 지원합니다. 그린 프로그 EA는 최첨단 기술적 발전과 외환 산업에서의 경험을 결합한 결과물입니다. 경험 많은 트레이더들과 소프트웨어 엔지니어들로 구성된 팀에 의해 개발되었으며, 꾸준한 결과를 제공하고 상당한 수익을 창출합니다. 그린 프로그 EA의 차별점은 변화무쌍한 시장 상황에 대응할 수 있는 능력입니다. 정교한 알고리즘과 실시간 데이터 분석을 기반으로, 이 EA는 신속하게 수익성 있는 기회를 식별하고 높은 정밀도로 거래를 실행합니다. EA의 지능적인 트레이딩 전략은 트렌드, 변동성이 큰 시장, 그리고 레인지 시장과 같은 다양한 시장 상황에서도 최적의 성과를 보장합니다. 그린
믿을 수 없는 이진 옵션 지표를 사용하고 실수신호로 인해 손실과 좌절을 겪으신 적이 있으신가요? MT4 거래 플랫폼에서 사용 가능한 최고의 바이너리 옵션 지표, CLOCK INDICATOR를 찾으십시오! 고급 알고리즘과 강력한 기술적 분석 도구를 갖춘 CLOCK INDICATOR는 초보자와 숙련된 트레이더 모두에게 최고의 거래 도구입니다. 시장 트렌드를 정확히 예측하고 수익성 있는 거래 기회를 식별하여 이익을 극대화하고 손실을 최소화하는 데 도움이 됩니다. 다른 복잡하고 사용하기 어려운 이진 옵션 지표와 달리, CLOCK INDICATOR는 설치와 사용자 정의가 쉽습니다. 개별 거래 기호에 맞게 설정을 조정할 수 있으며, 모든 주요 통화 쌍과 시간대에서 원활하게 작동합니다. CLOCK INDICATOR의 뛰어난 특징 중 하나는 다시 그리지 않는 특성입니다. 신호가 생성되면 차트에 남아 있으므로 정확한 정보를 기반으로 한 투자 결정을 내리고 있다는 확신을 가질 수 있습니다.
SCALPER EA를 소개합니다. 급격한 인기를 끌고 있는 혁신적인 전문가 어드바이저(EA)로, 외환 거래 세계를 휩쓸었습니다. 2023년에는 SCALPER EA가 가장 수익성이 뛰어나는 EA로 등장하여, 트레이더들이 외환 시장에 접근하는 방식을 혁신적으로 바꾸었습니다. 단기 시장 변동을 활용하도록 설계된 SCALPER EA는 고급 알고리즘과 첨단 기술을 활용하여 신속한 정확도로 고성과 거래 기회를 식별합니다. 뛰어난 성과로 인해, 경험 많은 트레이더와 큰 수익을 추구하는 초보자들 모두에게 필수 도구로 평가받고 있습니다. 스마트한 자동화를 통해 SCALPER EA는 항상 경쟁자들을 앞섭니다. 변동성이 큰 시장 조건에서도 놀라운 수익을 창출하며, 신속하고 효율적으로 거래를 실행하여 수익 가능성을 최대화합니다. 이익 기회를 놓치지 않도록 해 주어 트레이더들에게 빠르게 변화하는 외환 거래 환경에서 경쟁 우위를 제공합니다. SCALPER EA를 다른 EA와 구별하는 점은 그 적응성입니다.
기적적인 외환 지표 소개: 정확한 트레이딩의 힘을 발휘하세요 모든 시간대에서 뛰어난 결과를 제공하는 최고의 외환 지표를 찾는데 지친 적이 있나요? 더 이상 찾을 필요가 없습니다! 기적적인 외환 지표가 도래하여 귀하의 트레이딩 경험을 혁신하고 수익을 새로운 고도로 끌어올립니다. 최첨단 기술과 수년간의 정성스런 개발을 토대로 기적적인 외환 지표는 외환 시장에서의 힘과 정확성의 정점으로 떠오릅니다. 이 탁월한 도구는 모든 수준의 트레이더의 요구를 충족시키고 지속적인 수익을 추구하는 데에서 비길 데 없는 우위를 제공하기 위해 설계되었습니다. 기적적인 외환 지표의 가장 큰 장점은 그 뛰어난 적응성에 있습니다. 당신이 데이 트레이더, 스윙 트레이더이든 장기 포지션을 선호하든, 이 지표는 모든 시간대에서 뛰어난 결과를 제공하기 위해 최적화되었습니다. 그러나 그 정확성과 시장의 복잡한 움직임을 포착하는 능력이 참으로 빛을 발하는 것은 1시간 기간대에서 사용할 때입니다. 기적적인 외환 지표의 정확성
MT4 "독수리 눈 지표"로 바이너리 옵션 거래의 가능성을 극대화하세요 메타트레이더 4(MT4)용 "독수리 눈 지표"를 활용하여 바이너리 옵션 거래의 혁명적인 세계에 도약해 보세요. 이 혁신적인 도구는 수술적인 정확성과 비교할 수 없는 수익성을 제공하여 거래 경험을 변화시킬 준비가 되어 있습니다. 잠재력의 경계가 깨지고 수익이 극대화되는 세계로 뛰어들어 보세요. 독수리 눈 지표의 뛰어난 정확성과 흔들림 없는 신뢰성 덕분에 시장의 숨겨진 비밀을 해결할 수 있습니다. 세심한 세부 사항에 주의를 기울여 개발된 이 최첨단 지표는 고급 알고리즘, 철저한 기술적 분석, 실시간 시장 데이터를 결합하여 탁월한 거래 이점을 제공합니다. 독수리 눈 지표는 시장의 포인트를 정확하게 파악하여 통찰력 있는 신속한 결정을 돕습니다. 직관적인 인터페이스와 사용하기 쉬운 디자인을 통해 초보 트레이더도 쉽게 바이너리 옵션의 복잡성을 탐색하고 이 도구의 엄청난 힘을 최대한 활용할 수 있습니다. 추측과 감정에 기반한
Swing X Black
Ramzi Abuwarda
SWING X Black은 Binary Options와 Forex 거래를 조화롭게 연결하여 두 시장에서 강력한 통찰력을 활용할 수 있는 유연성을 제공합니다. 이 상호 호환성은 거래자들이 선호하는 거래 스타일에 관계없이 정보에 입각한 결정을 내릴 수 있도록 보장하여 성공의 기회를 높이는 데 도움이 됩니다. SWING X Black의 핵심 강점은 탁월한 신호 생성 기능에 있습니다. 고급 알고리즘을 기반으로 하는 이 지표는 잠재적인 추세 반전, 지지 및 저항 영역, 그리고 돌파구를 정확하게 식별하여 거래자들에게 명확한 진입 및 퇴출 지점을 제공합니다. 이 정밀도는 거래자들이 최소한의 위험으로 수익성 있는 기회를 포착하는 데 큰 도움이 됩니다. 빠르게 변화하는 거래 환경을 잘 이해하여 설계된 SWING X Black은 15분의 타임프레임에서 가장 빛을 발합니다. 이 짧은 시간 동안 거래자들은 시장 움직임을 신속하게 분석하여 시장 조건의 변화에 ​​신속하게 대응할 수 있습니다. 15분의 만기
Market Secret
Ramzi Abuwarda
세계적인 바이너리 옵션 거래에서는 정확한 시장 분석과 전략적인 의사 결정이 핵심입니다. 수익성 있는 기회를 찾아내는 뛰어난 거래 지표를 찾는 여정은 끝이 없습니다. 비밀 지표(Secret Indicator)가 등장합니다 - 최고이며 강력한 MT4 바이너리 옵션 거래 도구로서의 명성을 얻은 주목할 만한 도구입니다. 비밀 지표는 경험있는 트레이더와 전문 프로그래머들로 구성된 팀에 의해 수년간의 세심한 연구, 개발 및 테스트를 통해 만들어졌습니다. 독특한 알고리즘과 고급 수학적 모델은 바이너리 옵션의 빠른 속도로 변동하는 세계에서 트레이더에게 무적의 이점을 제공하기 위해 정교하게 조정되었습니다. 비밀 지표를 다른 거래 지표와 구분 짓는 특징은 놀라운 정확도로 수익성 있는 거래 기회를 발견하는 능력입니다. 이 신호는 강력한 기술적 지표, 가격 행동 분석 및 시장 감성 평가의 조합에서 유도됩니다. 이 다각적 접근법은 비밀 지표가 단기 변동과 장기 추세 모두를 포착하여 트레이더에게 시장의
**바이너리 스마트 시스템 소개: 귀하의 궁극적인 트레이딩 파트너** 바이너리 스마트 시스템은 단순히 인디케이터가 아닙니다. 이는 정교한 트레이딩 도구로, 다양한 시장에서 핀포인트 정확도와 적시의 신호를 제공하여 트레이더에게 성공을 이끌어주는 데 주안점을 둔 것입니다. 혁신적인 알고리즘과 다양한 기술적 지표의 철저한 컬렉션을 기반으로 구축된 이 시스템은 트레이딩 성공을 얻기 위한 열쇠입니다. **인디케이터 구성 요소:** 1. **이동 평균 비율 (MAP):** 이 구성 요소는 다양한 이동 평균의 가중 평균을 계산하여 추세 식별을 위한 강력한 기준을 형성합니다. MAP은 시장 상황에 동적으로 적응하여 현재 추세 방향을 파악하는 정보를 제공합니다. 2. **상품 채널 지수 (CCI):** 평균 가격으로부터의 편차를 분석함으로써 CCI는 과매수 및 과매도 조건을 판단합니다. 바이너리 스마트 시스템의 CCI 통합은 잠재적인 반전 지점을 식별하는 종합적인 접근을 보장합니다. 3.
소개: 바이너리 옵션과 외환 거래의 빠르게 변화하는 세계에서, 성공과 실패의 차이를 만들 수 있는 도구와 전략을 갖추는 것이 중요합니다. 이러한 도구 중 하나는 BBB 블랙 블루 바이너리 옵션 지표 시스템으로, 차트 패턴, 이동 평균, 거래량을 결합하여 거래자가 정보에 입각한 결정을 내릴 수 있도록 하는 혁신적인 접근 방식입니다. 이 포괄적인 가이드에서는 BBB 시스템의 세부 사항을 설명하고, 작동 방식, 언제 사용해야 하는지, 그리고 어떻게 하면 거래 성과를 향상시킬 수 있는지 설명합니다. BBB 지표 시스템 설명: BBB 블랙 블루 바이너리 옵션 지표 시스템은 바이너리 옵션과 외환 거래의 최적의 진입 및 퇴출 지점을 식별하는 데 도움이 되는 정교한 기술적 분석 도구입니다. 이 시스템은 "블랙"과 "블루"라는 주요 신호를 나타내는 기본 구성 요소에서 이름을 따왔습니다. 차트 패턴: BBB 시스템은 거래 차트의 계산된 부분을 분석하여 시작합니다. 이는 가격 행동에서 특정 패턴이나 형
메트로 역": 성공적인 자동 거래로의 길 "메트로 역"은 첨단 기법과 지능적인 알고리즘의 교차점에서 작동하는 선두주의적인 MT4 자동 거래 신호로, 정밀 거래의 세계로 진입할 수 있습니다. "메트로 역"은 이동 평균(MA), 상대 강도 지수(RSI), 스토캐스틱 오실레이터, 모멘텀 및 평균 방향 지수(ADX)의 힘을 활용하여 웰 인포메드 거래 신호를 생성합니다. 이는 지도를 찾는 초보 트레이더와 거래 과정을 간소화하려는 숙련된 트레이더 모두를 위해 설계되었습니다. "메트로 역"의 기능 핵심에는 이러한 중요한 기술적 지표를 결합하는 독특한 전략이 있으며, 데이터 기반 인사이트의 조화로운 수렴을 야기합니다. 이동 평균은 기본적인 트렌드 분석을 제공하며, 시장 소음을 걸러내고 가격 움직임의 실제 방향을 드러냅니다. 시장이 과매수 상태인지 과매도 상태인지 판단함으로써 RSI와 스토캐스틱 오실레이터는 가능한 반전이나 계속에 대한 예측을 돕는 추가적인 확증 수준을 제공합니다. 한편 모멘텀은 "
Forex 및 바이너리 옵션 성공을 위한 궁극적인 가이드: 비 다시 그리는 XY 트렌드 지표 공개 서론: Forex 및 바이너리 옵션 거래의 역동적인 세계에서 한발 앞선다는 것은 가장 중요합니다. 거래자들은 지속적으로 경쟁력 있는 우위를 제공할 수 있는 도구를 찾고 있으며, 거래 커뮤니티에서 파장을 일으키고 있는 그러한 강력한 도구 중 하나는 "비 다시 그리는 XY 트렌드" 지표입니다. 지표 이해: 비 다시 그리는 XY 트렌드 지표를 다른 지표와 구별하는 핵심 기능 중 하나는 정확성에 대한 약속입니다. 과거 신호를 다시 그려 거래자에게 신뢰할 수 없는 데이터를 남길 수 있는 다른 많은 지표와 달리 이 지표는 무결성을 유지합니다. 거래자는 생성되는 신호에 대해 자신감을 가질 수 있으며 이러한 신호가 과거 가격 움직임을 정확하게 반영하고 있음을 알 수 있습니다. XY 트렌드 지표는 고급 알고리즘을 사용하여 가격 데이터를 분석하고 시장의 트렌드를 식별합니다. 노련한 거래자든 초보 거래자든
빠르게 변화하는 금융 시장에서 모든 초는 중요하며 모든 결정은 거래를 성사시키거나 망칠 수 있습니다. 바이너리 해커 지표(Binary Hacker Indicator)는 분 단위로 가격 움직임을 분석하는 방식을 혁신할 준비가 된 획기적인 도구입니다. 거래의 정밀도 밝히기: 바이너리 해커 지표는 일반적인 거래 도구가 아닙니다. 실시간 분석기 역할을 하며 차트의 각 분을 분석하여 트레이더에게 귀중한 통찰력을 제공합니다. 광범위한 수동 분석이 필요한 기존 지표와 달리 바이너리 해커는 거래 전략에서 추측 작업을 제거하고 순수 데이터에 기반한 계산된 접근 방식을 제공합니다. 매 분의 힘: 거래의 매 분을 분석하고 매수와 매도 압력 사이의 복잡한 균형을 이해할 수 있다고 상상해보세요. 바이너리 해커를 통해 이러한 비전이 현실이 됩니다. 이 독창적인 지표는 시장을 지속적으로 모니터링하고 매 분마다 상승 틱과 하락 틱의 수를 계산하여 가격 액션의 본질을 쉽게 이해할 수 있는 정보로 정제합니다. 독특
제목: GOLDEN SUN 123 TREND_Dashboard_With_Alert MT4 지표 공개 끊임없이 변화하는 금융 시장에서 트레이더들은 지속적으로 경쟁력 있는 우위를 제공하는 도구를 찾고 있습니다. 정확성과 수익성을 추구하는 과정에서 GOLDEN SUN 123 TREND_Dashboard_With_Alert MT4 지표는 기회의 표지로 빛을 발합니다. MetaTrader 4 플랫폼을 위해 설계된 이 놀라운 지표는 추세 추종 기능과 경고 메커니즘을 통해 전략적 거래의 정수를 담고 있습니다. 추세의 힘 활용하기: GOLDEN SUN 123 TREND_Dashboard_With_Alert MT4 지표는 시장 추세를 식별하고 활용하기 위한 정교한 도구입니다. 트레이더들은 추세가 수익성 있는 거래의 핵심임을 이해하며, 이 지표는 바로 그러한 역할을 위해 정교하게 제작되었습니다. 이 지표는 시장을 끊임없이 검사하여 상승, 하락 또는 범위 추세인지 여부를 즉시 인식합니다. 명확성의 대시
Elon Musk EA는 MACD 수준, MACD 다이버전스, 숨겨진 MACD 다이버전스 및 지능형 마틴게일 전략을 기반으로 한 혁신적인 트레이딩 도구입니다. 이전과는 다른 트레이딩 경험을 준비하셨나요? Elon Musk EA를 함께 사용하면 MACD 수준, 다양한 MACD 다이버전스, 숨겨진 MACD 다이버전스 및 뛰어난 지능형 마틴게일 시스템의 잠재력을 발휘할 수 있습니다. 이러한 탁월한 요소들을 활용하여 이 EA는 야심찬 트레이더에게 완벽한 파트너가 될 것입니다. 제한을 깨고 가능성을 재정의하며 전례없는 금융적 성공을 향한 여행을 준비하세요. Elon Musk EA의 탁월한 점은 정확성과 적응성에 있습니다. 첨단 알고리즘과 철저한 시장 분석을 통해 MACD 수준을 탁월한 정확도로 감지하여 수익을 얻을 수 있는 최적의 타이밍을 포착할 수 있습니다. MACD 다이버전스 및 숨겨진 다이버전스를 활용하여 수익성이 높은 진입 및 청산 포인트를 식별하여 항상 경쟁자보다 한 발 앞설 수 있
T-REX_EA 는 MT4용으로 설계된 강력한 인공지능 기반의 트레이딩 로봇으로, 다양한 고급 전략을 결합하여 꾸준한 수익을 제공합니다. 이 EA는 AI 기술과 돌파 전략, 캔들 패턴, 볼륨 프로파일, 수요 및 공급 영역을 사용하여 시장을 분석하고, 트레이드 진입과 출구 시점을 최적화합니다. 주요 특징: 멀티 전략 접근법 : AI 분석과 전통적인 돌파 전략, 캔들 패턴 인식을 결합하여 강력한 트레이딩 우위를 제공합니다. 볼륨 프로파일과 수요/공급 구역 : 볼륨 데이터를 사용하여 높은 확률의 트레이드를 정확하게 식별합니다. 터보 모드 : 변동성이 큰 시장 상황에서 트레이드 빈도와 잠재적 수익을 높이는 특별한 기능입니다. 다양한 통화쌍 거래 가능 : EA는 모든 통화쌍에서 거래할 수 있지만, 특히 EUR/USD, GBP/USD, USD/JPY와 같은 주요 통화쌍에서 높은 수익을 기대할 수 있습니다. 유연한 거래 설정 : 최소 $500 의 잔액으로 거래를 시작할 수 있으며, 이는 작은 계
AI TRADING SYSTEM for MT4 - 당신의 궁극적인 AI 구동 이익 기계! AI TRADING SYSTEM 으로 거래의 미래를 해방하십시오. 이것은 최첨단 전문가 어드바이저(EA)로, 강력한 AI 구동 전략을 사용하여 모든 통화 쌍의 이익을 극대화합니다. 다양성을 위해 설계되었지만, EUR/USD, GBP/USD, USD/JPY와 같은 주요 쌍 에서 뛰어난 성능 을 발휘하여 시장에서 앞서 나갈 수 있습니다. AI TRADING SYSTEM 에는 두 가지 별개의 거래 모드 가 있어 거래 스타일과 수익 목표에 맞게 조정할 수 있습니다. BACIS 모드 - 최소한의 위험으로 꾸준하고 안정적인 이익을 위해 균형 잡힌 접근 방식을 찾는 거래자에게 완벽합니다. TURBO 모드 - 공격적인 고수익 전략으로 이익을 높이고 싶은 사람들에게 이상적이며, 시장 모멘텀을 포착하는 데 적합합니다. 주요 기능: 사용자 정의 설정 : 수익 실현(TP), 손절(SL), 로트 크기 및 마틴게일 옵션
Binary Smart Eye
Ramzi Abuwarda
"Binary Smart Eye" MT4 지표는 바이너리 옵션 및 외환 시장 모두에 거래 신호를 제공하도록 설계되었으며, M1에서 W1까지 광범위한 시간 프레임에서 작동합니다. 추세 수준, 지능형 이동 평균 및 최적화된 거래 기간을 결합한 독점적인 전략을 사용하여 잠재적인 진입점을 식별합니다. 주요 기능에 대한 분석은 다음과 같습니다. 다중 시간 프레임 분석: 지표의 다용도성은 트레이더가 다양한 시간 프레임에서 이를 활용하여 M1의 스캘핑부터 W1의 장기 추세 추종까지 다양한 거래 스타일에 맞출 수 있도록 합니다. 독점 전략: "Binary Smart Eye"의 핵심은 다음을 활용하는 고유한 전략에 있습니다. 추세 수준: 이러한 수준은 주요 시장 추세 및 잠재적인 반전 지점을 식별하는 데 도움이 됩니다. 지능형 이동 평균: 시장 변동성에 적응하고 정확한 추세 방향을 제공하는 사용자 정의 이동 평균입니다. 스마트 거래 기간: 지표는 최적의 시장 조건을 포착하기 위해 특정 시간 기간을
Forex RoadMap
Ramzi Abuwarda
ROADMAP: 완벽한 거래 실행을 위한 귀하의 궁극적인 MT5 Forex 인디케이터! Forex 시장에서 지속적인 불확실성과 추측 작업에 지쳤나요? 정확한 진입 지점, 매수 및 매도 구간을 식별하거나 정확한 손실 제한과 이익 실현 수준을 설정하는 것이 어려운가요? 더 이상 찾지 마세요! ROADMAP은 혁신적인 MT5 Forex 인디케이터로 귀하의 거래 전략을 혁신할 수 있도록 지원합니다. ROADMAP은 특별한 전략으로 설계되어 Forex 시장을 돌파하는 데 필수적인 통찰력과 정확한 계산을 제공합니다. 이 탁월한 인디케이터는 Fibonacci(FIBO) 레벨을 포함한 고급 기술의 조합을 활용하여 최적의 거래 결정을 돕습니다. ROADMAP을 통해 뛰어난 정확성으로 시장 역학을 종합적으로 파악할 수 있으며, 이상적인 진입 영역을 정확하게 식별할 수 있습니다. 이는 수익성이 높은 기회를 놓치지 않고 조기에 거래에 참여할 수 있음을 의미합니다. 이 인디케이터의 창의적인 알고리즘은 시장
통화 마술사 매트릭스 인디케이터란 무엇인가요? 통화 마술사 매트릭스 인디케이터는 통화의 강도를 보여주는 그래픽 도구입니다. 일반적인 인디케이터는 보통 다른 통화와의 상대적인 강도를 보여줍니다. 그러나 일부 계산을 통해 각 개별 통화의 절대 강도를 찾아낼 수 있습니다. 따라서 통화 마술사 매트릭스 인디케이터(또는 미터)는 통화의 절대적인 강도를 표현하기 위한 도구로, 이 강도를 다른 통화의 강도와 비교할 수 있습니다. 통화의 절대 강도를 계산하는 방법은 여러 가지가 있지만, 일반적으로 다른 인디케이터의 모든 값들을 고려하여 추출하려고 합니다. 다시 말해, 예를 들어 JPY의 강도를 계산하기 위해 알고리즘은 JPY를 포함하는 모든 통화쌍에서 동일한 인디케이터의 값들을 분석합니다. 이 개념은 통화 마술사 매트릭스에 처음 접하는 경우에는 약간 혼란스러울 수 있지만, 걱정하지 마세요. 계속 읽다보면 이해하게 될 것입니다. 통화 마술사 매트릭스는 8개 주요 통화의 강도를 측정하기 위해 개발된
Darwin Assistant
Ramzi Abuwarda
혁신적인 MT5 지표인 DARWIN Assistant   을 소개합니다. 성공적인 거래의 세계로 가는 궁극적인 관문입니다! 정확성과 전문성으로 설계된 DARWIN Assistant   은 RSI, 스토캐스틱, CCI 및 추세와 같은 고급 기술 지표의 힘을 모든 시간대에 걸쳐 활용하는 특별한 전략에 따라 운영됩니다. 이 최첨단 지표는 진입을 위한 가장 정확한 신호를 제공하므로 비교할 수 없는 확신을 가지고 시장을 탐색할 수 있으므로 특별한 거래 경험에 대비하십시오. DARWIN 트래픽을 사용하면 가장 수익성이 높은 거래 기회를 감지할 수 있도록 세심하게 보정된 중요한 지표에 대한 포괄적인 분석에 액세스할 수 있습니다. 불확실성에 작별을 고하고 정보에 입각한 의사 결정의 새로운 시대를 맞이하십시오. RSI, Stochastics, CCI 및 Trends가 DARWIN Assistant   내에서 원활하게 수렴되어 전례 없는 시장 역학을 생생하게 보여줍니다. DARWIN Assist
필터:
리뷰 없음
리뷰 답변