Miraculous Forex Indicator

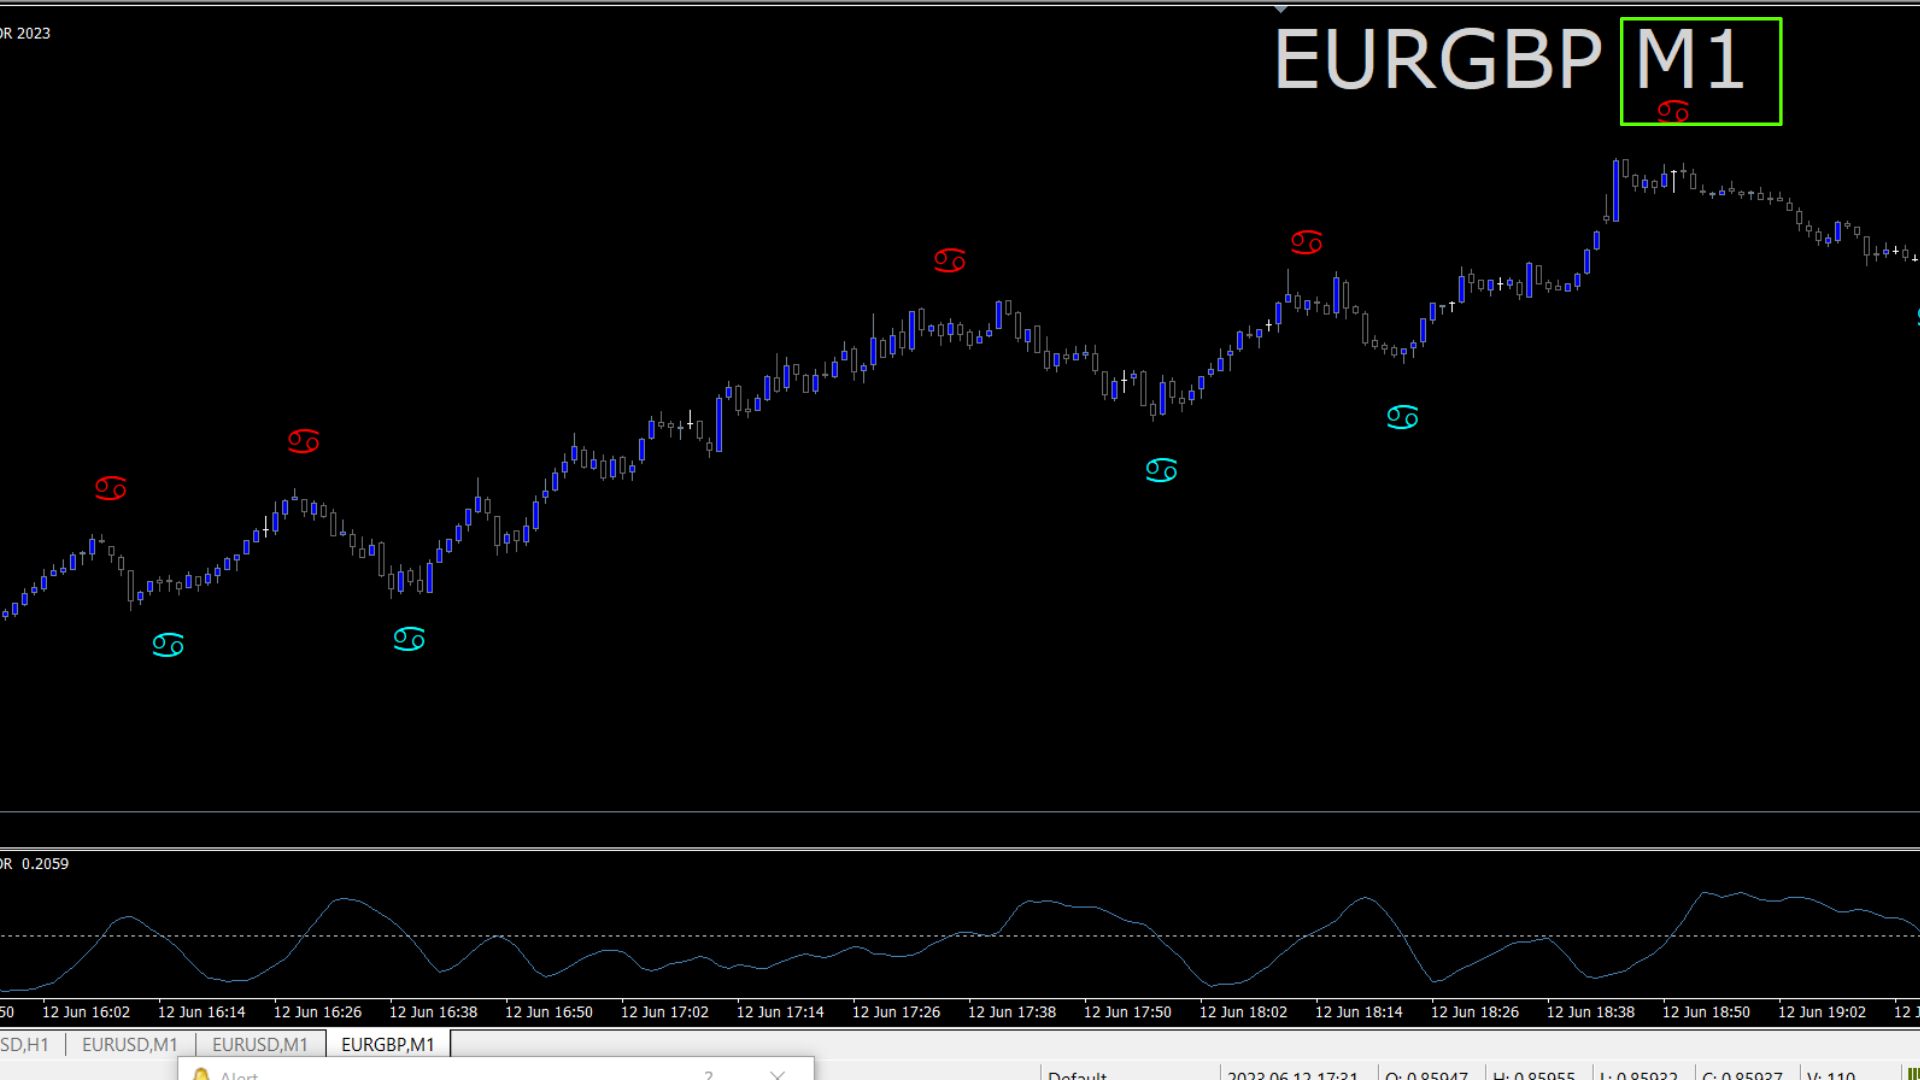
기적적인 외환 지표 소개: 정확한 트레이딩의 힘을 발휘하세요

모든 시간대에서 뛰어난 결과를 제공하는 최고의 외환 지표를 찾는데 지친 적이 있나요? 더 이상 찾을 필요가 없습니다! 기적적인 외환 지표가 도래하여 귀하의 트레이딩 경험을 혁신하고 수익을 새로운 고도로 끌어올립니다.

최첨단 기술과 수년간의 정성스런 개발을 토대로 기적적인 외환 지표는 외환 시장에서의 힘과 정확성의 정점으로 떠오릅니다. 이 탁월한 도구는 모든 수준의 트레이더의 요구를 충족시키고 지속적인 수익을 추구하는 데에서 비길 데 없는 우위를 제공하기 위해 설계되었습니다.

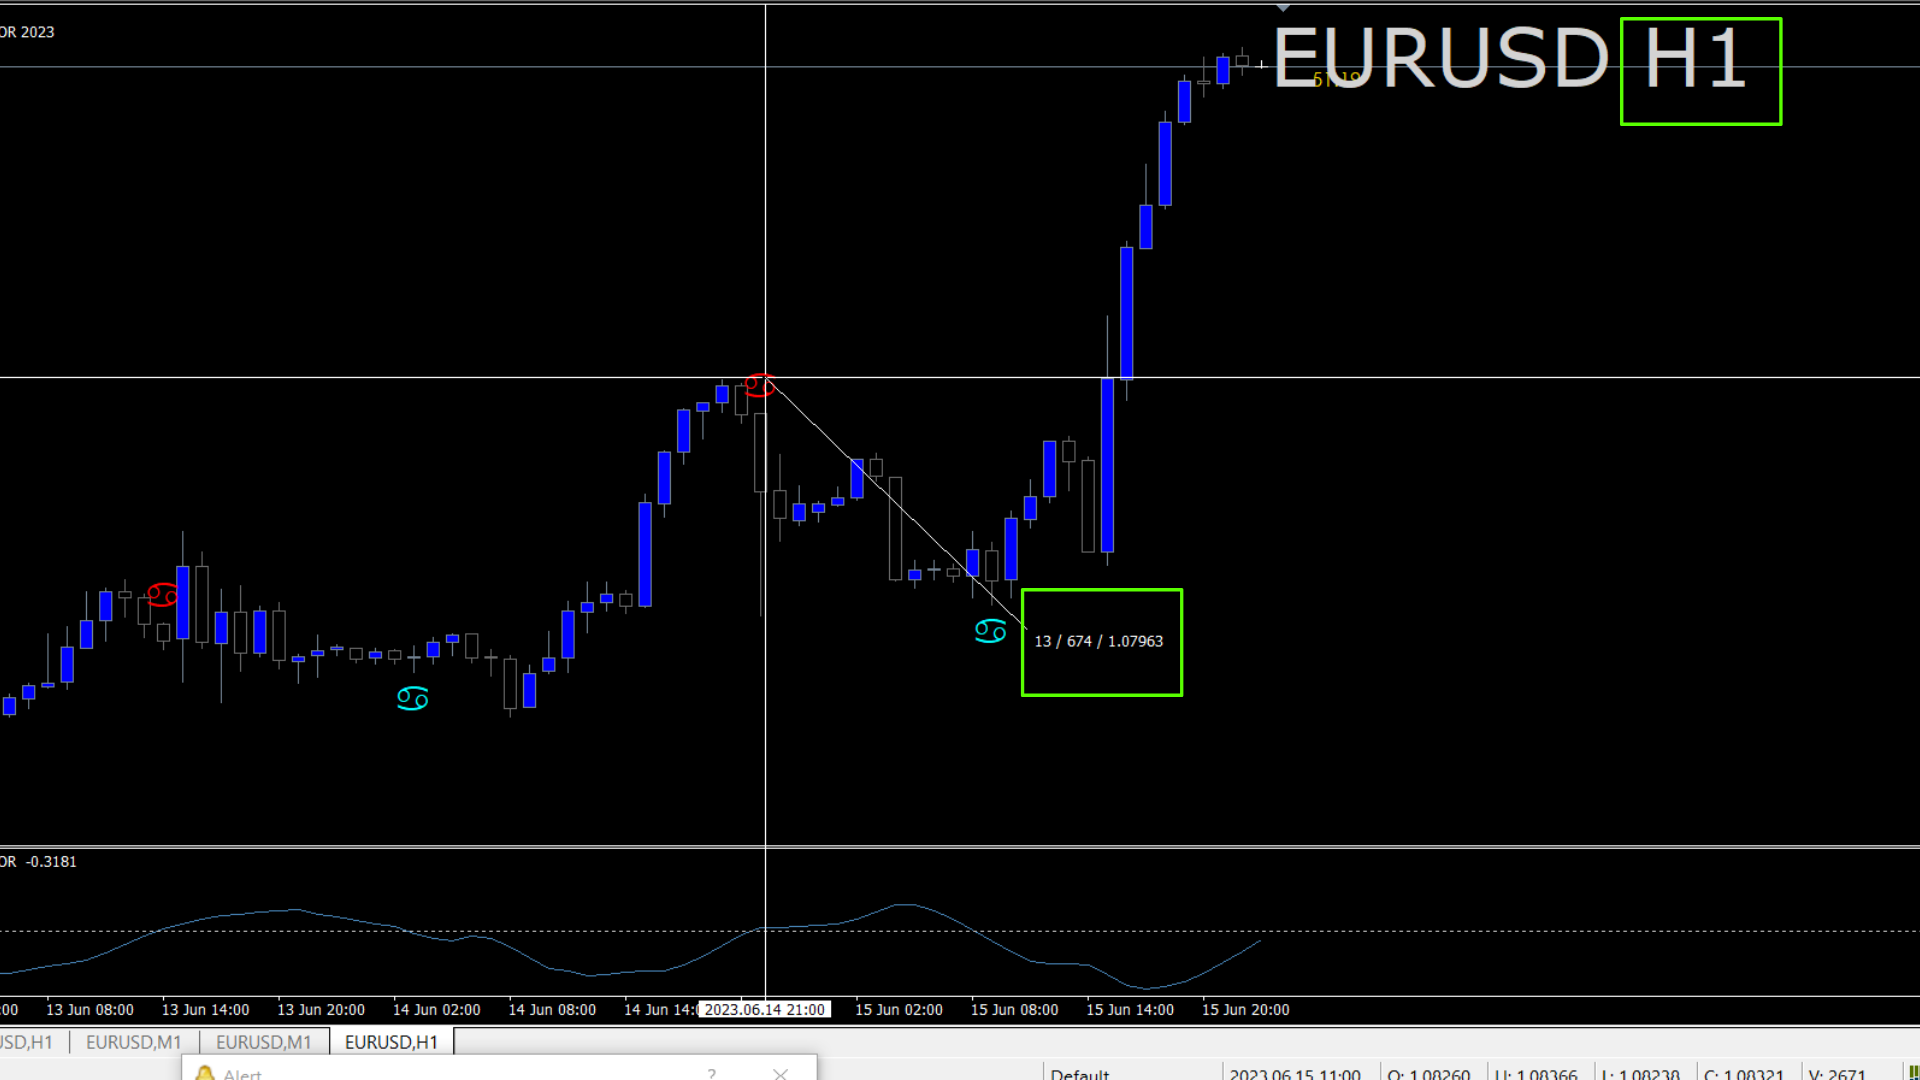
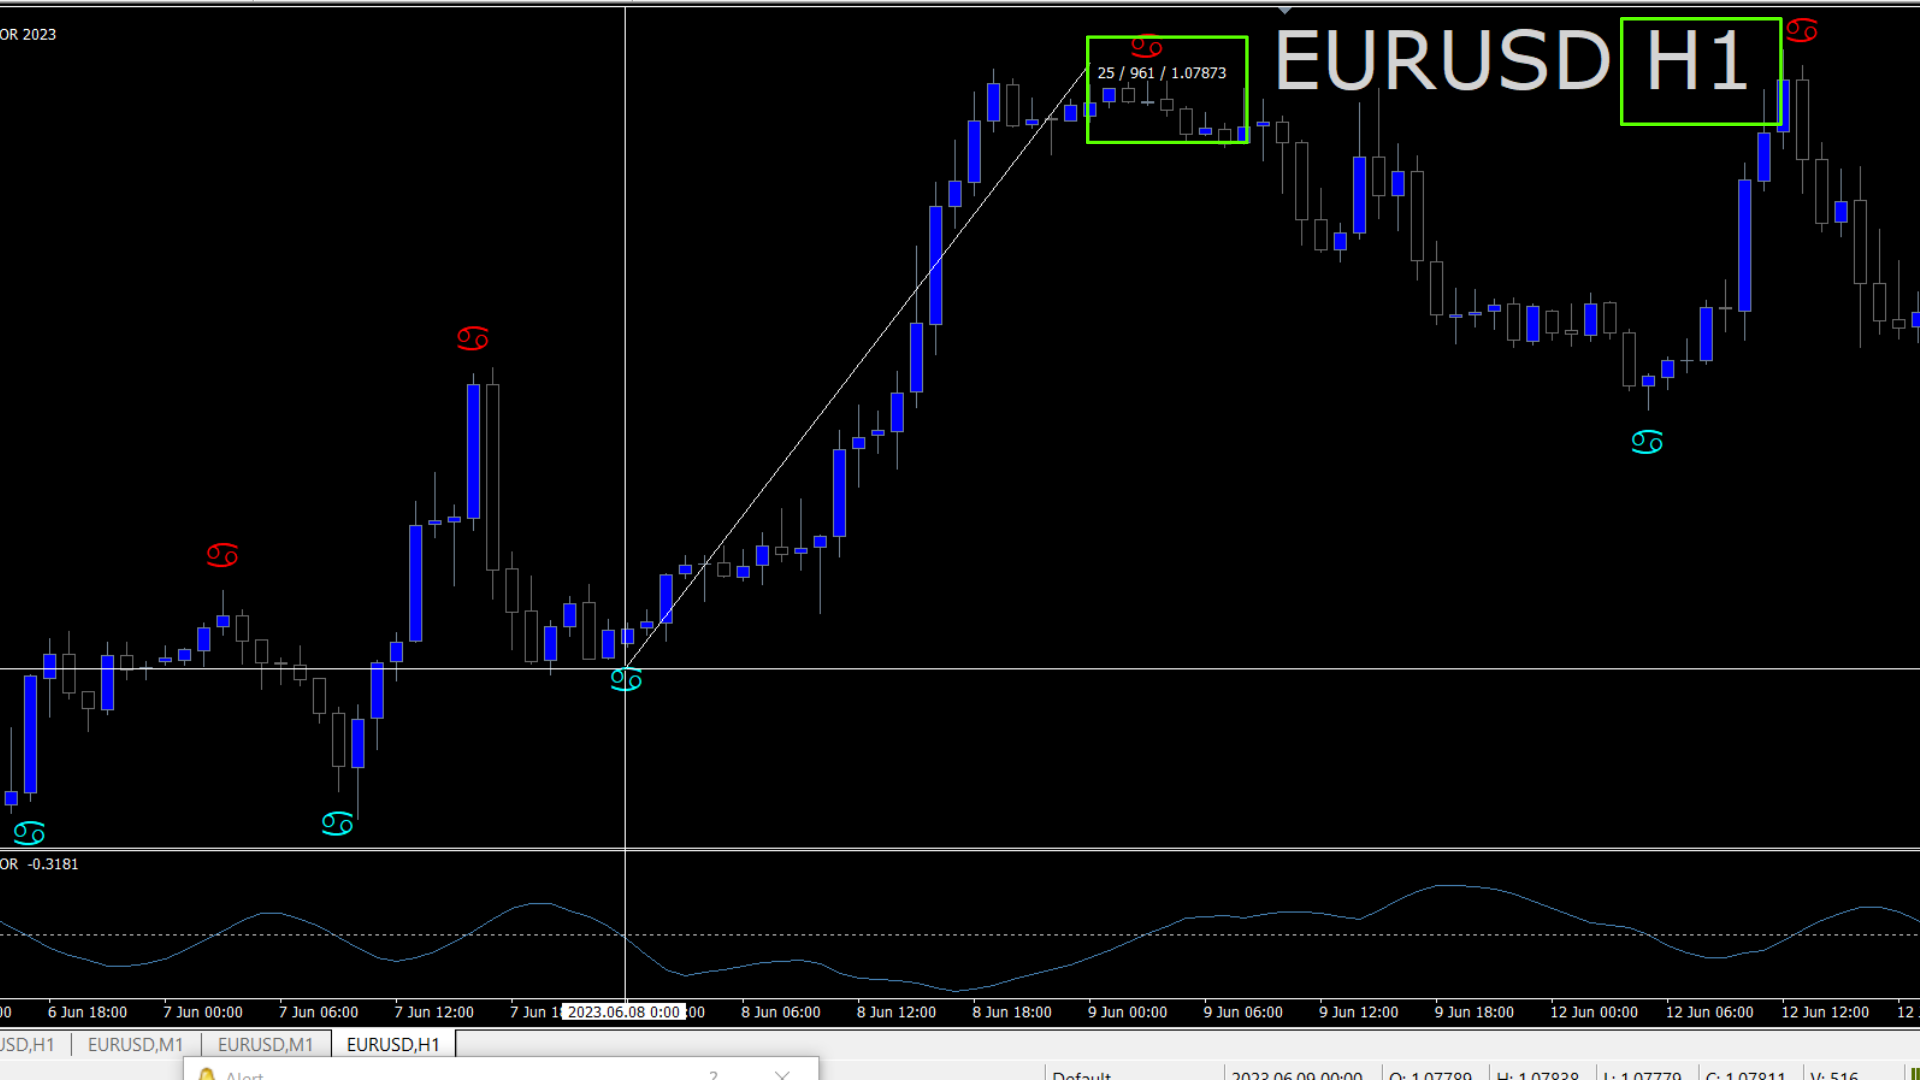
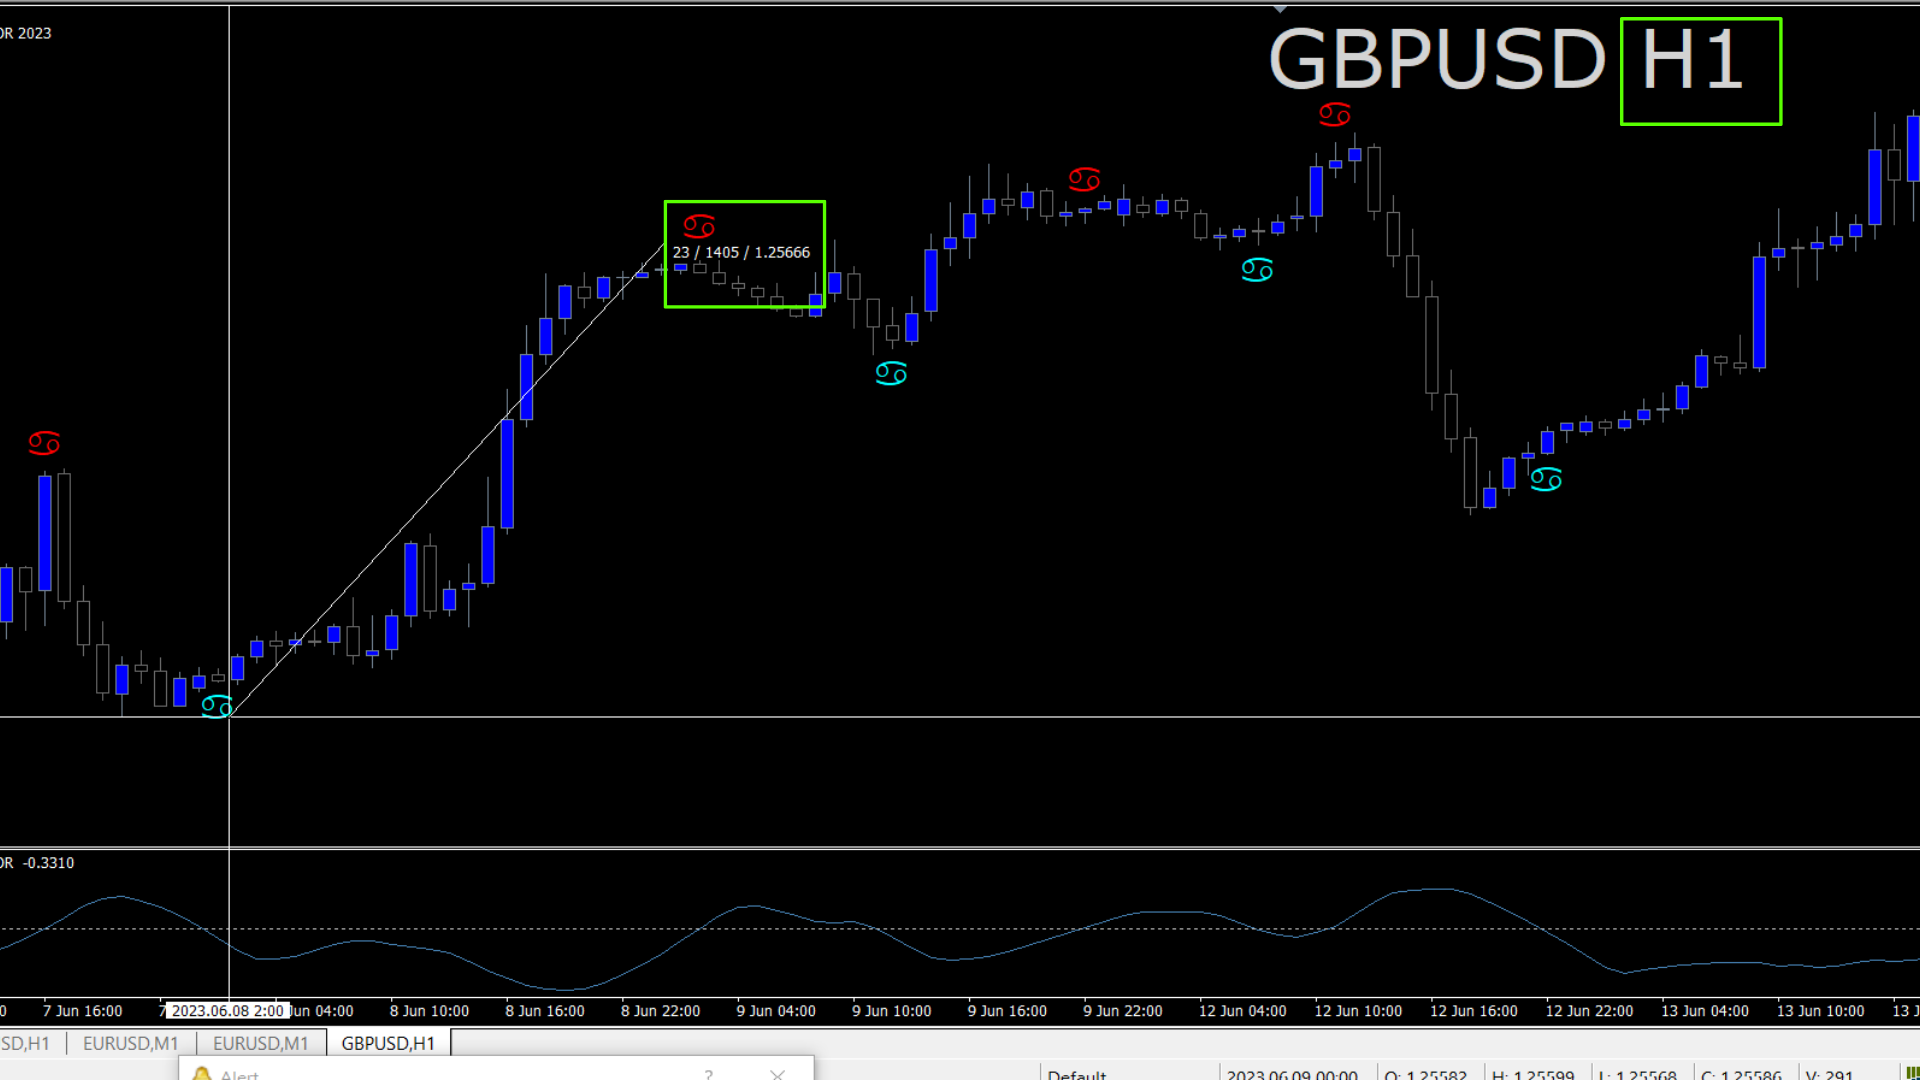
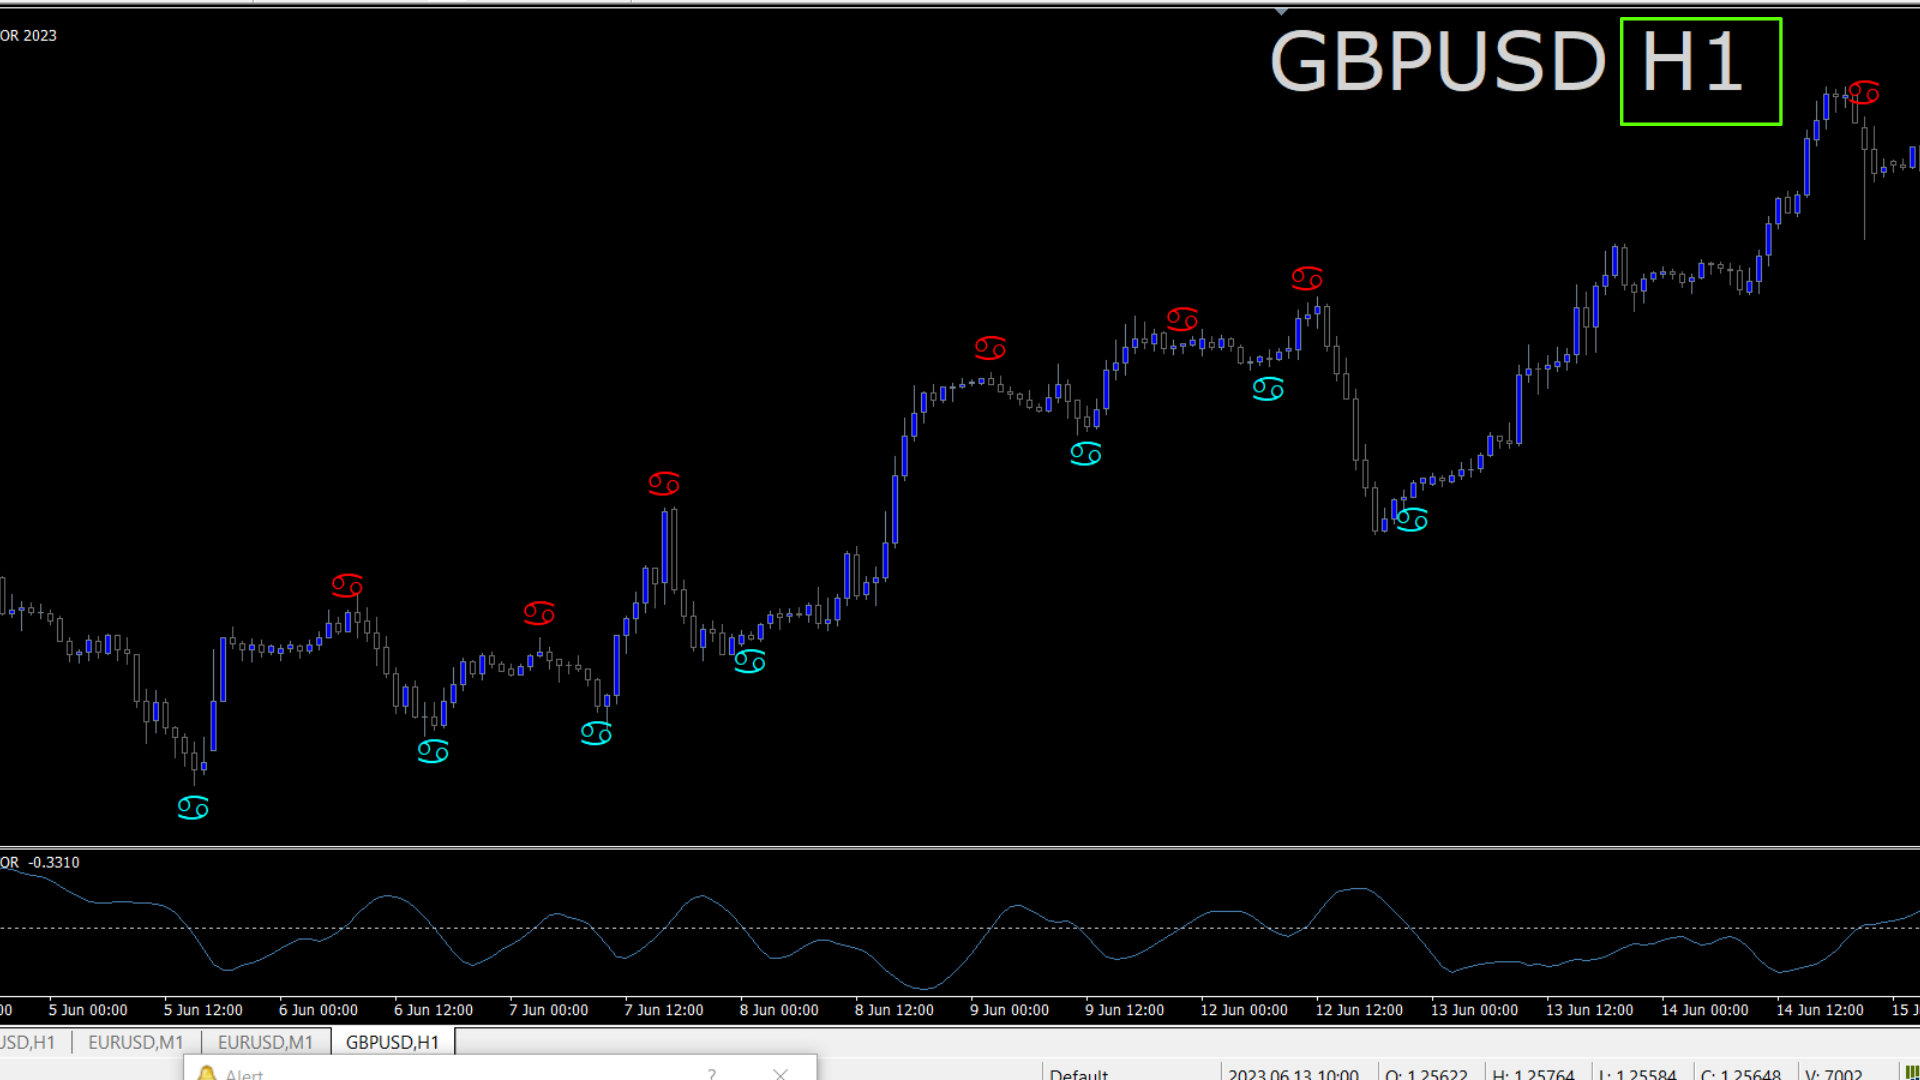
기적적인 외환 지표의 가장 큰 장점은 그 뛰어난 적응성에 있습니다. 당신이 데이 트레이더, 스윙 트레이더이든 장기 포지션을 선호하든, 이 지표는 모든 시간대에서 뛰어난 결과를 제공하기 위해 최적화되었습니다. 그러나 그 정확성과 시장의 복잡한 움직임을 포착하는 능력이 참으로 빛을 발하는 것은 1시간 기간대에서 사용할 때입니다.

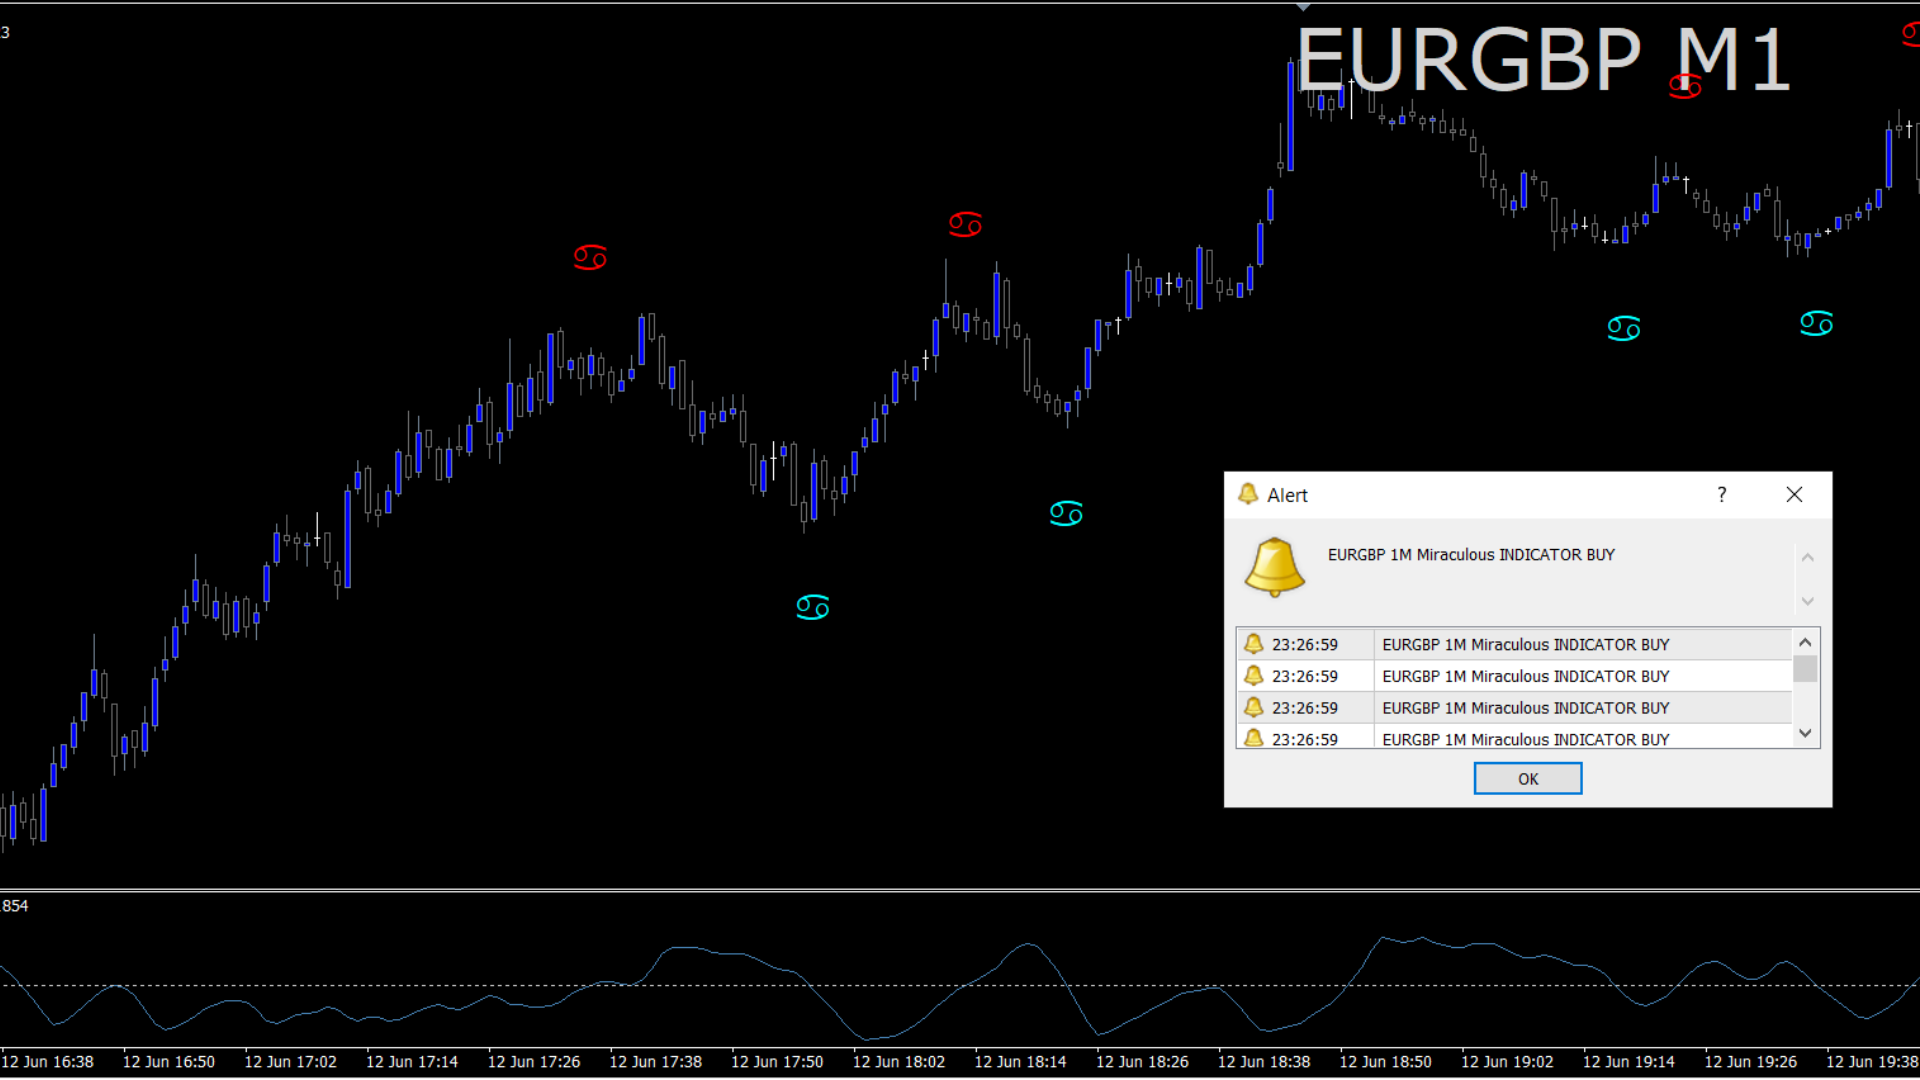
기적적인 외환 지표의 정확성과 신뢰성에 놀랄 준비를 하세요. 그의 고급 알고리즘은 강력한 지표, 통계 분석 및 트렌드 인식을 완벽하게 결합하여 실시간으로 포괄적인 시장 전망을 제공합니다. 지표의 지능적이고 동적인 신호는 당신이 자신감을 가지고 정보를 바탕으로 트레이딩 결정을 내릴 수 있게 해주며 성공적인 거래의 기회를 극대화합니다.

추측과 불확실성에서 벗어나세요. 기적적인 외환 지표는 트레이딩에서의 추측을 제거하여 시장 참가자들에 대해 뛰어난 우위를 제공합니다. 직관적인 디자인과 사용하기 쉬운 인터페이스로 모든 수준의 트레이더가 이 탁월한 도구를 활용할 수 있습니다. 노련한 전문가부터 포부를 품은 초보자까지, 지금 바로 기적적인 외환 지표의 힘을 활용하세요.

기적적인 외환 지표와 함께하면 당신의 트레이딩 여정은 변화할 것입니다. 지속적인 수익성의 비밀을 발견하며 재정적인 독립의 자유를 누리세요. 난해하고 복잡한 전략들을 작별하고 좌절과 실망에 빠지지 마세요.

트레이딩을 새로운 높이로 끌어올리는 이 특별한 기회를 놓치지 마세요. 지금 바로 기적적인 외환 지표의 힘을 이용하여 동적인 외환 트레이딩 세계에서 비길 데 없는 성공을 이루어 가세요. 수익을 창출하는 트레이더로서의 미래는 지금부터 시작됩니다.


추천 제품
BinaryScalping
Andrey Spiridonov
BinaryScalping is a professional indicator for trading binary options and scalping. The algorithm of the indicator is based on the calculation of pivot points for each time period separately, the location of the price of the trading instrument relative to the pivot points is analyzed and the probability of a trading operation is calculated. The indicator has a built-in filter of trading signals based on the global trend. The indicator is installed in the usual way and works with any trading inst
Auto Fibo Pro m
DMITRII GRIDASOV
"Auto FIBO Pro" Crypto_Forex 지표 - 거래에 유용한 보조 도구입니다! - 지표는 자동으로 Fibo 수준과 로컬 추세선(빨간색)을 계산하여 차트에 배치합니다. - Fibonacci 수준은 가격이 반전될 수 있는 주요 영역을 나타냅니다. - 가장 중요한 수준은 23.6%, 38.2%, 50%, 61.8%입니다. - 역전 스캘핑이나 존 그리드 거래에 사용할 수 있습니다. - Auto FIBO Pro 지표를 사용하여 현재 시스템을 개선할 수 있는 기회도 많습니다. - Info Spread Swap Display가 있습니다. 현재 Spread와 Swap이 부착된 외환 쌍을 표시합니다. - 디스플레이에는 계정 잔액, 자본 및 마진도 표시됩니다. - 차트의 어느 모서리에서나 Info Spread Swap Display를 찾을 수 있습니다. 0 - 왼쪽 상단 모서리, 1 - 오른쪽 상단, 2 - 왼쪽 하단, 3 - 오른쪽 하단. 여기를 클릭하여 고품질 트레이딩 로봇과
Trend PA
Mikhail Nazarenko
5 (3)
The Trend PA indicator uses   Price Action   and its own filtering algorithm to determine the trend. This approach helps to accurately determine entry points and the current trend on any timeframe. The indicator uses its own algorithm for analyzing price changes and Price Action. Which gives you the advantage of recognizing, without delay, a new nascent trend with fewer false positives. Trend filtering conditions can be selected in the settings individually for your trading style. The indicator
Signal From Level
Yaroslav Varankin
Binary Options Support Resistance Indicator This indicator is designed for binary options trading and effectively shows retracements from support and resistance levels. Signals appear on the current candle. A red arrow pointing downwards indicates a potential selling opportunity, while a blue arrow pointing upwards suggests buying opportunities. All that needs adjustment is the color of the signal arrows. It is recommended to use it on the M1-M5 timeframes as signals are frequent on these timef
Based on MACD indicator waves with standard parameters Applies Fibonacci levels to the last two MACD waves, positive and negative respectively, if at the moment the MACD indicator runs out of negative Wave - the color is green, if at the moment the MACD indicator runs out of positive Wave - the color is red. The Wave termination criterion is two ticks with a different MACD sign. Applies trend lines on the last four MACD Waves. Works well with the expert Figures MACD   https://www.mql5.com/ru/mar
This indicator is designed for scalping on low timeframes (M1-M15) in volatile markets like major forex pairs (e.g., EURUSD, GBPUSD). It generates non-repainting buy (green up arrow) and sell (red down arrow) signals based on EMA crossover confirmed by RSI momentum and MACD crossovers, minimizing false signals in ranging markets. How to Use: Attach the indicator to your MT4 chart. Look for arrows on the chart: Buy on green up arrow, Sell on red down arrow. Signals appear at the open of the new
Target Striking
Dmitriy Kashevich
Target Striking - One of the best binary options trading tools! It is set up so powerfully that you can trade not only on currency pairs, but also on raw gold oil! You can also try on cryptocurrency! Ideal for trading on currency pairs, the percentage of reliable transactions is more than + 75% The trading tool is already set for the best profit! Only Target Striking can unlock the potential of the trading market for you! With it, the signals are even and accurate without redrawing, a sig
NostradamusMT4
Andrey Spiridonov
1 (1)
NostradamusMT4 is a powerful indicator from the set of professional trader. The indicator is based on Andrei Spiridonov's original price calculation method (ESTIMATED PRICE) for the current candle price. Advantages The indicator does not redraw. It works on any timeframes. Works with any trading instruments. Perfectly suitable for scalping and trading binary options. Parameters Color - color of the ESTIMATED PRICE FUTURE line. How to work with the indicator The indicator forms the ESTIMATED P
Robot scalper for M5 timeframe. Trades on the GBPUSD currency pair. This robot has been specially developed by a company of professional traders for trading in the pound sterling. The robot approximately opens 5 to 15 trades every day. It is best to trade with brokers that have a low spread on GBPUSD up to 10 pips. The recommended minimum deposit to start is $500 or more. Advantages: does not use martingale. not a net. every trade has a stop loss. professional bot specifically for the GBPUSD p
Forex 및 바이너리 옵션 성공을 위한 궁극적인 가이드: 비 다시 그리는 XY 트렌드 지표 공개 서론: Forex 및 바이너리 옵션 거래의 역동적인 세계에서 한발 앞선다는 것은 가장 중요합니다. 거래자들은 지속적으로 경쟁력 있는 우위를 제공할 수 있는 도구를 찾고 있으며, 거래 커뮤니티에서 파장을 일으키고 있는 그러한 강력한 도구 중 하나는 "비 다시 그리는 XY 트렌드" 지표입니다. 지표 이해: 비 다시 그리는 XY 트렌드 지표를 다른 지표와 구별하는 핵심 기능 중 하나는 정확성에 대한 약속입니다. 과거 신호를 다시 그려 거래자에게 신뢰할 수 없는 데이터를 남길 수 있는 다른 많은 지표와 달리 이 지표는 무결성을 유지합니다. 거래자는 생성되는 신호에 대해 자신감을 가질 수 있으며 이러한 신호가 과거 가격 움직임을 정확하게 반영하고 있음을 알 수 있습니다. XY 트렌드 지표는 고급 알고리즘을 사용하여 가격 데이터를 분석하고 시장의 트렌드를 식별합니다. 노련한 거래자든 초보 거래자든
"Adjustable Fractals"는 프랙탈 지표의 고급 버전으로, 매우 유용한 거래 도구입니다! .................................................................................................................. - 알다시피 표준 프랙탈 mt4 지표에는 설정이 전혀 없습니다. 이는 거래자에게 매우 불편합니다. - Adjustable Fractals는 이 문제를 해결했습니다. 필요한 모든 설정이 있습니다. - 지표의 조정 가능한 기간(권장 값 - 7 이상). - 가격의 고점/저점으로부터 조정 가능한 거리. - 프랙탈 화살표의 조정 가능한 디자인. - 표시기에는 모바일 및 PC 알림 기능이 내장되어 있습니다. 여기를 클릭하여 고품질 트레이딩 로봇과 지표를 확인하세요! 이 MQL5 웹사이트에서만 제공되는 오리지널 제품입니다.
Sweet Waffle
Christophe Godart
The arrows are calculated with: -     2 Parabolic  parameters -     2 ADX parameters -     4 Stochastic parameters We recommend to combine it with Parabolic, ZigZag or Elliot waves indicator. Always trade the trend! If you make sure to draw your trend lines and support/resistance zones you will just have to wait for the signal to appear. Take the trade. For Binary Options it is advisable to set the expiry time to 5-15 min in M1 chart. THIS INDICATOR IS ZERO REPAINT Best assets to trade: - EUR
EARLY REMINDER: The Starting price is 65 price will rise soon up to 365$ and then 750$ after first 10 copies of sales. Grab this offer now! Introduction Hello, traders! Welcome to the demonstration of the Forex Beast Indicator , a comprehensive tool designed to assist aspiring traders in navigating the complexities of the forex market. This indicator incorporates seven essential components to provide a well-rounded trading experience: Moving Averages Colored Zones Support and Resistance Levels
Skalper Indikator
Vladimir Chebonenko
Индикатор Стрелочник для Скальпинговой работы Философия и логика работы индикатора Этот индикатор создан для фильтрации рыночного шума и поиска мощных, подтвержденных трендовых движений. Его основная идея — входить в рынок только тогда, когда несколько независимых друг от друга математических моделей подтверждают наличие сильного тренда. Три алгоритма подтверждения:   Чтобы определить направление и силу тренда, индикатор использует три совершенно разных подхода: Алгоритм 1: Моментум на основе С
Happy Scalping Indicator
Leandro Bernardez Camero
이 지표는 공격적인 스캘핑 과 바이너리 옵션에서 빠른 진입 을 위해 설계되었습니다 , 각 캔들 마다 신호를 생성하여 언제든지 무엇이 일어나고 있는지 정확히 알 수 있습니다. Happy Scalping 채널에 가입하세요: MQL5 재작성 없음 : 현재 캔들의 신호는 실시간 으로 생성됩니다. 이는 캔들이 아직 형성 중일 때 가격이 이전 캔들의 종가에 비해 상승하거나 하락하는지에 따라 신호가 변경될 수 있음을 의미합니다. 그러나 캔들이 닫히면 , 신호의 색상은 완전히 고정됩니다 . 변경되지 않으며, 사라지지 않고, 이동하지 않습니다. 보이는 그대로 남습니다. 왜 이렇게 설계되었나요? 많은 스캘퍼들은 특히 가격의 돌파나 급격한 움직임 이 있을 때 즉시 신호를 받는 것을 선호합니다. 이를 통해 그런 빠른 피프스를 바로잡을 수 있습니다. 반면, 일부 트레이더는 닫힌 캔들로 확인을 기다리는 것 을 선호하며, 이 지표는 그들도 완벽하게 사용할 수 있습니다. 두 가지 접근 방식 모두 유효합니
WanaScalper MT4
Isaac Wanasolo
1 (1)
A scalping indicator based on mathematical patterns, which on average gives signals with relatively small SL, and also occasionally helps to catch big moves in the markets (more information in the video) This indicator has three main types of notifications: The first type warns of a possible/upcoming signal on the next bar The second type indicates the presence of a ready signal to enter the market/open a position The third type is for SL and TP levels - you will be notified every time price re
PipStartex
Andrey Kozak
PipStartex is an indicator for scalping. It draws overbought/oversold price zones on the chart in the form of a channel. It also draws yellow dots on the chart when the price goes beyond the channel. When the price goes beyond this channel, it always tries to return back. Knowing this pattern, every trader can use it for trading. When the price in the oversold zone goes beyond the channel below the red zone, we open a buy deal. When the price in the overbought zone goes beyond the channel above
FiboPlusWaves
Sergey Malysh
5 (1)
FiboPlusWave Series products Ready-made trading system based on Elliott waves and Fibonacci retracement levels . It is simple and affordable. Display of the marking of Elliott waves (main or alternative option) on the chart. Construction of horizontal levels, support and resistance lines, a channel. Superposition of Fibonacci levels on waves 1, 3, 5, A Alert system (on-screen, E-Mail, Push notifications).    Features: without delving into the Elliott wave theory, you can immediately open one of
Power Renko MT4
Pierce Vallieres
Power Renko is an indicator which plots Renko bricks underneath the chart using a histogram. You can select the brick size and the timeframe of the Renko bricks as well as whether or not to use the close price or the high/low price of the candles. Renko bricks are based on price alone, not time, therefor the Renko bricks will not be aligned with the chart's time. They are extremely useful for trend trading and many different strategies can be formed from them. Buffers are provided allowing you t
Pan PrizMA CD Phase is an analogue of the МetaТrader 5 indicator , and is an option based on the Pan PrizMA indicator. Details . Averaging by a quadric-quartic polynomial increases the smoothness of lines, adds momentum and rhythm. Extrapolation by the sinusoid function near a constant allows adjusting the delay or lead of signals. The value of the phase - wave status parameter (which is close in meaning to the trigonometric phase or the angle of the radius-vector rotation in the trigonometric p
Manuscript mt4
Artur Razhabov
Manuscript is a time-tested indicator, many tests have been conducted in its use, I will tell all buyers my recommendations on using forex, cryptocurrency or binary options This indicator gives a signal exactly at the close of the candle of the selected period The arrow does not disappear after the signal, you can set up email notifications I recommend using it on the period H1,H4,daily If you are aware of its work, you will be able to trade in a plus In the future I will give you my recomm
Market Maestro: Your Ideal Partner for Automated Forex Trading If you're looking for a reliable assistant for trading in the currency market, Market Maestro is exactly what you need. This modern Forex bot is built using the latest technologies and algorithms, allowing it to effectively analyze market data and make informed trading decisions in real-time. Key Features of Market Maestro 1. Multicurrency Capability for Broad Opportunities Market Maestro can work with a wide range of currency pairs,
Commodity Channel Index. Не рисующий индикатор для отображения старшего таймфрейма (далее ТФ) на текущем графике. Возможно использовать на текущем ТФ. Несколько вариантов расчета по различным ценам и используемым мувингам. Параметры: TimeFrame  - должен быть больше равен текущему. Period  - должен быть больше 1. Price Type  - варианты:  Close, High, Low, Median, Typical, Weighted, Average, Body, Median, Trend Biased. MA Metod  - метод вычисления на основе МА: SMA, EMA, SMMA, LWMA, LSMA, WEMA. Sm
This is an arrow indicator without a future function,developed based on the most advanced profit trading algorithms.It has the most innovative and advanced dual trend analysis module, as well as the latest and highly effective market trend prediction algorithm.Trends are your friends, and following larger trends can earn the maximum profit in foreign exchange. This indicator helps traders identify current trends and track them. Someone once made a profit of 10 times in a week by relying on it.No
This indicator works on MT4 and is very easy to use. When you receive a signal from it, you wait for that candle with the signal to close and you enter your trade at the beginning of the next new candle . A red arrow means sell and a green arrow means buy. All arrows comes with Alert  like for easy identification of trade signal. Are you okay with that? 1 minute candle 1 minute expire
Vanexio
Sayan Vandenhout
VANEXIO USES THE TREND WAVE INDICATOR AND IT CAN IDENTIFY THE BEGINNING AND THE END OF A NEW WAVE TREND MOVEMENT. AS AN OSCILLATOR, THE INDICATOR IDENTIFIES THE OVERBOUGHT AND OVERSOLD ZONES. IT WORKS GREAT TO CATCH THE SHORT TERM PRICE REVERSALS AND USES A MARTINGALE STRATEGY TO CLOSE ALL TRADES IN PROFIT. USE DEFAULT SETTINGS ON H1 OR HIGHER TIME FRAME ON ANY PAIR FOR MORE ACCURATE TRADES WHY THIS EA : Smart entries calculated by 5 great strategies The EA can be run on even a $20000 acco
FREE
OtmScalpHedge
Otmane Achandir
OtmScalp EA V1 - EUR, 금, BTC를 위한 AI 스캘핑 로봇 OtmScalp EA V1 - EUR, 금, BTC를 위한 AI 스캘핑 로봇 한정 기간 특가: $499만 (정가 $1200 - 조만간 가격 인상 예정) OtmScalp EA V1을 선택해야 하는 이유 꾸준한 일일 수익 - 공격적이면서도 통제된 스캘핑 전략 3가지 전문 버전 - EUR 페어, 금(XAU/USD), 비트코인(BTC/USD) 최적화 완전 자동화 트레이딩 - 24시간/주5일 운영, 수동 개입 불필요 스마트 위험 관리 - 자동 손절매, 익절 및 동적 로트 크기 조정 수익 창출 원리 높은 승률 전략 - AI가 미세 추세를 밀리초 단위로 분석 및 실행 낮은 드로다운 - 고급 위험 관리로 자본 보호 모든 브로커 호환 - IC Markets, Pepperstone, RoboForex 등에서 테스트 완료 간편한 설정 - 2분 내 설치, 코딩 지식 불필요 실제 성능 (백테스트 & 실거래 결과) EUR/USD 버
Connect Indicator
Sukunthakan Ngernbamrung
Connect Indicator is a tool used for connecting indicators between the MQL market and MT4. The connected indicators are made by our group and can be used for other applications, such as sending messages to the Line application or Telegram application. If you have any questions, please don't hesitate to ask us to receive support. Function and indicator buffer Buffer one is the high price of the previous candle. Buffer two is the high price of the previous candle. Usage To connect indicators to fu
Простое визуальное и эффективное обнаружение тренда.Сигнал поступает на " закрытой свече  ".Работает на всех символах и таймфреймах.Индикатор не использует входных параметров.Все алгоритмы для расчета заложены в код.Индикатор может использовать для разработки советников.Изменение цвета индикатора,характеризует поведение рынка.Зеленый цвет сигнализирует восходящее движение.Красный цвет сигнализирует о нисходящем движении.Желтый цвет показывает флет.Желаю всем удачной торговли!!!
SYSTEM INTRODUCTION:   The Binary Options Momentum System Is Specifically Designed For Binary Options Trading. Unlike Other Systems And Indicators That Were Adopted From Other Trading Environments For Binary Options. Little Wonder Why Many Of Such Systems Fail To Make Money . Many End Up Loosing Money For Their Users.  A Very Important Fact That Must Be Noted Is The Fact That Application Of Martingale Is not Required. Thus Making It Safer For Traders Usage And Profitability. A Trader Can Use Fi
이 제품의 구매자들이 또한 구매함
FFx Engulfing Setup Alerter gives trade suggestions with Entry, Target 1, Target 2 and StopLoss. Below are the different options available: Entry suggestion - pips to be added over the break for the entry 3 different options to calculate the SL - by pips, by ATR multiplier or at the pattern High/Low 3 different options to calculate the 2 TPs - by pips, by ATR multiplier or at Risk/Reward Offset the dashboard - any place on the chart Remove the suggestion once the price reached the SL line Lines
FFx InsideBar Setup Alerter gives trade suggestions with Entry, Target 1, Target 2 and StopLoss. Below are the different options available: Entry suggestion - pips to be added over the break for the entry Minimum candle size - to avoid too close buy/sell entry suggestions 3 different options to calculate the SL - by pips, by ATR multiplier or at the pattern High/Low 3 different options to calculate the 2 TPs - by pips, by ATR multiplier or at Risk/Reward Offset the dashboard - any place on the c
FFx OutsideBar Setup Alerter gives trade suggestions with Entry, Target 1, Target 2 and StopLoss. Below are the different options available: Entry suggestion - pips to be added over the break for the entry. 3 different options to calculate the SL - by pips, by ATR multiplier or at the pattern High/Low. 3 different options to calculate the 2 TPs - by pips, by ATR multiplier or at Risk/Reward. Offset the dashboard - any place on the chart. Remove the suggestion once the price reached the SL line.
FFx PinBar Setup Alerter gives trade suggestions with Entry, Target 1, Target 2 and StopLoss. Below are the different options available: Entry suggestion - pips to be added over the break for the entry Minimum candle size - to avoid too small candles 3 different options to calculate the SL - by pips, by ATR multiplier or at the pattern High/Low 3 different options to calculate the 2 TPs - by pips, by ATR multiplier or at Risk/Reward Offset the dashboard - any place on the chart Remove the sugges
FFx MACD Divergences
Eric Venturi-Bloxs
The purpose of this new version of the MT4 standard indicator provided in your platform is to display in a sub-window multiple timeframes of the same indicator with its divergences. See the example shown in the picture below. But the display isn't like a simple MTF indicator. This is the real display of the indicator on its timeframe. Here's the options available in the FFx divergences indicator: Select the timeframes to be displayed (M1 to Monthly) Define the width (number of bars) for each tim
FFx RSI Divergences
Eric Venturi-Bloxs
The purpose of this new version of the MT4 standard indicator provided in your platform is to display in a sub-window multiple timeframes of the same indicator with its divergences. See the example shown in the picture below. But the display isn't like a simple MTF indicator. This is the real display of the indicator on its timeframe. Here's the options available in the FFx divergences indicator: Select the timeframes to be displayed (M1 to Monthly) Define the width (number of bars) for each tim
FFx CCI Divergences
Eric Venturi-Bloxs
The purpose of this new version of the MT4 standard indicator provided in your platform is to display in a sub-window multiple timeframes of the same indicator with its divergences. See the example shown in the picture below. But the display isn't like a simple MTF indicator. This is the real display of the indicator on its timeframe. Here's the options available in the FFx divergences indicator: Select the timeframes to be displayed (M1 to Monthly). Define the width (number of bars) for each ti
The FFx Dashboard MTF alerter will show you on a single chart all the timeframes (M1 to Monthly) with their own status for the indicator. 2 Alert Options: Single timeframe: each selected timeframe alert separately when a signal occurs Multi timeframes: all selected timeframes must agree for an alert to be triggered Both options have an input to select the timeframes to be used for the alert(s). How to Understand the Status: Green/Red square: histogram above/below 0 line Green square + Red bord
The FFx Dashboard MTF alerter will show you on a single chart all the timeframes (M1 to Monthly) with their own status for the indicator. 2 Alert Options: Single timeframe: each selected timeframe alert separately when a signal occurs Multi timeframes: all selected timeframes must agree for an alert to be triggered Both options have an input to select the timeframes to be used for the alert(s). How to understand the status: Green/Red square: RSI above/below 50 line Green square + Red border: R
The FFx Dashboard MTF alerter will show you on a single chart all the timeframes (M1 to Monthly) with their own status for the indicator. 2 Alert Options: Single timeframe: each selected timeframe alert separately when a signal occurs Multi timeframes: all selected timeframes must agree for an alert to be triggered Both options have an input to select the timeframes to be used for the alert(s). How to understand the status: Green/Red square: Stoch above/below 50 line Green square + Red border:
The FFx Dashboard MTF alerter will show you on a single chart all the timeframes (M1 to Monthly) with their own status for the indicator. 2 Alert Options: Single timeframe: each selected timeframe alert separately when a signal occurs Multi timeframes: all selected timeframes must agree for an alert to be triggered Both options have an input to select the timeframes to be used for the alert(s). How to understand the status: Green/Red square: Price above/below Cloud (Kumo) Green square + Red bo
The FFx Dashboard MTF alerter will show you on a single chart all the timeframes (M1 to Monthly) with their own status for the indicator. 2 Alert Options: Single timeframe: each selected timeframe alert separately when a signal occurs Multi timeframes: all selected timeframes must agree for an alert to be triggered Both options have an input to select the timeframes to be used for the alert(s). How to understand the status: Green/Red square: MA pointing Up/Down Green square + Red border: MA po
The FFx Dashboard MTF alerter will show you on a single chart all the timeframes (M1 to Monthly) with their own status for the indicator. 2 Alert Options: Single timeframe: each selected timeframe alert separately when a signal occurs. Multi timeframes: all selected timeframes must agree for an alert to be triggered. Both options have an input to select the timeframes to be used for the alert(s). How to understand the status: Green square: Price above PSAR Red square: Price below PSAR Options
The FFx Dashboard MTF alerter will show you on a single chart all the timeframes (M1 to Monthly) with their own status for the indicator. 2 Alert Options: Single timeframe: each selected timeframe alert separately when a signal occurs Multi timeframes: all selected timeframes must agree for an alert to be triggered Both options have an input to select the timeframes to be used for the alert(s). How to understand the status: Green/Red square: CCI above/below levels (ie. 100/-100) Grey square: C
The FFx Dashboard MTF alerter will show you on a single chart all the timeframes (M1 to Monthly) with their own status for the indicator. 2 Alert Options: Single timeframe: each selected timeframe alert separately when a signal occurs Multi timeframes: all selected timeframes must agree for an alert to be triggered Both options have an input to select the timeframes to be used for the alert(s). How to understand the status: Green/Red square: ADX above level Grey square: ADX below level Red bor
The FFx Dashboard MTF alerter will show you on a single chart all the timeframes (M1 to Monthly) with their own status. 2 Alert Options: Single timeframe: each selected timeframe alert separately when a signal occurs Multi timeframes: all selected timeframes must agree for an alert to be triggered Both options have an input to select the timeframes to be used for the alert(s). How to understand the status: Green/Red square: bullish/bearish candle Options available in the FFx Dashboard Alerter
THE GRAFF III
Antonin Skaryd
The [GRAFF] III manual trading system is based on multiple MetaTrader (MT4) indicators. Together, the entire PACK of GRAFF III indicators makes an advanced trading tool. The system consists of over 20 different custom-built indicators which have been carefully selected and tested in the long term to produce strong and efficient trading signals. The particular indicators are based on different mathematical formulas, so the entire system is calibrated to remove false signals from its own indicator
FFx Universal Strength Meter PRO is more than a basic strength meter. Instead of limiting the calculation to price, it can be based on any of the 19 integrated strength modes + 9 timeframes. With the FFx USM, you are able to define any period for any combination of timeframes. For example, you can set the dashboard for the last 10 candles for M15-H1-H4… Full flexibility! Very easy to interpret... It gives a great idea about which currency is weak and which is strong, so you can find the best pai
FFx Basket Scanner
Eric Venturi-Bloxs
MetaTrader 5 version available here : https://www.mql5.com/en/market/product/24882 FFx Basket Scanner is a global tool scanning all pairs and all timeframes over up to five indicators among the 16 available. You will clearly see which currencies to avoid trading and which ones to focus on. Once a currency goes into an extreme zone (e.g. 20/80%), you can trade the whole basket with great confidence. Another way to use it is to look at two currencies (weak vs strong) to find the best single pairs
FFx Pivot SR Suite PRO
Eric Venturi-Bloxs
MetaTrader 5 version available here: https://www.mql5.com/en/market/product/25794 FFx Pivot SR Suite PRO is a complete suite for support and resistance levels. Support and Resistance are the most used levels in all kinds of trading. Can be used to find reversal trend, to set targets and stop, etc. The indicator is fully flexible directly from the chart 4 periods to choose for the calculation: 4Hours, Daily, Weekly and Monthly 4 formulas to choose for the calculation: Classic, Camarilla, Fibonac
REX complete 3in1
Christophe Godart
This is the complete REX package. It consists of the lite, pro and ULTRA version.  Perfect for beginners and intermediates. REX complete is 100% non repaint. The strategy is based on a mix of different strategies, statistics, including pivot points, oscillators and patterns.  As the trading idea consists of a variety of some classic indicators like Momentum, Williams Percent Range, CCI, Force Index, WPR, DeMarker, CCI, RSI and Stochastic, it is clear that the fundamental indicators have being u
Let´s try to make some real money! Call me profit addicted. I thought why not try to make THE dream come reality. With discipline, a clear strategy and this indicator I focus on entering the perfect trades. This indicator is very easy to use as you will get perfect entry points for Put or Call trades. The arrows are calculated with: -     Momentum  parameters -     Candle stick patterns -     Fundamental Price action We recommend to combine it with Parabolic, ZigZag or Elliot waves indicator
Golden Chip
Daishon Cotman
Golden Chip provides Basic Market Structure, Fibonacci, supply and Demand Zones. Letting you identify when a sell off point is approaching or whne a buy opportunity is arriving. The awesome thing about Golden Chip is that, you will see rejection levels or continuation before ANYBODY ! This indicator moves directly with price and lines up perfectly with the Chart. Some indicators would lag but NOT this one ! Golden Chip is amazing for Clean chart (Naked Chart). GOLDEN CHIP IS ONLY ON METATRADER (
Seconds timeframe generator for MT4  (S1, S5, S10, S15, S20, S30). Features  1. Indicator generates timeframes in real time, with each new tick on the spot. 2. Indicator is also measuring point distance from extreme to extreme when hovered "This additionally shows us how strong movements are". Advantages 1. Easy to spot best entry and exit points. 2. You can easily trade news releases where market is very volatile. 3. You can also easily trade very slow market conditions and spot tre
Indicador MTXPRO
Matheus Silva De Castro
PROMOÇÃO LIMITADA, NA COMPRA DE 1 INDICADOR VOCÊ LEVA CLUBINARIAS 6.0 , 5.1 e DonForex DE BRINDE!! ATÉ FINAL DO MÊS! -NA HORA DA COMPRA SELECIONAR COMBINAR COM O VENDEDOR OU BUSCAR PESSOALMENTE, A ENTREGA É DIGITAL EM POUCOS SEGUNDOS ==> VEJA O VIDEO PARA TIRAR AS SUAS DUVIDAS <== ==> VÍDEO OPERANDO NO YOUTUBE ROBÔ FEITO COM MUITO ESFORÇO E CARINHO E QUE ESTA TRAZENDO ÓTIMOS LUCROS APESAR DE EXISTIREM PESSOAS QUE APENAS VENDEM ROBÔS FAKES DE OPERAÇÕES , ACREDITO QUE SERIA MUITO BOM DA MI
This is a Dashboard Indicator based on Bruce's Price Predictor Indicator . This Dashboard will Give you a visual to see the trend direction without having to flip through timeframes, so you can always be trading in direction of the trend, with little effort.  I Recommend   www.CoinexxBroker.com  as a great broker and the one I personally use *Non-Repainting Dashboard Arrows *For Desktop MT4 Only *Great For Scalping *Great For Swing Trading *Dashboard Arrow Entry Alerts *Dashboard Arrow Signals
데일리 트렌드 스캘퍼(DTS) 이 표시기는 RPTrade Pro 솔루션 시스템의 일부입니다. DTS는 가격 조치, 동적 지원 및 저항을 사용하는 일일 추세 지표입니다. 누구나 사용할 수 있도록 설계되었으며 거래의 절대 초보자도 사용할 수 있습니다. 다시 칠하지 마십시오. 표시는 닫기에서 닫기로 제공됩니다. 단독으로 사용하도록 설계되어 다른 표시기가 필요하지 않습니다. 당신에게 하루의 시작에 추세와 잠재적인 이익실현을 제공합니다. 어떻게 작동합니까 DTS는 가격 조치 및 동적 지원 및 저항과 결합된 돌파 전략을 사용하고 있습니다. 야간 추세와 변동성은 다음날에 사용할 것으로 분석됩니다. 이 분석에서 브레이크아웃 한계(파란색 및 진한 주황색 선)와 이익실현(Take Profit)이 결정됩니다. 이력 데이터 덕분에 전략 및 설정의 "성공"을 즉시 확인할 수 있습니다. 역사적인 부분을 통해 전략에 "구멍"이 있는지 즉시 확인하고 더 잘 맞는 다른 TimeFrame 또는 Symbol을
Namiri Trade Engine is an ALL in ONE trading system that combines price structure, volume pressure, market condition & risk management to give you the BEST opportunities for A+ trade setups with auto lot size WAIT FOR YOUR A+ SETUP || ONLY TAKE YOUR A+ TRADE || RINSE REPEAT YOUR A+ MOVE Chart Features Panel - Shows the asset, market, price, pip, account, trade & profit|loss information Structure - Shows areas of support & resistance Risk Management - Shows risk analysis period of 100 bars, buy
제작자의 제품 더 보기
Miraculous Indicator – Gann Square of Nine 기반 100% 비리페인트 Forex 및 바이너리 도구 이 영상은 Miraculous Indicator 를 소개합니다. 이 지표는 Forex 및 바이너리 옵션 트레이더를 위해 특별히 개발된 매우 정확하고 강력한 트레이딩 도구입니다. 이 지표가 독특한 이유는 전설적인 **Gann Square of Nine(Gann 9의 사각형)**과 **Gann's Law of Vibration(Gann 진동의 법칙)**에 기반을 두고 있기 때문입니다. 이는 현대 트레이딩에서 가장 정밀한 예측 도구 중 하나로 손꼽힙니다. Miraculous Indicator는 완전히 비리페인트(non-repaint) 됩니다. 즉, 캔들이 마감된 후에도 신호가 변경되거나 사라지지 않습니다. 보이는 것이 곧 결과입니다. 이는 트레이더가 자신감을 가지고 거래에 진입하고 청산할 수 있는 신뢰할 수 있고 일관된 기반을 제공합니다. 주요 특징: Gann
F-16 비행기 지표를 소개합니다. 이것은 귀하의 거래 경험을 혁신하도록 설계된 최첨단 MT4 도구입니다. F-16 전투기의 비할 데 없는 속도와 정밀성에 영감을 받아이 지표는 고급 알고리즘과 최첨단 기술을 결합하여 금융 시장에서 압도적인 성능을 제공합니다. F-16 비행기 지표를 사용하면 실시간 분석을 제공하고 매우 정확한 거래 신호를 생성하여 경쟁을 앞서갈 수 있습니다. 다양한 자산 클래스에서 수익 기회를 식별하는 데 필요한 동적 기능을 갖추고 있어 확신을 가지고 정보에 근거한 결정을 내릴 수 있습니다. 사용자 친화적인 인터페이스로 구성된 F-16 비행기 지표는 인기있는 MetaTrader 4 플랫폼과 완벽하게 통합되어 원활하고 효율적인 거래 과정을 보장합니다. 초보자 트레이더든 경험 많은 전문가든 이 지표를 쉽게 사용자 정의하여 고유한 거래 스타일과 선호도에 맞출 수 있습니다. F-16 비행기 지표의 강력함을 경험해 보세요. 이 지표는 시장 트렌드를 정확하고 민첩하게 탐색하며
Green Frog EA
Ramzi Abuwarda
제목: 최고의 프로페셔널 EA 전문가 - 그린 프로그 EA 외환 거래의 세계에서는 시장이 빠르고 결정적으로 움직이기 때문에 신뢰할 수 있는 동반자가 있으면 큰 차이를 만들 수 있습니다. 그린 프로그 EA를 소개합니다. 최고의 프로페셔널 전문가 어드바이저(EA)로, 뛰어난 정확성과 효율성으로 트레이더들을 지원합니다. 그린 프로그 EA는 최첨단 기술적 발전과 외환 산업에서의 경험을 결합한 결과물입니다. 경험 많은 트레이더들과 소프트웨어 엔지니어들로 구성된 팀에 의해 개발되었으며, 꾸준한 결과를 제공하고 상당한 수익을 창출합니다. 그린 프로그 EA의 차별점은 변화무쌍한 시장 상황에 대응할 수 있는 능력입니다. 정교한 알고리즘과 실시간 데이터 분석을 기반으로, 이 EA는 신속하게 수익성 있는 기회를 식별하고 높은 정밀도로 거래를 실행합니다. EA의 지능적인 트레이딩 전략은 트렌드, 변동성이 큰 시장, 그리고 레인지 시장과 같은 다양한 시장 상황에서도 최적의 성과를 보장합니다. 그린
믿을 수 없는 이진 옵션 지표를 사용하고 실수신호로 인해 손실과 좌절을 겪으신 적이 있으신가요? MT4 거래 플랫폼에서 사용 가능한 최고의 바이너리 옵션 지표, CLOCK INDICATOR를 찾으십시오! 고급 알고리즘과 강력한 기술적 분석 도구를 갖춘 CLOCK INDICATOR는 초보자와 숙련된 트레이더 모두에게 최고의 거래 도구입니다. 시장 트렌드를 정확히 예측하고 수익성 있는 거래 기회를 식별하여 이익을 극대화하고 손실을 최소화하는 데 도움이 됩니다. 다른 복잡하고 사용하기 어려운 이진 옵션 지표와 달리, CLOCK INDICATOR는 설치와 사용자 정의가 쉽습니다. 개별 거래 기호에 맞게 설정을 조정할 수 있으며, 모든 주요 통화 쌍과 시간대에서 원활하게 작동합니다. CLOCK INDICATOR의 뛰어난 특징 중 하나는 다시 그리지 않는 특성입니다. 신호가 생성되면 차트에 남아 있으므로 정확한 정보를 기반으로 한 투자 결정을 내리고 있다는 확신을 가질 수 있습니다.
SCALPER EA를 소개합니다. 급격한 인기를 끌고 있는 혁신적인 전문가 어드바이저(EA)로, 외환 거래 세계를 휩쓸었습니다. 2023년에는 SCALPER EA가 가장 수익성이 뛰어나는 EA로 등장하여, 트레이더들이 외환 시장에 접근하는 방식을 혁신적으로 바꾸었습니다. 단기 시장 변동을 활용하도록 설계된 SCALPER EA는 고급 알고리즘과 첨단 기술을 활용하여 신속한 정확도로 고성과 거래 기회를 식별합니다. 뛰어난 성과로 인해, 경험 많은 트레이더와 큰 수익을 추구하는 초보자들 모두에게 필수 도구로 평가받고 있습니다. 스마트한 자동화를 통해 SCALPER EA는 항상 경쟁자들을 앞섭니다. 변동성이 큰 시장 조건에서도 놀라운 수익을 창출하며, 신속하고 효율적으로 거래를 실행하여 수익 가능성을 최대화합니다. 이익 기회를 놓치지 않도록 해 주어 트레이더들에게 빠르게 변화하는 외환 거래 환경에서 경쟁 우위를 제공합니다. SCALPER EA를 다른 EA와 구별하는 점은 그 적응성입니다.
MT4 "독수리 눈 지표"로 바이너리 옵션 거래의 가능성을 극대화하세요 메타트레이더 4(MT4)용 "독수리 눈 지표"를 활용하여 바이너리 옵션 거래의 혁명적인 세계에 도약해 보세요. 이 혁신적인 도구는 수술적인 정확성과 비교할 수 없는 수익성을 제공하여 거래 경험을 변화시킬 준비가 되어 있습니다. 잠재력의 경계가 깨지고 수익이 극대화되는 세계로 뛰어들어 보세요. 독수리 눈 지표의 뛰어난 정확성과 흔들림 없는 신뢰성 덕분에 시장의 숨겨진 비밀을 해결할 수 있습니다. 세심한 세부 사항에 주의를 기울여 개발된 이 최첨단 지표는 고급 알고리즘, 철저한 기술적 분석, 실시간 시장 데이터를 결합하여 탁월한 거래 이점을 제공합니다. 독수리 눈 지표는 시장의 포인트를 정확하게 파악하여 통찰력 있는 신속한 결정을 돕습니다. 직관적인 인터페이스와 사용하기 쉬운 디자인을 통해 초보 트레이더도 쉽게 바이너리 옵션의 복잡성을 탐색하고 이 도구의 엄청난 힘을 최대한 활용할 수 있습니다. 추측과 감정에 기반한
Swing X Black
Ramzi Abuwarda
SWING X Black은 Binary Options와 Forex 거래를 조화롭게 연결하여 두 시장에서 강력한 통찰력을 활용할 수 있는 유연성을 제공합니다. 이 상호 호환성은 거래자들이 선호하는 거래 스타일에 관계없이 정보에 입각한 결정을 내릴 수 있도록 보장하여 성공의 기회를 높이는 데 도움이 됩니다. SWING X Black의 핵심 강점은 탁월한 신호 생성 기능에 있습니다. 고급 알고리즘을 기반으로 하는 이 지표는 잠재적인 추세 반전, 지지 및 저항 영역, 그리고 돌파구를 정확하게 식별하여 거래자들에게 명확한 진입 및 퇴출 지점을 제공합니다. 이 정밀도는 거래자들이 최소한의 위험으로 수익성 있는 기회를 포착하는 데 큰 도움이 됩니다. 빠르게 변화하는 거래 환경을 잘 이해하여 설계된 SWING X Black은 15분의 타임프레임에서 가장 빛을 발합니다. 이 짧은 시간 동안 거래자들은 시장 움직임을 신속하게 분석하여 시장 조건의 변화에 ​​신속하게 대응할 수 있습니다. 15분의 만기
Market Secret
Ramzi Abuwarda
세계적인 바이너리 옵션 거래에서는 정확한 시장 분석과 전략적인 의사 결정이 핵심입니다. 수익성 있는 기회를 찾아내는 뛰어난 거래 지표를 찾는 여정은 끝이 없습니다. 비밀 지표(Secret Indicator)가 등장합니다 - 최고이며 강력한 MT4 바이너리 옵션 거래 도구로서의 명성을 얻은 주목할 만한 도구입니다. 비밀 지표는 경험있는 트레이더와 전문 프로그래머들로 구성된 팀에 의해 수년간의 세심한 연구, 개발 및 테스트를 통해 만들어졌습니다. 독특한 알고리즘과 고급 수학적 모델은 바이너리 옵션의 빠른 속도로 변동하는 세계에서 트레이더에게 무적의 이점을 제공하기 위해 정교하게 조정되었습니다. 비밀 지표를 다른 거래 지표와 구분 짓는 특징은 놀라운 정확도로 수익성 있는 거래 기회를 발견하는 능력입니다. 이 신호는 강력한 기술적 지표, 가격 행동 분석 및 시장 감성 평가의 조합에서 유도됩니다. 이 다각적 접근법은 비밀 지표가 단기 변동과 장기 추세 모두를 포착하여 트레이더에게 시장의
**바이너리 스마트 시스템 소개: 귀하의 궁극적인 트레이딩 파트너** 바이너리 스마트 시스템은 단순히 인디케이터가 아닙니다. 이는 정교한 트레이딩 도구로, 다양한 시장에서 핀포인트 정확도와 적시의 신호를 제공하여 트레이더에게 성공을 이끌어주는 데 주안점을 둔 것입니다. 혁신적인 알고리즘과 다양한 기술적 지표의 철저한 컬렉션을 기반으로 구축된 이 시스템은 트레이딩 성공을 얻기 위한 열쇠입니다. **인디케이터 구성 요소:** 1. **이동 평균 비율 (MAP):** 이 구성 요소는 다양한 이동 평균의 가중 평균을 계산하여 추세 식별을 위한 강력한 기준을 형성합니다. MAP은 시장 상황에 동적으로 적응하여 현재 추세 방향을 파악하는 정보를 제공합니다. 2. **상품 채널 지수 (CCI):** 평균 가격으로부터의 편차를 분석함으로써 CCI는 과매수 및 과매도 조건을 판단합니다. 바이너리 스마트 시스템의 CCI 통합은 잠재적인 반전 지점을 식별하는 종합적인 접근을 보장합니다. 3.
소개: 바이너리 옵션과 외환 거래의 빠르게 변화하는 세계에서, 성공과 실패의 차이를 만들 수 있는 도구와 전략을 갖추는 것이 중요합니다. 이러한 도구 중 하나는 BBB 블랙 블루 바이너리 옵션 지표 시스템으로, 차트 패턴, 이동 평균, 거래량을 결합하여 거래자가 정보에 입각한 결정을 내릴 수 있도록 하는 혁신적인 접근 방식입니다. 이 포괄적인 가이드에서는 BBB 시스템의 세부 사항을 설명하고, 작동 방식, 언제 사용해야 하는지, 그리고 어떻게 하면 거래 성과를 향상시킬 수 있는지 설명합니다. BBB 지표 시스템 설명: BBB 블랙 블루 바이너리 옵션 지표 시스템은 바이너리 옵션과 외환 거래의 최적의 진입 및 퇴출 지점을 식별하는 데 도움이 되는 정교한 기술적 분석 도구입니다. 이 시스템은 "블랙"과 "블루"라는 주요 신호를 나타내는 기본 구성 요소에서 이름을 따왔습니다. 차트 패턴: BBB 시스템은 거래 차트의 계산된 부분을 분석하여 시작합니다. 이는 가격 행동에서 특정 패턴이나 형
메트로 역": 성공적인 자동 거래로의 길 "메트로 역"은 첨단 기법과 지능적인 알고리즘의 교차점에서 작동하는 선두주의적인 MT4 자동 거래 신호로, 정밀 거래의 세계로 진입할 수 있습니다. "메트로 역"은 이동 평균(MA), 상대 강도 지수(RSI), 스토캐스틱 오실레이터, 모멘텀 및 평균 방향 지수(ADX)의 힘을 활용하여 웰 인포메드 거래 신호를 생성합니다. 이는 지도를 찾는 초보 트레이더와 거래 과정을 간소화하려는 숙련된 트레이더 모두를 위해 설계되었습니다. "메트로 역"의 기능 핵심에는 이러한 중요한 기술적 지표를 결합하는 독특한 전략이 있으며, 데이터 기반 인사이트의 조화로운 수렴을 야기합니다. 이동 평균은 기본적인 트렌드 분석을 제공하며, 시장 소음을 걸러내고 가격 움직임의 실제 방향을 드러냅니다. 시장이 과매수 상태인지 과매도 상태인지 판단함으로써 RSI와 스토캐스틱 오실레이터는 가능한 반전이나 계속에 대한 예측을 돕는 추가적인 확증 수준을 제공합니다. 한편 모멘텀은 "
Forex 및 바이너리 옵션 성공을 위한 궁극적인 가이드: 비 다시 그리는 XY 트렌드 지표 공개 서론: Forex 및 바이너리 옵션 거래의 역동적인 세계에서 한발 앞선다는 것은 가장 중요합니다. 거래자들은 지속적으로 경쟁력 있는 우위를 제공할 수 있는 도구를 찾고 있으며, 거래 커뮤니티에서 파장을 일으키고 있는 그러한 강력한 도구 중 하나는 "비 다시 그리는 XY 트렌드" 지표입니다. 지표 이해: 비 다시 그리는 XY 트렌드 지표를 다른 지표와 구별하는 핵심 기능 중 하나는 정확성에 대한 약속입니다. 과거 신호를 다시 그려 거래자에게 신뢰할 수 없는 데이터를 남길 수 있는 다른 많은 지표와 달리 이 지표는 무결성을 유지합니다. 거래자는 생성되는 신호에 대해 자신감을 가질 수 있으며 이러한 신호가 과거 가격 움직임을 정확하게 반영하고 있음을 알 수 있습니다. XY 트렌드 지표는 고급 알고리즘을 사용하여 가격 데이터를 분석하고 시장의 트렌드를 식별합니다. 노련한 거래자든 초보 거래자든
빠르게 변화하는 금융 시장에서 모든 초는 중요하며 모든 결정은 거래를 성사시키거나 망칠 수 있습니다. 바이너리 해커 지표(Binary Hacker Indicator)는 분 단위로 가격 움직임을 분석하는 방식을 혁신할 준비가 된 획기적인 도구입니다. 거래의 정밀도 밝히기: 바이너리 해커 지표는 일반적인 거래 도구가 아닙니다. 실시간 분석기 역할을 하며 차트의 각 분을 분석하여 트레이더에게 귀중한 통찰력을 제공합니다. 광범위한 수동 분석이 필요한 기존 지표와 달리 바이너리 해커는 거래 전략에서 추측 작업을 제거하고 순수 데이터에 기반한 계산된 접근 방식을 제공합니다. 매 분의 힘: 거래의 매 분을 분석하고 매수와 매도 압력 사이의 복잡한 균형을 이해할 수 있다고 상상해보세요. 바이너리 해커를 통해 이러한 비전이 현실이 됩니다. 이 독창적인 지표는 시장을 지속적으로 모니터링하고 매 분마다 상승 틱과 하락 틱의 수를 계산하여 가격 액션의 본질을 쉽게 이해할 수 있는 정보로 정제합니다. 독특
제목: GOLDEN SUN 123 TREND_Dashboard_With_Alert MT4 지표 공개 끊임없이 변화하는 금융 시장에서 트레이더들은 지속적으로 경쟁력 있는 우위를 제공하는 도구를 찾고 있습니다. 정확성과 수익성을 추구하는 과정에서 GOLDEN SUN 123 TREND_Dashboard_With_Alert MT4 지표는 기회의 표지로 빛을 발합니다. MetaTrader 4 플랫폼을 위해 설계된 이 놀라운 지표는 추세 추종 기능과 경고 메커니즘을 통해 전략적 거래의 정수를 담고 있습니다. 추세의 힘 활용하기: GOLDEN SUN 123 TREND_Dashboard_With_Alert MT4 지표는 시장 추세를 식별하고 활용하기 위한 정교한 도구입니다. 트레이더들은 추세가 수익성 있는 거래의 핵심임을 이해하며, 이 지표는 바로 그러한 역할을 위해 정교하게 제작되었습니다. 이 지표는 시장을 끊임없이 검사하여 상승, 하락 또는 범위 추세인지 여부를 즉시 인식합니다. 명확성의 대시
Elon Musk EA는 MACD 수준, MACD 다이버전스, 숨겨진 MACD 다이버전스 및 지능형 마틴게일 전략을 기반으로 한 혁신적인 트레이딩 도구입니다. 이전과는 다른 트레이딩 경험을 준비하셨나요? Elon Musk EA를 함께 사용하면 MACD 수준, 다양한 MACD 다이버전스, 숨겨진 MACD 다이버전스 및 뛰어난 지능형 마틴게일 시스템의 잠재력을 발휘할 수 있습니다. 이러한 탁월한 요소들을 활용하여 이 EA는 야심찬 트레이더에게 완벽한 파트너가 될 것입니다. 제한을 깨고 가능성을 재정의하며 전례없는 금융적 성공을 향한 여행을 준비하세요. Elon Musk EA의 탁월한 점은 정확성과 적응성에 있습니다. 첨단 알고리즘과 철저한 시장 분석을 통해 MACD 수준을 탁월한 정확도로 감지하여 수익을 얻을 수 있는 최적의 타이밍을 포착할 수 있습니다. MACD 다이버전스 및 숨겨진 다이버전스를 활용하여 수익성이 높은 진입 및 청산 포인트를 식별하여 항상 경쟁자보다 한 발 앞설 수 있
T-REX_EA 는 MT4용으로 설계된 강력한 인공지능 기반의 트레이딩 로봇으로, 다양한 고급 전략을 결합하여 꾸준한 수익을 제공합니다. 이 EA는 AI 기술과 돌파 전략, 캔들 패턴, 볼륨 프로파일, 수요 및 공급 영역을 사용하여 시장을 분석하고, 트레이드 진입과 출구 시점을 최적화합니다. 주요 특징: 멀티 전략 접근법 : AI 분석과 전통적인 돌파 전략, 캔들 패턴 인식을 결합하여 강력한 트레이딩 우위를 제공합니다. 볼륨 프로파일과 수요/공급 구역 : 볼륨 데이터를 사용하여 높은 확률의 트레이드를 정확하게 식별합니다. 터보 모드 : 변동성이 큰 시장 상황에서 트레이드 빈도와 잠재적 수익을 높이는 특별한 기능입니다. 다양한 통화쌍 거래 가능 : EA는 모든 통화쌍에서 거래할 수 있지만, 특히 EUR/USD, GBP/USD, USD/JPY와 같은 주요 통화쌍에서 높은 수익을 기대할 수 있습니다. 유연한 거래 설정 : 최소 $500 의 잔액으로 거래를 시작할 수 있으며, 이는 작은 계
AI TRADING SYSTEM for MT4 - 당신의 궁극적인 AI 구동 이익 기계! AI TRADING SYSTEM 으로 거래의 미래를 해방하십시오. 이것은 최첨단 전문가 어드바이저(EA)로, 강력한 AI 구동 전략을 사용하여 모든 통화 쌍의 이익을 극대화합니다. 다양성을 위해 설계되었지만, EUR/USD, GBP/USD, USD/JPY와 같은 주요 쌍 에서 뛰어난 성능 을 발휘하여 시장에서 앞서 나갈 수 있습니다. AI TRADING SYSTEM 에는 두 가지 별개의 거래 모드 가 있어 거래 스타일과 수익 목표에 맞게 조정할 수 있습니다. BACIS 모드 - 최소한의 위험으로 꾸준하고 안정적인 이익을 위해 균형 잡힌 접근 방식을 찾는 거래자에게 완벽합니다. TURBO 모드 - 공격적인 고수익 전략으로 이익을 높이고 싶은 사람들에게 이상적이며, 시장 모멘텀을 포착하는 데 적합합니다. 주요 기능: 사용자 정의 설정 : 수익 실현(TP), 손절(SL), 로트 크기 및 마틴게일 옵션
Binary Smart Eye
Ramzi Abuwarda
"Binary Smart Eye" MT4 지표는 바이너리 옵션 및 외환 시장 모두에 거래 신호를 제공하도록 설계되었으며, M1에서 W1까지 광범위한 시간 프레임에서 작동합니다. 추세 수준, 지능형 이동 평균 및 최적화된 거래 기간을 결합한 독점적인 전략을 사용하여 잠재적인 진입점을 식별합니다. 주요 기능에 대한 분석은 다음과 같습니다. 다중 시간 프레임 분석: 지표의 다용도성은 트레이더가 다양한 시간 프레임에서 이를 활용하여 M1의 스캘핑부터 W1의 장기 추세 추종까지 다양한 거래 스타일에 맞출 수 있도록 합니다. 독점 전략: "Binary Smart Eye"의 핵심은 다음을 활용하는 고유한 전략에 있습니다. 추세 수준: 이러한 수준은 주요 시장 추세 및 잠재적인 반전 지점을 식별하는 데 도움이 됩니다. 지능형 이동 평균: 시장 변동성에 적응하고 정확한 추세 방향을 제공하는 사용자 정의 이동 평균입니다. 스마트 거래 기간: 지표는 최적의 시장 조건을 포착하기 위해 특정 시간 기간을
Traffic Signal
Ramzi Abuwarda
혁신적인 MT5 지표 '트래픽 신호'를 소개합니다 - 성공적인 트레이딩 세계로의 문을 열어드립니다! 정확성과 전문지식을 바탕으로 설계된 이 혁신적인 지표는 RSI, 스토캐스틱, CCI 및 모든 시간프레임의 트렌드 분석에 기반한 특별한 전략으로 가장 정확한 진입 신호를 생성합니다. 트래픽 신호는 무적의 자신감으로 시장을 탐색할 수 있도록 최상의 정확성을 제공합니다. 트래픽 신호를 통해 가장 수익성 높은 트레이딩 기회를 감지하기 위해 정밀하게 조정된 주요 기술적 지표의 철저한 분석에 접근할 수 있습니다. 불확실성에 작별을 고하고 정보 기반의 의사 결정의 새로운 시대를 맞이하세요. RSI, 스토캐스틱, CCI 및 트렌드의 잠재력을 트래픽 신호 내에서 완벽하게 융합하여 전례없는 시장의 역학을 생생하게 그려냅니다. 트래픽 신호를 통해 시장의 트렌드와 패턴을 쉽게 탐색하면서 모든 시간프레임을 주시할 수 있습니다. 단기적인 고조 또는 장기적인 전략적 플레이를 선호하든지, 이 뛰어난 지표는 여러분
Forex RoadMap
Ramzi Abuwarda
ROADMAP: 완벽한 거래 실행을 위한 귀하의 궁극적인 MT5 Forex 인디케이터! Forex 시장에서 지속적인 불확실성과 추측 작업에 지쳤나요? 정확한 진입 지점, 매수 및 매도 구간을 식별하거나 정확한 손실 제한과 이익 실현 수준을 설정하는 것이 어려운가요? 더 이상 찾지 마세요! ROADMAP은 혁신적인 MT5 Forex 인디케이터로 귀하의 거래 전략을 혁신할 수 있도록 지원합니다. ROADMAP은 특별한 전략으로 설계되어 Forex 시장을 돌파하는 데 필수적인 통찰력과 정확한 계산을 제공합니다. 이 탁월한 인디케이터는 Fibonacci(FIBO) 레벨을 포함한 고급 기술의 조합을 활용하여 최적의 거래 결정을 돕습니다. ROADMAP을 통해 뛰어난 정확성으로 시장 역학을 종합적으로 파악할 수 있으며, 이상적인 진입 영역을 정확하게 식별할 수 있습니다. 이는 수익성이 높은 기회를 놓치지 않고 조기에 거래에 참여할 수 있음을 의미합니다. 이 인디케이터의 창의적인 알고리즘은 시장
통화 마술사 매트릭스 인디케이터란 무엇인가요? 통화 마술사 매트릭스 인디케이터는 통화의 강도를 보여주는 그래픽 도구입니다. 일반적인 인디케이터는 보통 다른 통화와의 상대적인 강도를 보여줍니다. 그러나 일부 계산을 통해 각 개별 통화의 절대 강도를 찾아낼 수 있습니다. 따라서 통화 마술사 매트릭스 인디케이터(또는 미터)는 통화의 절대적인 강도를 표현하기 위한 도구로, 이 강도를 다른 통화의 강도와 비교할 수 있습니다. 통화의 절대 강도를 계산하는 방법은 여러 가지가 있지만, 일반적으로 다른 인디케이터의 모든 값들을 고려하여 추출하려고 합니다. 다시 말해, 예를 들어 JPY의 강도를 계산하기 위해 알고리즘은 JPY를 포함하는 모든 통화쌍에서 동일한 인디케이터의 값들을 분석합니다. 이 개념은 통화 마술사 매트릭스에 처음 접하는 경우에는 약간 혼란스러울 수 있지만, 걱정하지 마세요. 계속 읽다보면 이해하게 될 것입니다. 통화 마술사 매트릭스는 8개 주요 통화의 강도를 측정하기 위해 개발된
Darwin Assistant
Ramzi Abuwarda
혁신적인 MT5 지표인 DARWIN Assistant   을 소개합니다. 성공적인 거래의 세계로 가는 궁극적인 관문입니다! 정확성과 전문성으로 설계된 DARWIN Assistant   은 RSI, 스토캐스틱, CCI 및 추세와 같은 고급 기술 지표의 힘을 모든 시간대에 걸쳐 활용하는 특별한 전략에 따라 운영됩니다. 이 최첨단 지표는 진입을 위한 가장 정확한 신호를 제공하므로 비교할 수 없는 확신을 가지고 시장을 탐색할 수 있으므로 특별한 거래 경험에 대비하십시오. DARWIN 트래픽을 사용하면 가장 수익성이 높은 거래 기회를 감지할 수 있도록 세심하게 보정된 중요한 지표에 대한 포괄적인 분석에 액세스할 수 있습니다. 불확실성에 작별을 고하고 정보에 입각한 의사 결정의 새로운 시대를 맞이하십시오. RSI, Stochastics, CCI 및 Trends가 DARWIN Assistant   내에서 원활하게 수렴되어 전례 없는 시장 역학을 생생하게 보여줍니다. DARWIN Assist
필터:
리뷰 없음
리뷰 답변