Forex RoadMap

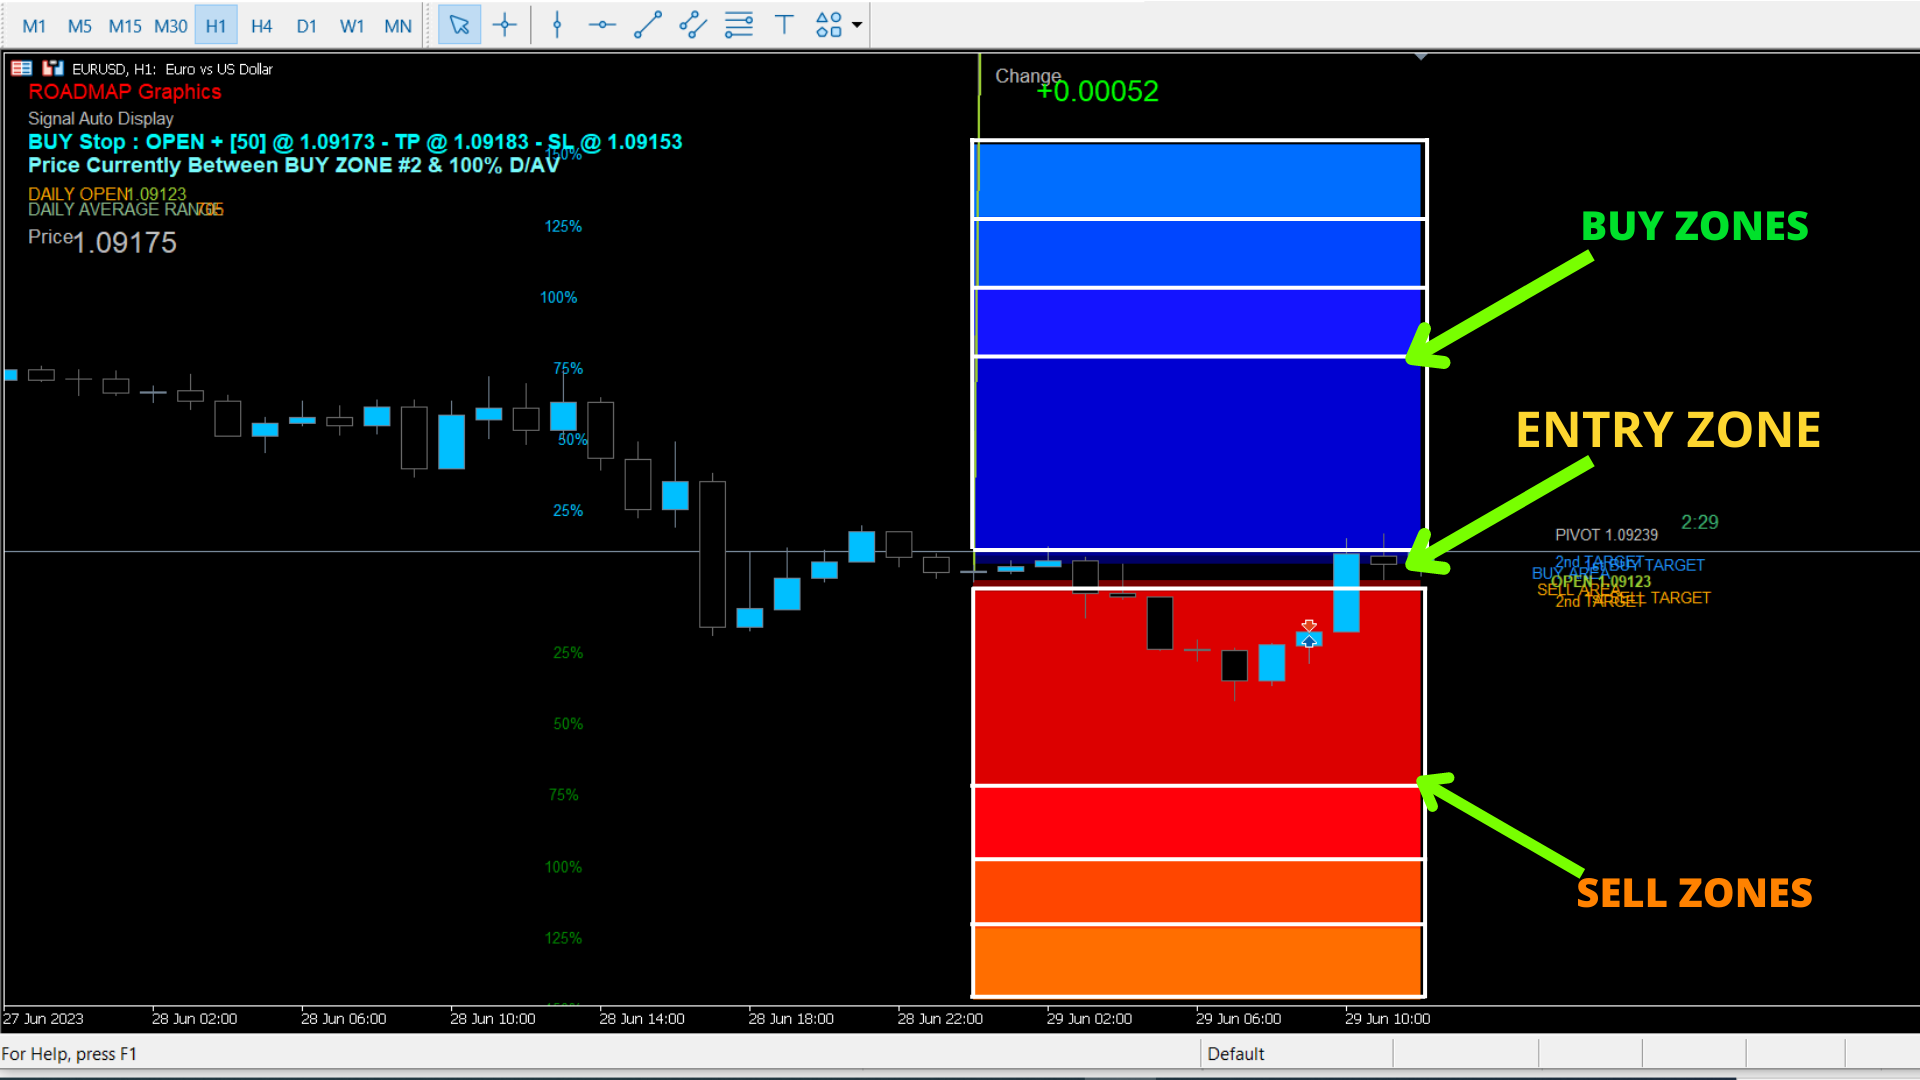
ROADMAP: 완벽한 거래 실행을 위한 귀하의 궁극적인 MT5 Forex 인디케이터!

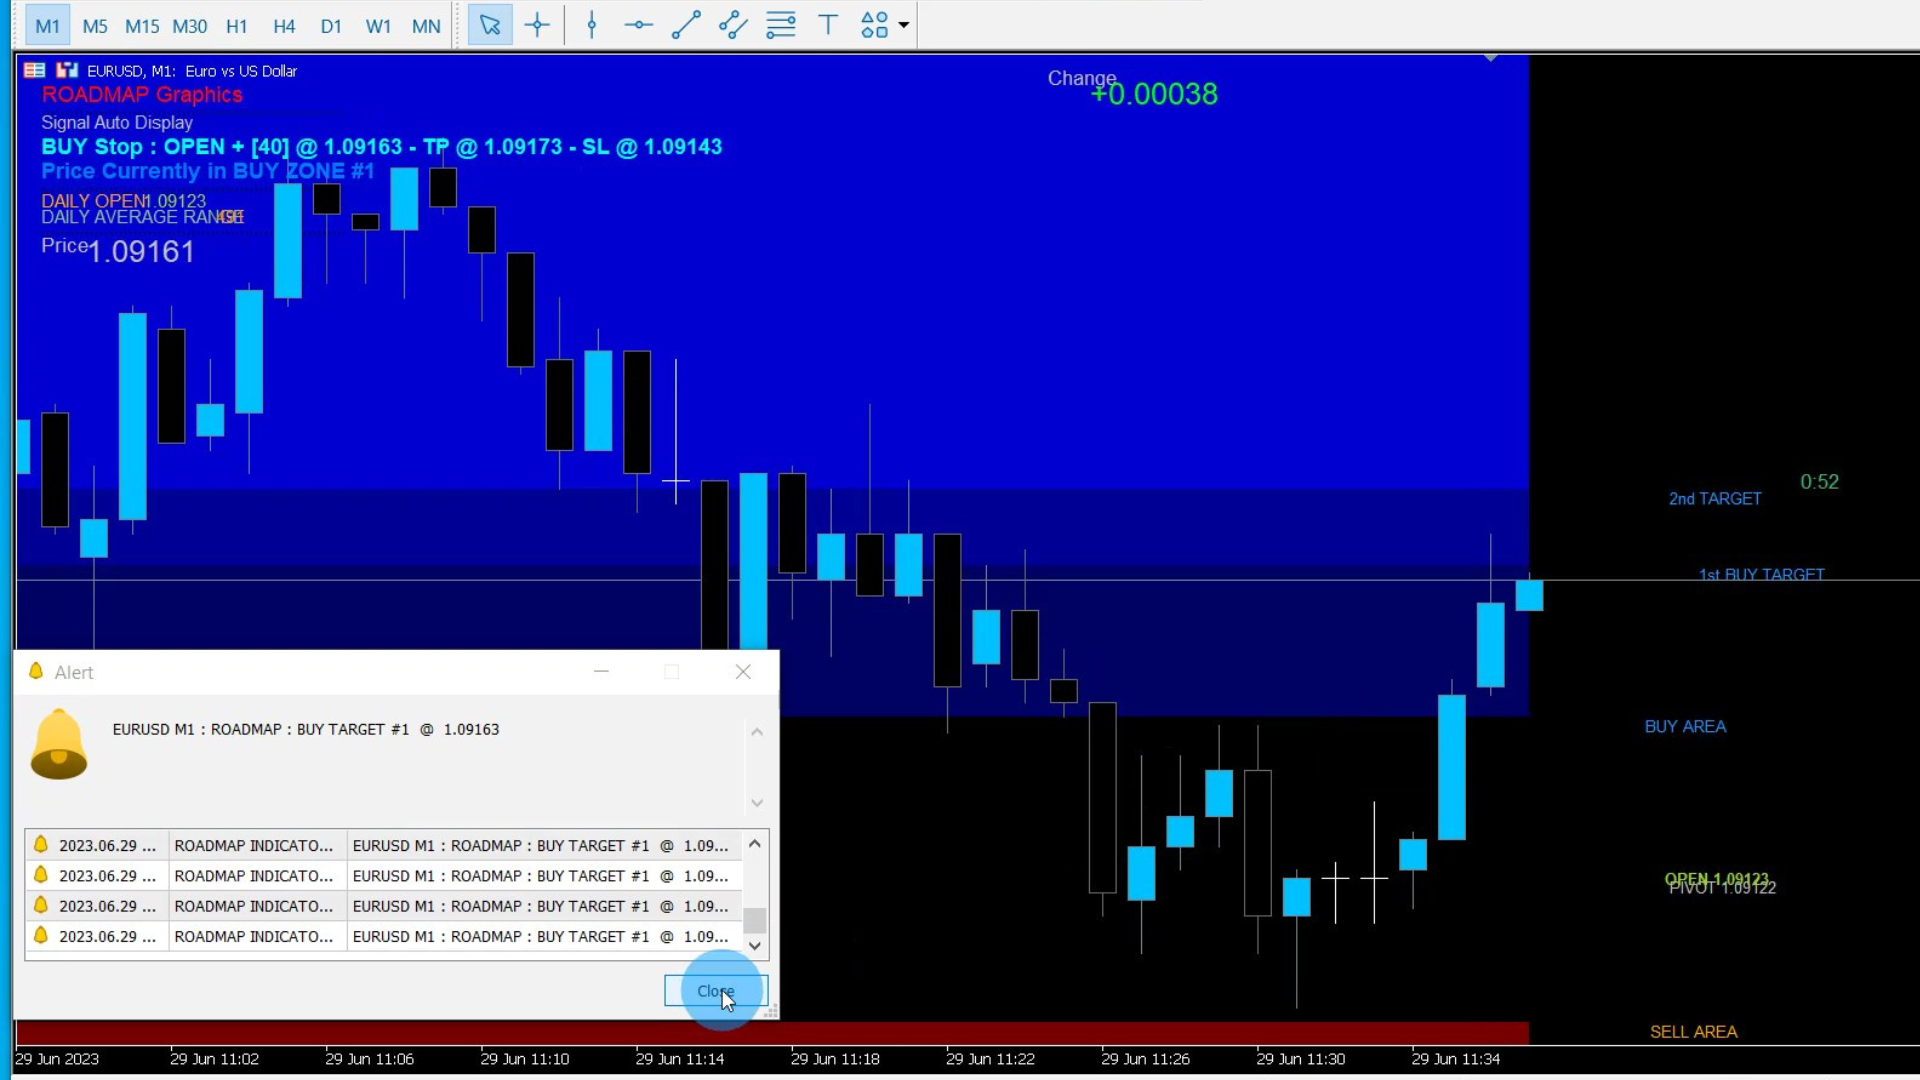
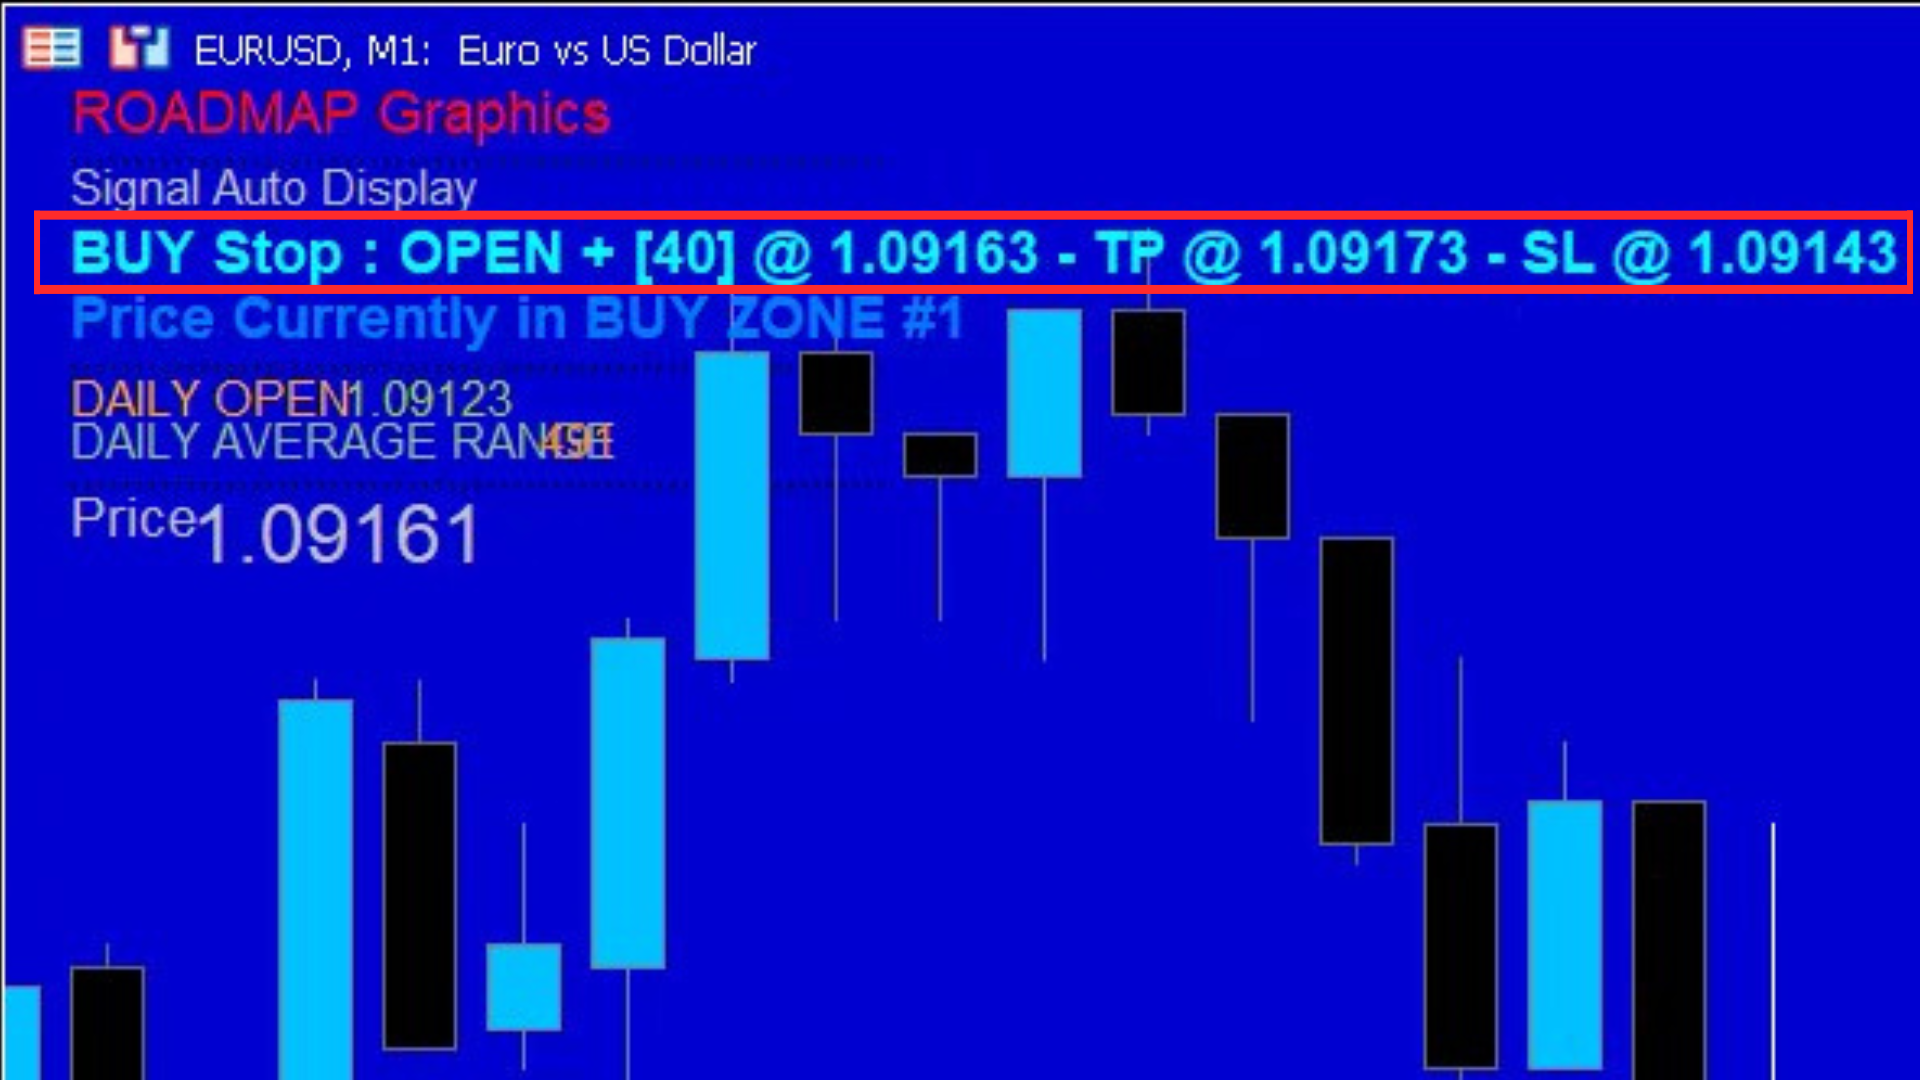
Forex 시장에서 지속적인 불확실성과 추측 작업에 지쳤나요? 정확한 진입 지점, 매수 및 매도 구간을 식별하거나 정확한 손실 제한과 이익 실현 수준을 설정하는 것이 어려운가요? 더 이상 찾지 마세요! ROADMAP은 혁신적인 MT5 Forex 인디케이터로 귀하의 거래 전략을 혁신할 수 있도록 지원합니다.

ROADMAP은 특별한 전략으로 설계되어 Forex 시장을 돌파하는 데 필수적인 통찰력과 정확한 계산을 제공합니다. 이 탁월한 인디케이터는 Fibonacci(FIBO) 레벨을 포함한 고급 기술의 조합을 활용하여 최적의 거래 결정을 돕습니다.

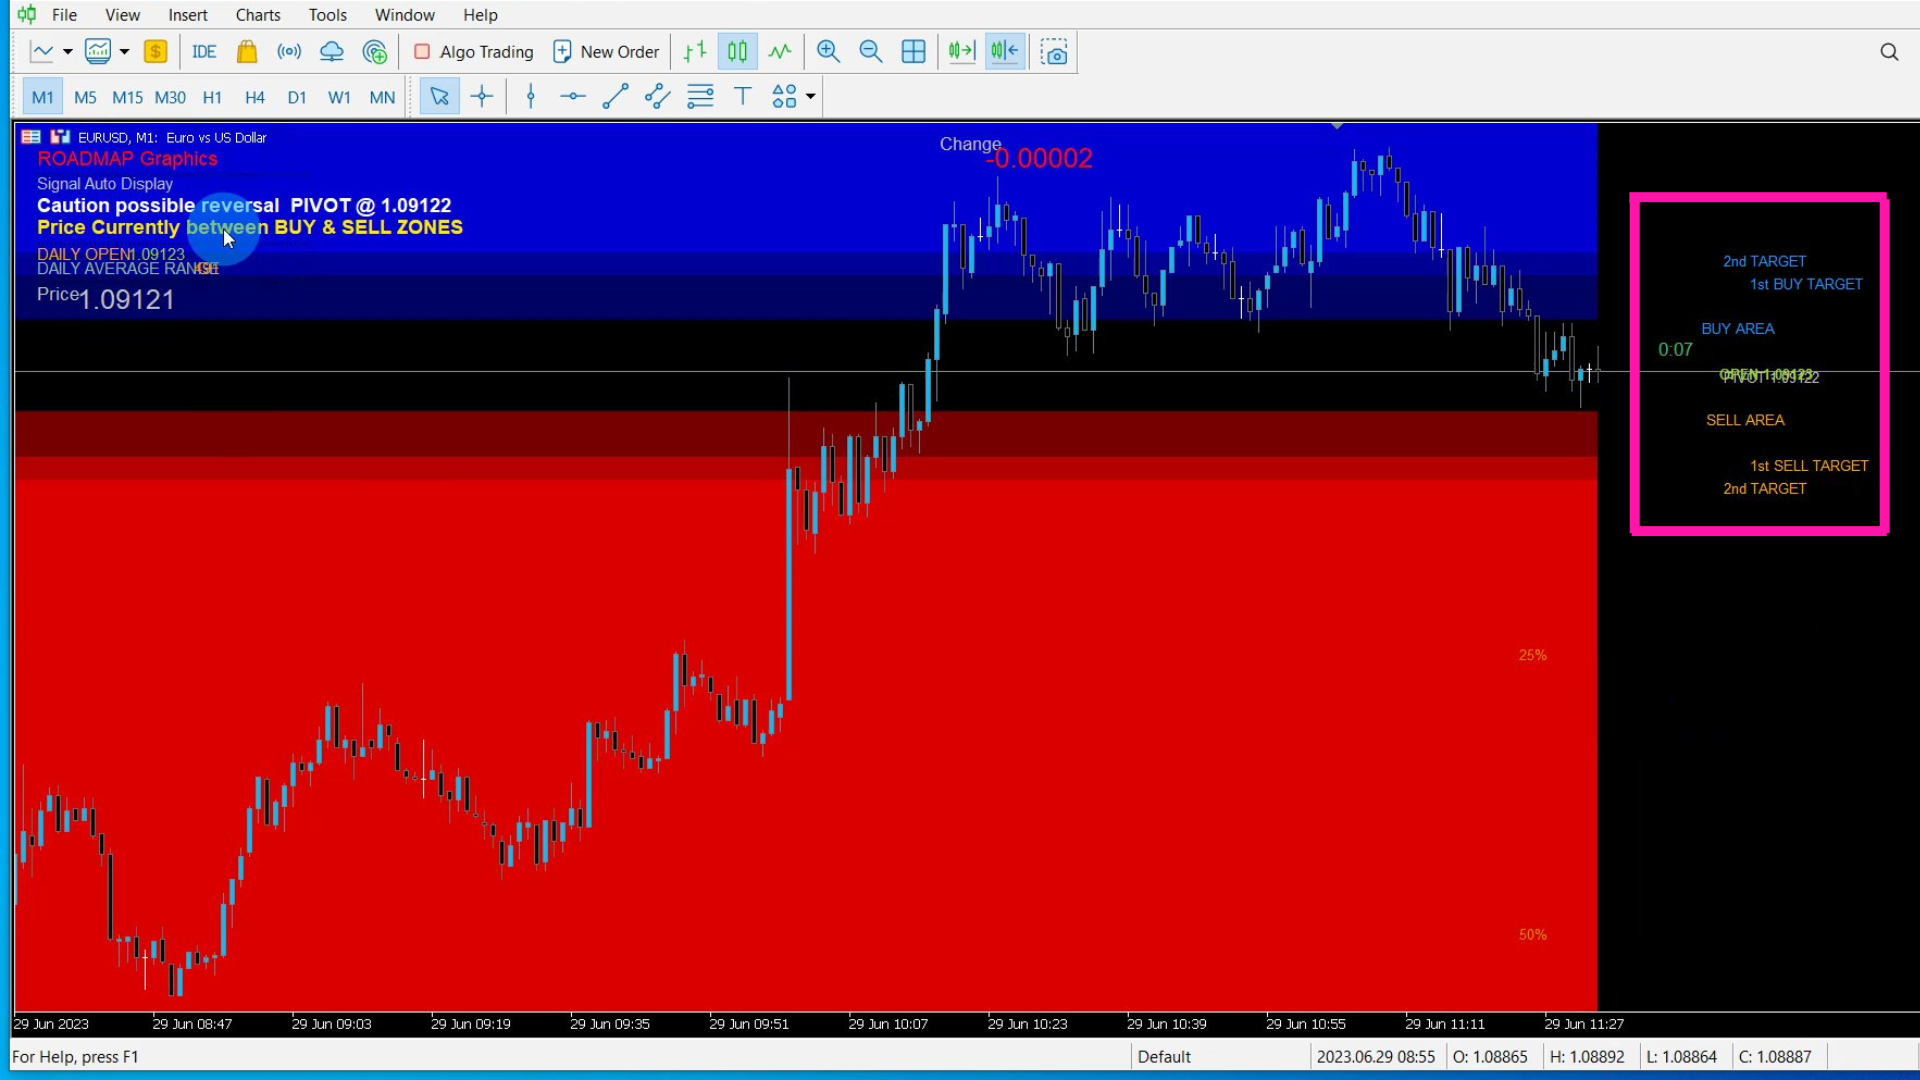
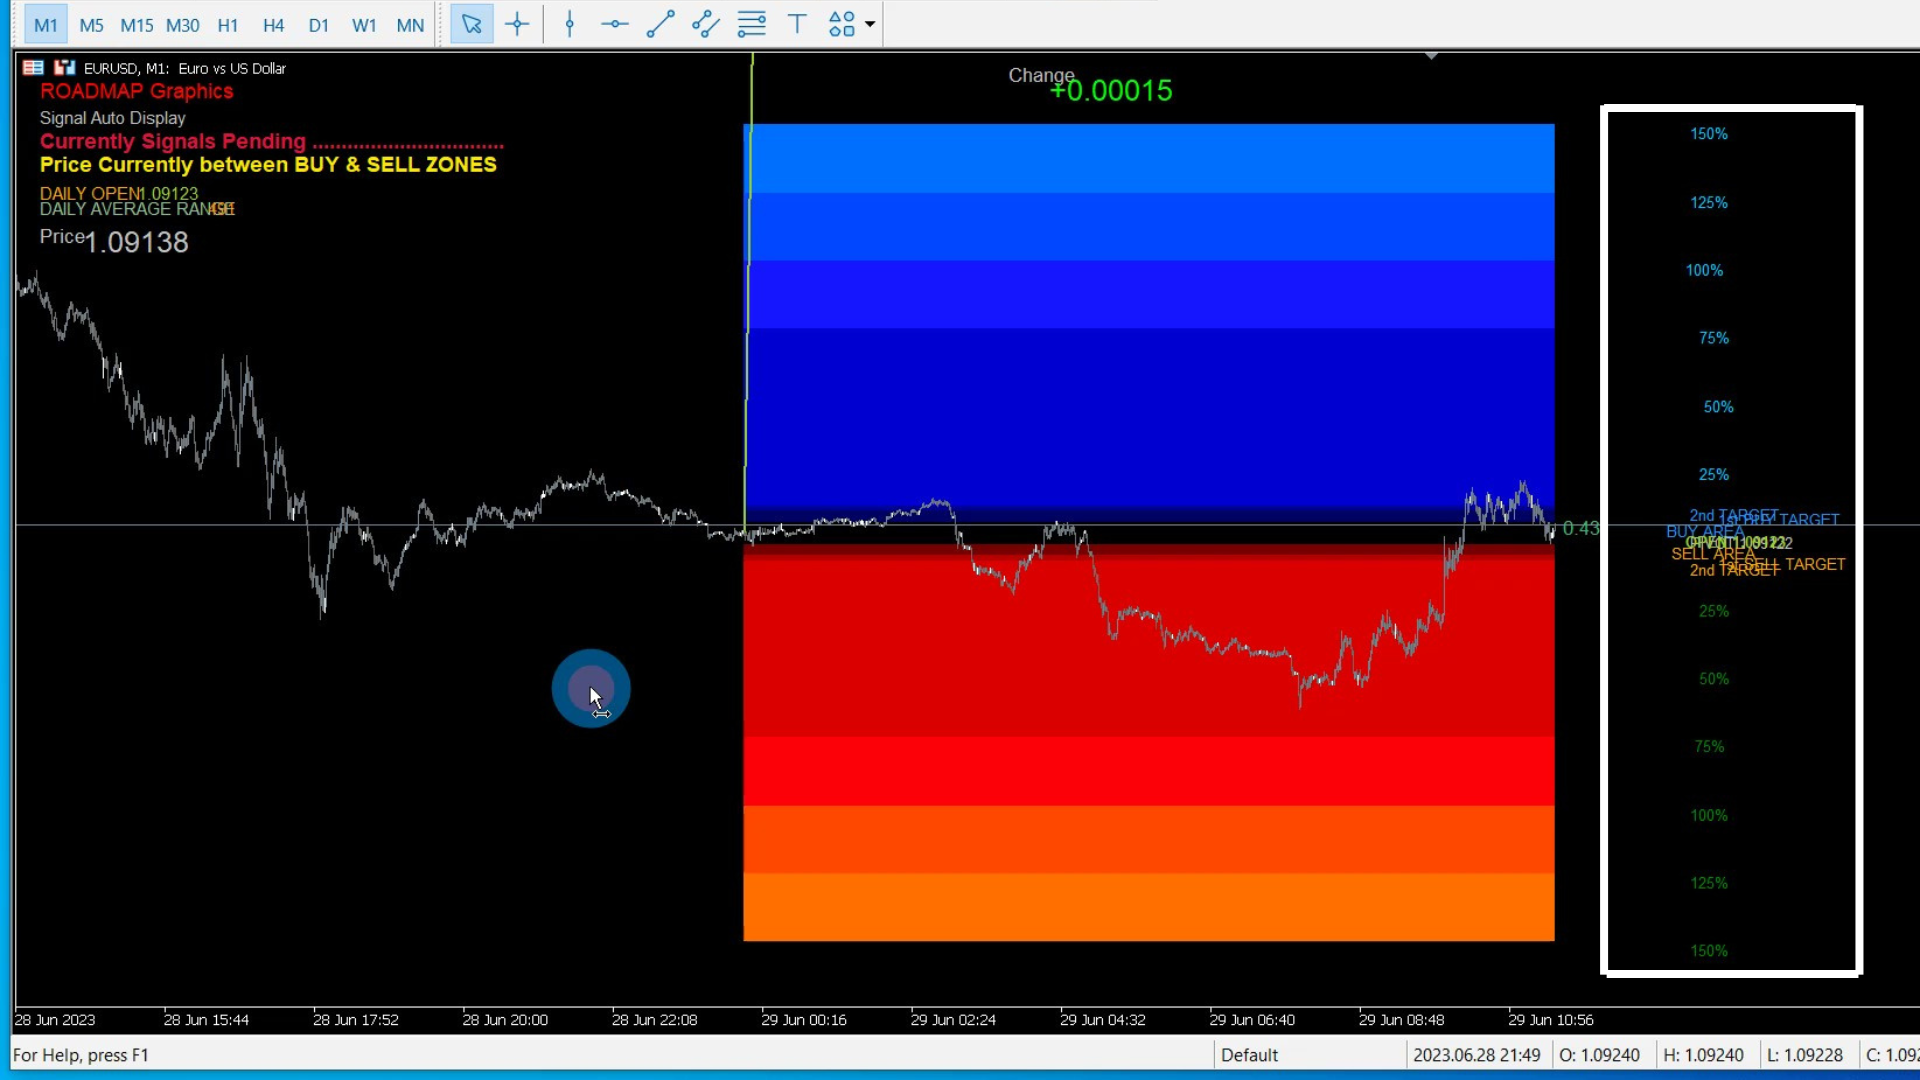
ROADMAP을 통해 뛰어난 정확성으로 시장 역학을 종합적으로 파악할 수 있으며, 이상적인 진입 영역을 정확하게 식별할 수 있습니다. 이는 수익성이 높은 기회를 놓치지 않고 조기에 거래에 참여할 수 있음을 의미합니다. 이 인디케이터의 창의적인 알고리즘은 시장 조건이 원하는 거래 매개변수와 일치하는 순간을 정확히 파악하여, 시장의 리듬에 항상 맞출 수 있도록 도와줍니다.

임의로 손실 제한과 이익 실현 수준을 설정하는 번거로움을 이제 안녕하세요. ROADMAP은 FIBO 레벨을 기반으로 정확한 손실 제한, TP1 및 TP2를 정확하게 계산하여 이 과정을 대신해 줍니다. 이 스마트한 기능은 거래를 안전하게 지켜주며, 위험을 최소화하고 이익 가능성을 극대화합니다. ROADMAP이 함께하는 거래에서 자신감을 가지고 거래할 수 있습니다.

하지만 ROADMAP은 여기에서 그치지 않습니다. 이 인디케이터는 일일 최고가와 최저가를 표시하여 시장 심리를 종합적으로 파악할 수 있습니다. 이 귀중한 정보를 활용하여 거래 결정을 미세 조정할 수 있으며, 동적인 금융 환경에서 항상 앞서 나갈 수 있습니다.

거래 경험을 더욱 원활하게 만들기 위해 ROADMAP은 실시간 거래 알림을 직접 제공합니다. 진입 지점, TP1, TP2 및 손실 제한 수준에 대한 알림을 통해 언제든지 수익성 높은 거래 기회를 놓치지 않습니다. 거래 책상 앞이든 이동 중이든, ROADMAP은 항상 정보를 제공하여 수익성 있는 거래 기회를 즉시 이용할 수 있도록 합니다.

ROADMAP의 힘을 경험하고 전체 거래 잠재력을 발휘하세요. 더 이상 추측 작업이나 감정적인 결정에 고민하지 마세요. 이 혁신적인 MT5 Forex 인디케이터를 신뢰할 수 있는 동반자로 삼아 일관된 이익과 재정적인 성공을 향한 여정을 시작하세요!

더 이상 기다리지 마세요. ROADMAP을 사용하여 거래자들의 성공적인 행렬에 합류하세요. 오늘부터 Forex 숙달을 위한 여정을 시작하세요!


추천 제품
Manyal trading system, CovEchoTrend Robot, focuses on reliability and flexibility. By employing statistical analysis methods to study the relationships between the base indicator and market patterns, the system enables a deeper understanding of market processes. Intelligent pattern analysis: The application of statistical data processing helps identify key trend reversal points more accurately, signaling significant market shifts. Informed decision-making is based on the intersection of indicato
Urgently mt5
Tatiana Savkevych
The Urgently indicator is designed to quickly determine the situation in the market, reflect the state of the market and signal profitable levels for opening trades. Market conditions change quickly enough, requiring constant calibration of trading strategies. Recommended for use in conjunction with any of the oscillators. The Urgently forex market trend indicator shows the trend direction and entry points. It smooths out price fluctuations when generating a signal by averaging the data and the
Limitless MT5
Dmitriy Kashevich
Limitless MT5 is a universal indicator suitable for every beginner and experienced trader. works on all currency pairs, cryptocurrencies, raw stocks Limitless MT5 - already configured and does not require additional configuration And now the main thing Why Limitless MT5? 1 complete lack of redrawing 2 two years of testing by the best specialists in trading 3 the accuracy of correct signals exceeds 80% 4 performed well in trading during news releases Trading rules 1 buy signal - the ap
GorMaster Pro
Manuel Damian Ortiz Fernandez
GorMaster_Pro — Sesgo confiable, noticias y técnica en una sola pantalla Visión GorMaster_Pro es una herramienta indispensable para cualquier tipo de trader (scalper, intradía o swing) porque combina información fundamental y técnica para darte una lectura fiel y accionable del mercado. En una sola vista verás: sesgo direccional BUY/SELL/RANGO , ventanas de noticias en tiempo real que congelan la operativa, métricas técnicas clave (ATR_Z, RangeRatio, ADX, SpreadZ), sesiones y alertas . Todo org
Visual Range Directional Force Indicator
AL MOOSAWI ABDULLAH JAFFER BAQER
Range Directional Force Indicator – Designed for You to Optimize! The Range Directional Force Indicator is a cutting-edge tool designed to empower traders by visualizing market dynamics and directional strength. Built to offer insights into market trends and reversals, this indicator is an invaluable asset for traders seeking precision in their strategies. However, it is important to note that this indicator is not optimized, leaving room for you to tailor it to your unique trading preferences.
Deriv Boom sell
Yaovi Inoussa Atchou
Our BOOM SELL ALERT indicator is specifically engineered to   take candles on BOOM 1000 , BOOM 500 is tool is optimized for M1 (1-minute) timeframe, ensuring you receive timely and actionable insights.   The indicator is a combination of   many indicators. -        AO Oscillator -        Stochastic   HOW TO USE THIS INDICATOR To use well this indicator , it   need to use SCHAFF TREND RSX ( 5 MIN OR M5) IF SCHAFF trend RSX is GREEN and you have a signal then SELL when you have ENTRY and out with
Manus Pro
Itumeleng Mohlouwa Kgotso Tladi
MANUS PRO EA The Trading Revolution You've Been Waiting For Are you TIRED of watching other traders make consistent profits while your account bleeds red?   The financial markets don't wait for anyone – and neither should you. MANUS PRO isn't just another Expert Advisor... it's your   TICKET TO FINANCIAL FREEDOM . Why MANUS PRO is Different (And Why Everyone's Talking About It) FOR BEGINNERS: Your Trading Mentor That Never Sleeps Zero Learning Curve   – Install, activate, and watch it wo
The new update makes this indicator a complete tool for studying, analyzing and operating probabilistic patterns. It includes: On-chart Multi-asset percentage monitor. Configurable martingales. Twenty-one pre-configured patterns, including Mhi patterns and C3. An advanced pattern editor to store up to 5 custom patterns. Backtest mode to test results with loss reports. Trend filter. Hit operational filter. Martingale Cycles option. Various types of strategies and alerts. Confluence between patter
Turn your chart into a professional trading dashboard that shows where price is flowing and when the next shock is coming —without loading a single extra window. This indicator combines a price-following MA ribbon with a live news radar directly on the chart, giving you both trend and event risk in one glance. Trend Ribbon – Read the market bias instantly A smooth, step-style moving average ribbon follows price action bar by bar. Color change shows the active trend: aqua for bullish flow , gold
Medias colors
Sergio Domingues
O indicador media colors se baseia num canal que pode ser criado a partir de duas médias Media colors  é um indicador de tendência utilizado no trading para identificar a direção predominante do mercado. Pode ser baseado na Média Móvel Simples (SMA) e na  Média Móvel Exponencial  (EMA) que dá mais peso aos preços mais recentes, tornando-a mais sensível às mudanças de preço. Como Funciona: Cálculo:   A EMA é calculada aplicando um fator de suavização aos preços de fechamento de um ativo financeir
My Trendline
Ashok Kumar Singha
My Trendline is an Indicator based on Upper and Lower Trendline which will Plot Automatically into the Chart. This Indicator will perfectly indicate you the Trend of the Market. It can be use in any Time Frame. The Indicator will automatically adjust according to the Current Time Frame. Steps to Setup the Indicator: Install the Custom Indicator; Set all the Inputs, Line Color, Width and Styles etc. (Can use the Default Setting also); Set visualization to All Timeframe; and DONE It can
First time on MetaTrader, introducing IQ Star Lines - an original Vedic Astrology based indicator. "Millionaires don't use astrology, billionaires do" . - J.P. Morgan, Legendary American financier and banker. IQ Star Lines, an unique astrological indicator purely based on   Vedic astrology   calculations, published for the   first time on Metatrader.  This unique tool plots dynamic planetary grid lines based on real-time stars, constellations, and celestial movements, which allows you to plot t
AanIsnaini Signal Matrix MT5 PRO Institutional-Grade Market Regime & Trend Dashboard (Zero-Repaint) STOP TRADING WITH LAG. START TRADING WITH MATH. The free version (v1.3) gave you visibility. The PRO Version gives you the edge . AanIsnaini Signal Matrix PRO is not just an update—it is a complete algorithmic rewrite of my popular signal dashboard. While the free version relies on standard indicators (which lag and react slowly), the PRO version utilizes  Digital Signal Processing (DSP) , Zero-L
MA Catcher Pro
Tiago Muniz Glicerio
MA Catcher Pro - 2025 Edition ===================================== Indicator Type: Moving Average Crossover Alert (MetaTrader 5) Version: 1.0 (2025) Platform: MetaTrader 5 (.mq5) -------------------------------------------------------------- OVERVIEW -------------------------------------------------------------- MA Catcher Pro is a professional-grade trend detection indicator that alerts you whenever a Fast Moving Average crosses a Slow Moving Average.  It provides visual, sound, and push not
MarketMagnet
Kelly Adediran Raymond
Are you ready to take your trading journey to new heights? Look no further than MarketMagnet, this groundbreaking indicator designed to propel your trading success with excitement and accuracy. Powered by the convergence of Momentum and CCI (Commodity Channel Index), MarketMagnet equips traders with the ultimate tool to determine direction and entry prices for a wide range of recommended currency pairs and instruments. It is designed for traders seeking to scalp for a few pips on lower timeframe
통화 마술사 매트릭스 인디케이터란 무엇인가요? 통화 마술사 매트릭스 인디케이터는 통화의 강도를 보여주는 그래픽 도구입니다. 일반적인 인디케이터는 보통 다른 통화와의 상대적인 강도를 보여줍니다. 그러나 일부 계산을 통해 각 개별 통화의 절대 강도를 찾아낼 수 있습니다. 따라서 통화 마술사 매트릭스 인디케이터(또는 미터)는 통화의 절대적인 강도를 표현하기 위한 도구로, 이 강도를 다른 통화의 강도와 비교할 수 있습니다. 통화의 절대 강도를 계산하는 방법은 여러 가지가 있지만, 일반적으로 다른 인디케이터의 모든 값들을 고려하여 추출하려고 합니다. 다시 말해, 예를 들어 JPY의 강도를 계산하기 위해 알고리즘은 JPY를 포함하는 모든 통화쌍에서 동일한 인디케이터의 값들을 분석합니다. 이 개념은 통화 마술사 매트릭스에 처음 접하는 경우에는 약간 혼란스러울 수 있지만, 걱정하지 마세요. 계속 읽다보면 이해하게 될 것입니다. 통화 마술사 매트릭스는 8개 주요 통화의 강도를 측정하기 위해 개발된
Adjustable Consecutive Fractals  looks for 2 or more fractals in one direction and sends out a on screen alert, sound alert and push notification, for strong reversal points . Adjustable Consecutive Fractals, shows the fractals on chart along with a color changing text for buy and sell signals when one or more fractals appear on one side of price. Adjustable Consecutive Fractals is based Bill Williams Fractals . The standard Bill Williams fractals are set at a non adjustable 5 bars, BUT withe th
WanaScalper
Isaac Wanasolo
1 (1)
A scalping indicator based on mathematical patterns, which on average gives signals with relatively small SL, and also occasionally helps to catch big moves in the markets (more information in the video) This indicator has three main types of notifications: The first type warns of a possible/upcoming signal on the next bar The second type indicates the presence of a ready signal to enter the market/open a position The third type is for SL and TP levels - you will be notified every time price re
Introducing to your attention the unique trading system/indicator "Scaled Vidya Trends", designed for dynamic scalp trading on trend volatility pairs hour + timeframes. Main features of Scaled Vidya Trends: -Multi-level market analysis: it works on H1, H2, H3 timeframes; -Uses the most popular currency pairs: EURUSD, GBPUSD, USDCAD. Brokers usually set one of the lowest spreads for these pairs; -Applies a scalping method based on local targets for signals; -Signals appears at the new open of
Poc SR Volume
Teresinha Moraes Correia
SR POC VOLUME 지표는 MetaTrader 5용으로 설계되었으며, 사용자가 설정한 되돌아보기 기간 동안 캔들 데이터에서 컨트롤 포인트(POC)를 식별, 그룹화 및 시각화하는 기능을 제공합니다. 이 지표의 목적은 누적 거래량과 델타 분포를 기반으로 지지 및 저항 영역을 체계적으로 식별하여 거래자가 시장에서 중요한 관심 영역을 보다 명확하게 이해할 수 있도록 하는 것입니다. 주요 기능 POC 계산 지표는 지정된 되돌아보기 기간 내 각 캔들에 대해 POC를 계산합니다. POC는 캔들의 최고가와 최저가의 중간점으로 정의됩니다. 각 POC에는 델타 값이 연관되며, 델타는 틱 볼륨과 방향 편향에 기반합니다(종가가 시가보다 높으면 양수, 그렇지 않으면 음수). 델타 값은 매수자와 매도자 간의 방향 불균형을 강조하기 위해 스케일링됩니다. 클러스터 형성 POC는 사용자가 정의한 가격 백분율 허용 오차를 기준으로 클러스터로 그룹화됩니다. 허용 오차는 POC가 동일한 클러스터로 간주되기 위해
Tragos
David Chokumanyara
TRAGOS Indicator – The GOAT of All Trading Indicators TRAGOS (Greek for “male goat”) isn’t just a name — it’s the GOAT: Greatest of All Time in trading indicators. Designed for Forex, Indices, Gold, Crypto, and Deriv Synthetic Indices (Boom & Crash, Volatility 75, Step, Jump, etc.), it gives you non-repainting buy, sell, and exit signals with unmatched clarity. Why TRAGOS? Non-Repainting Signals – 100% reliable. Audible, Email & Push Alerts – Never miss a trade. Trend Following – Rid
Go Way TREND
Ywsf Hsyn Hmad Alrsh
추세와 함께 가십시오. 네, 15분 프레임에 매수든 매도든 진입 신호를 기다리고, 30분 프레임에 신호가 나타나는지 확인하세요(때때로 신호가 나타나는 데 1시간 이상이 소요됩니다. 돌아올 수 있습니다) 15분 프레임으로 갔다가 30분 프레임으로 돌아가서 메인 시그널이 나타날 때까지 이를 반복합니다. 30분 프레임에 시그널이 나타나면 가격을 가지고 진입하여 선이 바뀔 때 수익을 얻습니다. , 이익이 기록되거나 반대 신호가 나타나는 경우 매우 간단하며 모든 주요 통화에서 작동합니다.  금속, 표시기, 모든 프레임이지만 가장 좋은 결과는 30분 프레임입니다. 항상 캔들 바닥 아래에 스톱로스를 설정하고 자본 관리를 초과해서는 안 됩니다. 자본금의 10% 추세와 함께 가십시오. 네, 15분 프레임에 매수든 매도든 진입 신호를 기다리고, 30분 프레임에 신호가 나타나는지 확인하세요(때때로 신호가 나타나는 데 1시간 이상이 소요됩니다. 돌아올 수 있습니다) 15분 프레임으로 갔다가 30분 프
Price DNA MT5
Ruben Octavio Gonzalez Aviles
Price DNA는 복합비율 가중이동평균을 사용해 시차를 줄이고 추세를 조기에 감지할 수 있는 추세 지표입니다. 이 지표는 다시 칠하지 않으며 모든 기간의 모든 금융상품에 적용할 수 있습니다. Price DNA는 어떻게 작동하나요? 표시기는 차트에 현재 거래의 방향을 나타내는 여러 개의 파동을 표시합니다. 녹색 또는 빨간색 파동 5개는 각각 강한 강세 또는 약세 추세를 나타냅니다. 개별 트레이딩 스타일에 따라 모든 파동 또는 특정 수의 파동이 추세 반전을 나타낼 때 포지션을 개시 또는 청산하도록 선택할 수 있습니다. 상승 및 하락 파동 수는 항상 단말기 왼쪽 상단에 표시됩니다. 설정 각 개별 DNA 파동의 주기를 조정하여 더 공격적이거나 더 신중한 트레이딩 스타일에 맞게 가격 DNA 인디케이터를 조정할 수 있습니다. 웨이브 1 기간: 첫 번째 웨이브의 기간 웨이브 2 기간: 두 번째 물결의 기간 제3파 기간: 세 번째 물결의 기간 제4파 기간: 네 번째 물결의 기간 제5파 기간:
SMC Venom Model BPR 지표는 Smart Money(SMC) 개념 내에서 일하는 트레이더를 위한 전문 도구입니다. 가격 차트에서 두 가지 주요 패턴을 자동으로 식별합니다. FVG (공정 가치 갭)는 3개의 캔들의 조합으로, 첫 번째와 세 번째 캔들 사이에 갭이 있습니다. 이는 볼륨 지원이 없는 레벨 사이에 구역을 형성하여 종종 가격 수정으로 이어집니다. BPR (균형 가격 범위)은 두 개의 FVG 패턴의 조합으로, "브리지"를 형성합니다. 이는 가격이 낮은 볼륨 활동으로 움직일 때 브레이크아웃과 레벨로의 복귀 구역으로, 캔들 사이에 갭을 생성합니다. 이러한 패턴은 거래자가 차트에서 거래량과 가격 역학을 분석하여 주요 지지/저항 수준, 돌파 구역 및 진입 지점을 식별하는 데 도움이 되며, 여기서 대형 시장 참여자와 일반 참여자 간의 상호 작용이 발생합니다. 이 지표는 사각형과 화살표 형태로 패턴을 시각화하며 유연한 경고 설정도 지원합니다. 주요 특징: 패턴 표시 모드
Introduction to the Manual Backtesting Indicator on MQL5 The MetaTrader platform provides an excellent backtesting tool for evaluating Expert Advisors (EAs). However, when it comes to manually backtesting a strategy to assess its effectiveness, this tool has some limitations: You cannot manually draw zones or trend lines while in backtesting mode. You cannot switch timeframes to check time alignment. For example, if my strategy requires additional confirmation from a higher timeframe (HTF), this
Receive notifications for multi-trendline or single trendline breakout. Yes! You heard us right!  You will be notified the moment price crosses any and all the timeframe trendlines that you have chosen.  1.    ADDING MULTIPLE OR SINGLE TRENDLINES IN THE SAME DIRECTION To trigger a stronger trading opportunity you can require that price breaks one or more trend lines of different timeframes in the same direction. To do this navigate to the timeframe for which you want to add a trendline and click
Scalping PullBack Signal
Quang Huy Quach
5 (1)
1. Overview The Scalping PullBack Signal indicator is a powerful technical analysis tool designed to help traders identify scalping opportunities based on potential pullback and reversal signals. This tool is particularly useful on lower timeframes (below 15 minutes) but can also be applied on higher timeframes for longer-term trades. This indicator integrates several key analytical components, providing a comprehensive view of trends and potential entry/exit points, helping you make quick and e
FREE
TPO Profile MT5
Kyra Nickaline Watson-gordon
Definition : TPO is a Time Price Opportunity. Instead of using bars or candles with an Open, High, Low, and Close price, each "bar" in a Market Profile is represented by horizontal bars against the price It is called Market Profile terminology. In other words time-price-opportunity (TPO) profiles are histograms of how much time was spent at each price within the span of the profile. By using a TPO chart, you are able to analyze the amount of trading activity, based on time, for each price level
SynaptixQuant Commodities Dominance  – Professional Market Intelligence Professional MT5 commodity strength dashboard with real-time dominance scoring, correlation analysis, and smart entry detection for Gold, Silver, Oil, and Metals traders. Institutional Commodity Intelligence for MetaTrader 5 The SynaptixQuant  Commodities Dominance is a professional-grade market intelligence indicator built for traders who demand precision, structure, and clarity when trading commodities. Designed by Synapti
Holeshot MAX
Carter Kyle Capital Inc.
Holeshot Max – Your Ultimate Trading Companion Holeshot Max is not just another trading tool; it's a sophisticated ally designed to empower traders of all levels to conquer the markets with ease. Built on the powerful Metatrader 5 platform, Holeshot Max is equipped with a custom equity management system that puts the control firmly in your hands. Say goodbye to stress and uncertainty – with Holeshot Max, you can trade worry-free, knowing that your risk tolerance and behavior are fully customizab
이 제품의 구매자들이 또한 구매함
ARICoins
Temirlan Kdyrkhan
ARICoin is a powerful trading companion designed to generate high-probability entry signals with dynamic TP/SL/DP levels based on volatility. Built-in performance tracking shows win/loss stats, PP1/PP2 hits, and success rates all updated live. Key Features: Buy/Sell signals with adaptive volatility bands Real-time TP/SL/DP levels based on ATR Built-in MA Filter with optional ATR/StdDev volatility Performance stats panel (Success, Profit/Loss, PP1/PP2) Alerts via popup, sound, push, or email Cust
AriX
Temirlan Kdyrkhan
1 (4)
AriX Indicator for MT5 A powerful trend-following and signal-evaluation tool AriX is a custom MT5 indicator that combines Moving Averages and ATR-based risk/reward logic to generate clear buy/sell signals. It visualizes dynamic SL/TP levels, evaluates past trade outcomes, and displays win/loss statistics in a clean on-chart panel. Key features include: Buy/Sell signals based on MA crossovers ATR-based SL/TP1/TP2/TP3 levels with visual lines and labels Signal outcome tracking with real-time stat
ARIScalping
Temirlan Kdyrkhan
ARIScalp is a powerful trading companion designed to generate high-probability entry signals with dynamic TP/SL/DP levels based on volatility. Built-in performance tracking shows win/loss stats, PP1/PP2 hits, and success rates all updated live. Key Features: Buy/Sell signals with adaptive volatility bands Real-time TP/SL/DP levels based on ATR Built-in MA Filter with optional ATR/StdDev volatility Performance stats panel (Success, Profit/Loss, PP1/PP2) Alerts via popup, sound, push, or email Cus
ARIPoint
Temirlan Kdyrkhan
1 (1)
ARIPoint is a powerful trading companion designed to generate high-probability entry signals with dynamic TP/SL/DP levels based on volatility. Built-in performance tracking shows win/loss stats, PP1/PP2 hits, and success rates all updated live. Key Features: Buy/Sell signals with adaptive volatility bands Real-time TP/SL/DP levels based on ATR Built-in MA Filter with optional ATR/StdDev volatility Performance stats panel (Success, Profit/Loss, PP1/PP2) Alerts via popup, sound, push, or email Cu
Max Ribbon Mt5
Stefano Frisetti
WARNING: This indicator is distributed EXCLUSIVELY on MQL5.com MT4 version:   https://www.mql5.com/it/market/product/160363 MT5 version:   https://www.mql5.com/it/market/product/160410 ============================================================================================= MAX RIBBON ver 1.00 The indicator that shows you the TREND clearly and unambiguously! ============================================================================================= DESCRIPTION MAX RIBBON is an advanced tre
+++++++++++++++++++++++++++++++++++++++++++++++++++++++++++++++++++++++++++++++++++++++++++++++++ +++ Link to EURUSD Only Free Version -->  https://www.mql5.com/en/market/product/156904?source=Unknown +++++++++++++++++++++++++++++++++++++++++++++++++++++++++++++++++++++++++++++++++++++++++++++++++ Hallo Trader, This is a traditional GANN & FIBONACCI strategy based on detection of an impulsive move in the opposite direction. This is called a Breakout. At the moment of Breakout, the indicator draw
TrendMaestro5
Stefano Frisetti
note: this indicator is for METATRADER4, if you want the version for METATRADER5 this is the link:  https://www.mql5.com/it/market/product/108106 TRENDMAESTRO ver 2.5 TRENDMAESTRO recognizes a new TREND from the start, he never makes mistakes. The certainty of identifying a new TREND is priceless. DESCRIPTION TRENDMAESTRO identifies a new TREND in the bud, this indicator examines the volatility, volumes and momentum to identify the moment in which there is an explosion of one or more of these da
무료 AUX 인디케이터와 EA 지원을 받으세요 직접 다운로드 — 여기를 클릭 [ D.I.C.E ] The DICE Indicator  Divergence in Chaos Environment는 엘리엇 파동 이론과 트레이딩 카오스 기법을 함께 사용하는 트레이더를 위해 설계된 MT5 전문 도구입니다. 가격 움직임의 숨겨진 및 일반 다이버전스를 감지하며, 빌 윌리엄스가 설명한 혼돈 시장 환경과 동기화됩니다. 주요 특징 엘리엇 파동 정렬 다이버전스: 파동 구조에 조화된 강세 및 약세 다이버전스를 탐지하여 파동 카운팅 정확도를 높입니다. 카오스 기법 통합: AO(오썸 오실레이터) 및 시장 구조 원칙과 일치하도록 설계되었습니다. 다중 타임프레임 스캐닝: 다양한 시간 프레임에서 다이버전스를 분석하여 모멘텀 변화와 추세 소진을 확인합니다. 시각적 알림 및 객체: 명확한 화살표, 선, 표시로 빠른 인식 가능. 적응형 시장 판독: 혼돈 시장 조건에 자동으로 조정되어 노이즈를 필터링하고 유효한 셋업만
Hello I Want to introduce The Forex Buy Sell Arrow Premium MT5 i recently release this premium indicator! its 1000% Non Repaint Indicator, It Work Perfectly Well,, i tested it day by day, Just mind blowing Result,  Including Powerful trend Algorithm! How It Work? well, it work market trend formula, when trend Bullish Or when trend Bearish,  Recommend Timeframe M30, H1 it work all timeframe, and all currency pair, 100% non repaint, How to take signal From Forex Buy Sell Arrow Premium Ind
Big Player Range
Thalles Nascimento De Carvalho
5 (3)
BigPlayerRange – MT5 최고의 지표 BigPlayerRange 는 MetaTrader 5에서 미니 인덱스와 미니 달러를 위한 최고의 지표 로 평가받고 있습니다. 이 도구는 주요 기관 투자자들의 전략적 영역을 강조하여 높은 정확도의 기관 기술 분석을 제공합니다. BigPlayerRange 사용법: 이 지표는 매수 구간(녹색선)과 매도 구간(빨간선)을 표시합니다. 가격이 이 구간 밖에서 마감되면 추세 움직임이 예상됩니다. 녹색선 위에서 마감: 강한 매수세와 상승 추세 가능성. 빨간선 아래에서 마감: 매도 압력과 하락 가능성. 범위 내에서 마감: 횡보 시장, 돌파 신호 대기. 주요 혜택: 기관 투자자 영역 매핑: 주요 투자자들의 활동 구간을 식별합니다. 자동 목표 지점 산출: 거래 종료에 적합한 목표 지점을 제공합니다. 풀백 분석: 리스크 관리를 위한 가격 반등 가능성 평가. 활용 방법: BigPlayerRange와 함께 Imba
##   ONLY GOLD ##   Тiльки Золото ## **Mercaria Professional Trading Zones - Complete Guide** ## **Mercaria Professional Trading Zones - Повний посібник** ### **How Mercaria Zones Work / Як працюють зони Mercaria** **English:** Mercaria Zones is an advanced trading indicator that identifies high-probability support and resistance areas using ZigZag extremes combined with mathematical zone calculations. The indicator works on multiple timeframes simultaneously, providing a comprehensive view
Meravith MT5
Ivan Stefanov
이 인디케이터는 임의의 지점에서 거래량을 분석하고 해당 거래량의 시장 소진(exhaustion) 수준을 계산합니다. Meravith 주요 라인: 강세 거래량 소진선 – 목표로 사용됩니다. 약세 거래량 소진선 – 목표로 사용됩니다. 추세선 – 시장 추세를 나타냅니다. 시장이 강세인지 약세인지에 따라 색상이 변경되며, 추세 지지선 역할을 합니다. 사용 방법: 보라색 세로선을 더블 클릭한 후 원하는 위치로 이동시키십시오. 추세와 조정을 포함해 무엇이든 분석할 수 있습니다. 인디케이터를 시장의 상단, 하단 또는 중요하다고 생각되는 임의의 지점으로 이동시킬 수 있습니다. 좋은 방법은 시장이 소진선 사이에 머물도록 Meravith를 설정하는 것입니다. 이렇게 하면 추적할 수 있는 명확한 목표를 갖게 됩니다. 초기 소진선이 돌파되면 새로운 소진선이 나타나며, 추가로 거래 가능한 채널이 형성됩니다. 소진 수준에 도달하면 인디케이터의 위치를 다시 조정하거나 다른 시간 프레임으로 전환하여 새로운 소진
Pantera Indicator
Temirlan Kdyrkhan
5 (1)
A tool for on-chart strategy backtesting and performance analysis. A utility for developing, debugging, and testing custom trading ideas and indicator functions. An indicator designed to quickly test trading concepts and visualize the effectiveness of different input parameters. An all-in-one sandbox for testing everything from simple crossovers to complex, multi-condition trading systems.
Frontier Pivots
Nestor Jose Mendez Boza
FRONTIER PIVOTS - Geometric Levels Indicator This indicator plots support and resistance levels/ranges on the chart using mathematical calculations. It helps traders identify potential price reaction zones based on geometric patterns. Main Features: Automatically calculates and displays key price levels Plots both support and resistance lines Uses daily price data for level calculation Clean visual presentation with different colors for different level types No repainting - levels remain static
VTrende Pro
Andrii Diachenko
5 (1)
VTrende Pro - MTF indicator for trend trading with a display panel for MT5 *** Videos can be translated into any language using subtitles (video language - Russian) Although the signals of the VTrende Pro indicator can be used as signals of a full-fledged trading system, it is recommended to use them in conjunction with the Bill Williams TS. VTrende Pro is an extended version of the VTrende indicator. Difference between Pro version and VTrende: - Time zones - Signal V - signal 1-2 waves -    S
Enigma 112
issam rahhal sabour
Enigma 112 Indicator - User Manual Enigma 112 Indicator Complete User Manual - Ultimate Trading Solution Introduction The Enigma 112 is a comprehensive multi-timeframe trading indicator that combines advanced technical analysis concepts including Tesla 3-6-9 Gates, Huddleston Theory, PO3 Dealing Ranges, and sophisticated risk management systems. Tesla 3-6-9 Gates Based on Nikola Tesla's vortex mathematics for precise support and resistance levels Huddleston Theory Volume-based market
Pan PrizMA CD Phase
Aleksey Panfilov
The Expert Advisor and the video are attached in the Discussion tab . The robot applies only one order and strictly follows the signals to evaluate the indicator efficiency. Pan PrizMA CD Phase is an option based on the Pan PrizMA indicator. Details (in Russian). Averaging by a quadric-quartic polynomial increases the smoothness of lines, adds momentum and rhythm. Extrapolation by the sinusoid function near a constant allows adjusting the delay or lead of signals. The value of the phase - wave s
Классификатор силы тренда. Показания на истории не меняет. Изменяется классификация только незакрытого бара. По идее подобен полной системе ASCTrend, сигнальный модуль которой, точнее его аппроксимация в несколько "урезанном" виде, есть в свободном доступе, а также в терминале как сигнальный индикатор SilverTrend . Точной копией системы ASCTrend не является. Работает на всех инструментах и всех временных диапазонах. Индикатор использует несколько некоррелируемых между собой алгоритмов для класси
FFx Universal Strength Meter PRO is more than a basic strength meter. Instead of limiting the calculation to price, it can be based on any of the 19 integrated strength modes + 9 timeframes. With the FFx USM, you are able to define any period for any combination of timeframes. For example, you can set the dashboard for the last 10 candles for M15-H1-H4… Full flexibility! Very easy to interpret... It gives a great idea about which currency is weak and which is strong, so you can find the best pai
The FFx Universal MTF alerter shows on a single chart all the timeframes (M1 to Monthly) with their own status for the chosen indicator. 9 indicators mode (MACD-RSI-Stochastic-MA-ADX-Ichimoku-Candles-CCI-PSAR). Each can be applied multiple times on the same chart with different settings. Very easy to interpret. Confirm your BUY entries when most of the timeframes are showing green color. And confirm your SELL entries when most of the timeframes are showing red color. 2 Alert Options : input to s
FFx Watcher Pro MT5
Eric Venturi-Bloxs
The FFx Watcher PRO is a dashboard displaying on a single chart the current direction of up to 15 standard indicators and up to 21 timeframes. It has 2 different modes: Watcher mode: Multi Indicators User is able to select up to 15 indicators to be displayed User is able to select up to 21 timeframes to be displayed Watcher mode: Multi Pairs User is able to select any number of pairs/symbols User is able to select up to 21 timeframes to be displayed This mode uses one of the standard indicators
FFx Patterns Alerter gives trade suggestions with Entry, Target 1, Target 2 and StopLoss .... for any of the selected patterns (PinBar, Engulfing, InsideBar, OutsideBar) Below are the different options available: Multiple instances can be applied on the same chart to monitor different patterns Entry suggestion - pips to be added over the break for the entry 3 different options to calculate the SL - by pips, by ATR multiplier or at the pattern High/Low 3 different options to calculate the 2 TPs -
FFx Basket Scanner MT5
Eric Venturi-Bloxs
MetaTrader 4 version available here : https://www.mql5.com/en/market/product/24881 FFx Basket Scanner is a global tool scanning all pairs and all timeframes over up to five indicators among the 16 available. You will clearly see which currencies to avoid trading and which ones to focus on. Once a currency goes into an extreme zone (e.g. 20/80%), you can trade the whole basket with great confidence. Another way to use it is to look at two currencies (weak vs strong) to find the best single pairs
MetaTrader 4 version available here: https://www.mql5.com/en/market/product/25793 FFx Pivot SR Suite PRO is a complete suite for support and resistance levels. Support and Resistance are the most used levels in all kinds of trading. Can be used to find reversal trend, to set targets and stop, etc. The indicator is fully flexible directly from the chart 4 periods to choose for the calculation: 4Hours, Daily, Weekly and Monthly 4 formulas to choose for the calculation: Classic, Camarilla, Fibonac
Premium level Pro
Dmitriy Kashevich
Premium level is a unique indicator with more than 80% accuracy of correct predictions! This indicator has been tested for more than two months by the best Trading Specialists! The author's indicator you will not find anywhere else! From the screenshots you can see for yourself the accuracy of this tool! 1 is great for trading binary options with an expiration time of 1 candle. 2 works on all currency pairs, stocks, commodities, cryptocurrencies Instructions: As soon as the red arrow app
Pendiente de Precio
Cesar Juan Flores Navarro
Indicador en base a la pendiente de la linea de precio, dibuja una línea de color cuando sube a base de los precios que previamente has sido procesados o linealizados, y cuando baja la pendiente la linea linealizada toma otro color. En este caso se a considerado 6 lineas de diferentes procesos desde pendientes largas hacia las cortas, observándose que cuando coincidan las pendientes se produce un máximo o mínimo, lo que a simple vista nos permitirá hacer una COMPRA O VENTA.
Индикатор Coefficient Of Determination (COD) представляет собой значение коэффициента детерминации или квадрат коэффициента корреляции между зависимой переменной — ценой и объясняющей переменной — тиковым объемом. Что это дает нам на практике? COD отлично распознает кульминацию трендовых движений, что позволяет подбирать оптимальные точки и ловить развороты рынка. Как использовать индикатор: Наиболее популярная торговая стратегия строится совместно с трендовым индикатором Moving Average (MA), пе
Fibonacci Multiple 12
Cesar Juan Flores Navarro
Fibonacci Múltiple 12, utiliza la serie fibonacci plasmado en el indicador fibonacci, aumentadolo 12 veces según su secuencia. El indicador fibonacci normalmente muestra una vez, el presente indicador se mostrara 12 veces empezando el numero que le indique siguiendo la secuencia. Se puede utilizar para ver la tendencia en periodos cortos y largos, de minutos a meses, solo aumentado el numero MULTIPLICA.
Recommended TimeFrame >= H1. 100% Non Repainted at any moment.  Use it carefully, only with Trend Direction. Trading Usage: 2 Variants: as Range System or as BreakOut System (Both Only With Trend Direction)::: (Always use StopLoss for minimise Risk); [1] as Range System: (Recommended) in UP TREND:  - BUY in Blue Line , then if price goes down by 50 points (on H1) open Second BUY.   Close in any Profit you wish: TrailingStop(45 points) or Close when Price touches upper Gold Line. in DOWN TREND
Linea Horizontal Inteligente
Cesar Juan Flores Navarro
En base a cálculos matemáticos de determino una linea Horizontal que cruza a todas las señales de trading, mostrando los máximos y mínimos. La linea horizontal parte en dos las subidas y bajadas de las señales de trading, de tan manera que es fácil identificar los máximos y mínimos, y es inteligente por que es sensible a las subidas y bajadas, afín de no quedarse en un solo lado por siempre, trabaja excelentemente con otros indicadores suavizadores ya que les garantiza que en un intervalo de tie
제작자의 제품 더 보기
Miraculous Indicator – Gann Square of Nine 기반 100% 비리페인트 Forex 및 바이너리 도구 이 영상은 Miraculous Indicator 를 소개합니다. 이 지표는 Forex 및 바이너리 옵션 트레이더를 위해 특별히 개발된 매우 정확하고 강력한 트레이딩 도구입니다. 이 지표가 독특한 이유는 전설적인 **Gann Square of Nine(Gann 9의 사각형)**과 **Gann's Law of Vibration(Gann 진동의 법칙)**에 기반을 두고 있기 때문입니다. 이는 현대 트레이딩에서 가장 정밀한 예측 도구 중 하나로 손꼽힙니다. Miraculous Indicator는 완전히 비리페인트(non-repaint) 됩니다. 즉, 캔들이 마감된 후에도 신호가 변경되거나 사라지지 않습니다. 보이는 것이 곧 결과입니다. 이는 트레이더가 자신감을 가지고 거래에 진입하고 청산할 수 있는 신뢰할 수 있고 일관된 기반을 제공합니다. 주요 특징: Gann
F-16 비행기 지표를 소개합니다. 이것은 귀하의 거래 경험을 혁신하도록 설계된 최첨단 MT4 도구입니다. F-16 전투기의 비할 데 없는 속도와 정밀성에 영감을 받아이 지표는 고급 알고리즘과 최첨단 기술을 결합하여 금융 시장에서 압도적인 성능을 제공합니다. F-16 비행기 지표를 사용하면 실시간 분석을 제공하고 매우 정확한 거래 신호를 생성하여 경쟁을 앞서갈 수 있습니다. 다양한 자산 클래스에서 수익 기회를 식별하는 데 필요한 동적 기능을 갖추고 있어 확신을 가지고 정보에 근거한 결정을 내릴 수 있습니다. 사용자 친화적인 인터페이스로 구성된 F-16 비행기 지표는 인기있는 MetaTrader 4 플랫폼과 완벽하게 통합되어 원활하고 효율적인 거래 과정을 보장합니다. 초보자 트레이더든 경험 많은 전문가든 이 지표를 쉽게 사용자 정의하여 고유한 거래 스타일과 선호도에 맞출 수 있습니다. F-16 비행기 지표의 강력함을 경험해 보세요. 이 지표는 시장 트렌드를 정확하고 민첩하게 탐색하며
Green Frog EA
Ramzi Abuwarda
제목: 최고의 프로페셔널 EA 전문가 - 그린 프로그 EA 외환 거래의 세계에서는 시장이 빠르고 결정적으로 움직이기 때문에 신뢰할 수 있는 동반자가 있으면 큰 차이를 만들 수 있습니다. 그린 프로그 EA를 소개합니다. 최고의 프로페셔널 전문가 어드바이저(EA)로, 뛰어난 정확성과 효율성으로 트레이더들을 지원합니다. 그린 프로그 EA는 최첨단 기술적 발전과 외환 산업에서의 경험을 결합한 결과물입니다. 경험 많은 트레이더들과 소프트웨어 엔지니어들로 구성된 팀에 의해 개발되었으며, 꾸준한 결과를 제공하고 상당한 수익을 창출합니다. 그린 프로그 EA의 차별점은 변화무쌍한 시장 상황에 대응할 수 있는 능력입니다. 정교한 알고리즘과 실시간 데이터 분석을 기반으로, 이 EA는 신속하게 수익성 있는 기회를 식별하고 높은 정밀도로 거래를 실행합니다. EA의 지능적인 트레이딩 전략은 트렌드, 변동성이 큰 시장, 그리고 레인지 시장과 같은 다양한 시장 상황에서도 최적의 성과를 보장합니다. 그린
믿을 수 없는 이진 옵션 지표를 사용하고 실수신호로 인해 손실과 좌절을 겪으신 적이 있으신가요? MT4 거래 플랫폼에서 사용 가능한 최고의 바이너리 옵션 지표, CLOCK INDICATOR를 찾으십시오! 고급 알고리즘과 강력한 기술적 분석 도구를 갖춘 CLOCK INDICATOR는 초보자와 숙련된 트레이더 모두에게 최고의 거래 도구입니다. 시장 트렌드를 정확히 예측하고 수익성 있는 거래 기회를 식별하여 이익을 극대화하고 손실을 최소화하는 데 도움이 됩니다. 다른 복잡하고 사용하기 어려운 이진 옵션 지표와 달리, CLOCK INDICATOR는 설치와 사용자 정의가 쉽습니다. 개별 거래 기호에 맞게 설정을 조정할 수 있으며, 모든 주요 통화 쌍과 시간대에서 원활하게 작동합니다. CLOCK INDICATOR의 뛰어난 특징 중 하나는 다시 그리지 않는 특성입니다. 신호가 생성되면 차트에 남아 있으므로 정확한 정보를 기반으로 한 투자 결정을 내리고 있다는 확신을 가질 수 있습니다.
SCALPER EA를 소개합니다. 급격한 인기를 끌고 있는 혁신적인 전문가 어드바이저(EA)로, 외환 거래 세계를 휩쓸었습니다. 2023년에는 SCALPER EA가 가장 수익성이 뛰어나는 EA로 등장하여, 트레이더들이 외환 시장에 접근하는 방식을 혁신적으로 바꾸었습니다. 단기 시장 변동을 활용하도록 설계된 SCALPER EA는 고급 알고리즘과 첨단 기술을 활용하여 신속한 정확도로 고성과 거래 기회를 식별합니다. 뛰어난 성과로 인해, 경험 많은 트레이더와 큰 수익을 추구하는 초보자들 모두에게 필수 도구로 평가받고 있습니다. 스마트한 자동화를 통해 SCALPER EA는 항상 경쟁자들을 앞섭니다. 변동성이 큰 시장 조건에서도 놀라운 수익을 창출하며, 신속하고 효율적으로 거래를 실행하여 수익 가능성을 최대화합니다. 이익 기회를 놓치지 않도록 해 주어 트레이더들에게 빠르게 변화하는 외환 거래 환경에서 경쟁 우위를 제공합니다. SCALPER EA를 다른 EA와 구별하는 점은 그 적응성입니다.
기적적인 외환 지표 소개: 정확한 트레이딩의 힘을 발휘하세요 모든 시간대에서 뛰어난 결과를 제공하는 최고의 외환 지표를 찾는데 지친 적이 있나요? 더 이상 찾을 필요가 없습니다! 기적적인 외환 지표가 도래하여 귀하의 트레이딩 경험을 혁신하고 수익을 새로운 고도로 끌어올립니다. 최첨단 기술과 수년간의 정성스런 개발을 토대로 기적적인 외환 지표는 외환 시장에서의 힘과 정확성의 정점으로 떠오릅니다. 이 탁월한 도구는 모든 수준의 트레이더의 요구를 충족시키고 지속적인 수익을 추구하는 데에서 비길 데 없는 우위를 제공하기 위해 설계되었습니다. 기적적인 외환 지표의 가장 큰 장점은 그 뛰어난 적응성에 있습니다. 당신이 데이 트레이더, 스윙 트레이더이든 장기 포지션을 선호하든, 이 지표는 모든 시간대에서 뛰어난 결과를 제공하기 위해 최적화되었습니다. 그러나 그 정확성과 시장의 복잡한 움직임을 포착하는 능력이 참으로 빛을 발하는 것은 1시간 기간대에서 사용할 때입니다. 기적적인 외환 지표의 정확성
MT4 "독수리 눈 지표"로 바이너리 옵션 거래의 가능성을 극대화하세요 메타트레이더 4(MT4)용 "독수리 눈 지표"를 활용하여 바이너리 옵션 거래의 혁명적인 세계에 도약해 보세요. 이 혁신적인 도구는 수술적인 정확성과 비교할 수 없는 수익성을 제공하여 거래 경험을 변화시킬 준비가 되어 있습니다. 잠재력의 경계가 깨지고 수익이 극대화되는 세계로 뛰어들어 보세요. 독수리 눈 지표의 뛰어난 정확성과 흔들림 없는 신뢰성 덕분에 시장의 숨겨진 비밀을 해결할 수 있습니다. 세심한 세부 사항에 주의를 기울여 개발된 이 최첨단 지표는 고급 알고리즘, 철저한 기술적 분석, 실시간 시장 데이터를 결합하여 탁월한 거래 이점을 제공합니다. 독수리 눈 지표는 시장의 포인트를 정확하게 파악하여 통찰력 있는 신속한 결정을 돕습니다. 직관적인 인터페이스와 사용하기 쉬운 디자인을 통해 초보 트레이더도 쉽게 바이너리 옵션의 복잡성을 탐색하고 이 도구의 엄청난 힘을 최대한 활용할 수 있습니다. 추측과 감정에 기반한
Swing X Black
Ramzi Abuwarda
SWING X Black은 Binary Options와 Forex 거래를 조화롭게 연결하여 두 시장에서 강력한 통찰력을 활용할 수 있는 유연성을 제공합니다. 이 상호 호환성은 거래자들이 선호하는 거래 스타일에 관계없이 정보에 입각한 결정을 내릴 수 있도록 보장하여 성공의 기회를 높이는 데 도움이 됩니다. SWING X Black의 핵심 강점은 탁월한 신호 생성 기능에 있습니다. 고급 알고리즘을 기반으로 하는 이 지표는 잠재적인 추세 반전, 지지 및 저항 영역, 그리고 돌파구를 정확하게 식별하여 거래자들에게 명확한 진입 및 퇴출 지점을 제공합니다. 이 정밀도는 거래자들이 최소한의 위험으로 수익성 있는 기회를 포착하는 데 큰 도움이 됩니다. 빠르게 변화하는 거래 환경을 잘 이해하여 설계된 SWING X Black은 15분의 타임프레임에서 가장 빛을 발합니다. 이 짧은 시간 동안 거래자들은 시장 움직임을 신속하게 분석하여 시장 조건의 변화에 ​​신속하게 대응할 수 있습니다. 15분의 만기
Market Secret
Ramzi Abuwarda
세계적인 바이너리 옵션 거래에서는 정확한 시장 분석과 전략적인 의사 결정이 핵심입니다. 수익성 있는 기회를 찾아내는 뛰어난 거래 지표를 찾는 여정은 끝이 없습니다. 비밀 지표(Secret Indicator)가 등장합니다 - 최고이며 강력한 MT4 바이너리 옵션 거래 도구로서의 명성을 얻은 주목할 만한 도구입니다. 비밀 지표는 경험있는 트레이더와 전문 프로그래머들로 구성된 팀에 의해 수년간의 세심한 연구, 개발 및 테스트를 통해 만들어졌습니다. 독특한 알고리즘과 고급 수학적 모델은 바이너리 옵션의 빠른 속도로 변동하는 세계에서 트레이더에게 무적의 이점을 제공하기 위해 정교하게 조정되었습니다. 비밀 지표를 다른 거래 지표와 구분 짓는 특징은 놀라운 정확도로 수익성 있는 거래 기회를 발견하는 능력입니다. 이 신호는 강력한 기술적 지표, 가격 행동 분석 및 시장 감성 평가의 조합에서 유도됩니다. 이 다각적 접근법은 비밀 지표가 단기 변동과 장기 추세 모두를 포착하여 트레이더에게 시장의
**바이너리 스마트 시스템 소개: 귀하의 궁극적인 트레이딩 파트너** 바이너리 스마트 시스템은 단순히 인디케이터가 아닙니다. 이는 정교한 트레이딩 도구로, 다양한 시장에서 핀포인트 정확도와 적시의 신호를 제공하여 트레이더에게 성공을 이끌어주는 데 주안점을 둔 것입니다. 혁신적인 알고리즘과 다양한 기술적 지표의 철저한 컬렉션을 기반으로 구축된 이 시스템은 트레이딩 성공을 얻기 위한 열쇠입니다. **인디케이터 구성 요소:** 1. **이동 평균 비율 (MAP):** 이 구성 요소는 다양한 이동 평균의 가중 평균을 계산하여 추세 식별을 위한 강력한 기준을 형성합니다. MAP은 시장 상황에 동적으로 적응하여 현재 추세 방향을 파악하는 정보를 제공합니다. 2. **상품 채널 지수 (CCI):** 평균 가격으로부터의 편차를 분석함으로써 CCI는 과매수 및 과매도 조건을 판단합니다. 바이너리 스마트 시스템의 CCI 통합은 잠재적인 반전 지점을 식별하는 종합적인 접근을 보장합니다. 3.
소개: 바이너리 옵션과 외환 거래의 빠르게 변화하는 세계에서, 성공과 실패의 차이를 만들 수 있는 도구와 전략을 갖추는 것이 중요합니다. 이러한 도구 중 하나는 BBB 블랙 블루 바이너리 옵션 지표 시스템으로, 차트 패턴, 이동 평균, 거래량을 결합하여 거래자가 정보에 입각한 결정을 내릴 수 있도록 하는 혁신적인 접근 방식입니다. 이 포괄적인 가이드에서는 BBB 시스템의 세부 사항을 설명하고, 작동 방식, 언제 사용해야 하는지, 그리고 어떻게 하면 거래 성과를 향상시킬 수 있는지 설명합니다. BBB 지표 시스템 설명: BBB 블랙 블루 바이너리 옵션 지표 시스템은 바이너리 옵션과 외환 거래의 최적의 진입 및 퇴출 지점을 식별하는 데 도움이 되는 정교한 기술적 분석 도구입니다. 이 시스템은 "블랙"과 "블루"라는 주요 신호를 나타내는 기본 구성 요소에서 이름을 따왔습니다. 차트 패턴: BBB 시스템은 거래 차트의 계산된 부분을 분석하여 시작합니다. 이는 가격 행동에서 특정 패턴이나 형
메트로 역": 성공적인 자동 거래로의 길 "메트로 역"은 첨단 기법과 지능적인 알고리즘의 교차점에서 작동하는 선두주의적인 MT4 자동 거래 신호로, 정밀 거래의 세계로 진입할 수 있습니다. "메트로 역"은 이동 평균(MA), 상대 강도 지수(RSI), 스토캐스틱 오실레이터, 모멘텀 및 평균 방향 지수(ADX)의 힘을 활용하여 웰 인포메드 거래 신호를 생성합니다. 이는 지도를 찾는 초보 트레이더와 거래 과정을 간소화하려는 숙련된 트레이더 모두를 위해 설계되었습니다. "메트로 역"의 기능 핵심에는 이러한 중요한 기술적 지표를 결합하는 독특한 전략이 있으며, 데이터 기반 인사이트의 조화로운 수렴을 야기합니다. 이동 평균은 기본적인 트렌드 분석을 제공하며, 시장 소음을 걸러내고 가격 움직임의 실제 방향을 드러냅니다. 시장이 과매수 상태인지 과매도 상태인지 판단함으로써 RSI와 스토캐스틱 오실레이터는 가능한 반전이나 계속에 대한 예측을 돕는 추가적인 확증 수준을 제공합니다. 한편 모멘텀은 "
Forex 및 바이너리 옵션 성공을 위한 궁극적인 가이드: 비 다시 그리는 XY 트렌드 지표 공개 서론: Forex 및 바이너리 옵션 거래의 역동적인 세계에서 한발 앞선다는 것은 가장 중요합니다. 거래자들은 지속적으로 경쟁력 있는 우위를 제공할 수 있는 도구를 찾고 있으며, 거래 커뮤니티에서 파장을 일으키고 있는 그러한 강력한 도구 중 하나는 "비 다시 그리는 XY 트렌드" 지표입니다. 지표 이해: 비 다시 그리는 XY 트렌드 지표를 다른 지표와 구별하는 핵심 기능 중 하나는 정확성에 대한 약속입니다. 과거 신호를 다시 그려 거래자에게 신뢰할 수 없는 데이터를 남길 수 있는 다른 많은 지표와 달리 이 지표는 무결성을 유지합니다. 거래자는 생성되는 신호에 대해 자신감을 가질 수 있으며 이러한 신호가 과거 가격 움직임을 정확하게 반영하고 있음을 알 수 있습니다. XY 트렌드 지표는 고급 알고리즘을 사용하여 가격 데이터를 분석하고 시장의 트렌드를 식별합니다. 노련한 거래자든 초보 거래자든
빠르게 변화하는 금융 시장에서 모든 초는 중요하며 모든 결정은 거래를 성사시키거나 망칠 수 있습니다. 바이너리 해커 지표(Binary Hacker Indicator)는 분 단위로 가격 움직임을 분석하는 방식을 혁신할 준비가 된 획기적인 도구입니다. 거래의 정밀도 밝히기: 바이너리 해커 지표는 일반적인 거래 도구가 아닙니다. 실시간 분석기 역할을 하며 차트의 각 분을 분석하여 트레이더에게 귀중한 통찰력을 제공합니다. 광범위한 수동 분석이 필요한 기존 지표와 달리 바이너리 해커는 거래 전략에서 추측 작업을 제거하고 순수 데이터에 기반한 계산된 접근 방식을 제공합니다. 매 분의 힘: 거래의 매 분을 분석하고 매수와 매도 압력 사이의 복잡한 균형을 이해할 수 있다고 상상해보세요. 바이너리 해커를 통해 이러한 비전이 현실이 됩니다. 이 독창적인 지표는 시장을 지속적으로 모니터링하고 매 분마다 상승 틱과 하락 틱의 수를 계산하여 가격 액션의 본질을 쉽게 이해할 수 있는 정보로 정제합니다. 독특
제목: GOLDEN SUN 123 TREND_Dashboard_With_Alert MT4 지표 공개 끊임없이 변화하는 금융 시장에서 트레이더들은 지속적으로 경쟁력 있는 우위를 제공하는 도구를 찾고 있습니다. 정확성과 수익성을 추구하는 과정에서 GOLDEN SUN 123 TREND_Dashboard_With_Alert MT4 지표는 기회의 표지로 빛을 발합니다. MetaTrader 4 플랫폼을 위해 설계된 이 놀라운 지표는 추세 추종 기능과 경고 메커니즘을 통해 전략적 거래의 정수를 담고 있습니다. 추세의 힘 활용하기: GOLDEN SUN 123 TREND_Dashboard_With_Alert MT4 지표는 시장 추세를 식별하고 활용하기 위한 정교한 도구입니다. 트레이더들은 추세가 수익성 있는 거래의 핵심임을 이해하며, 이 지표는 바로 그러한 역할을 위해 정교하게 제작되었습니다. 이 지표는 시장을 끊임없이 검사하여 상승, 하락 또는 범위 추세인지 여부를 즉시 인식합니다. 명확성의 대시
Elon Musk EA는 MACD 수준, MACD 다이버전스, 숨겨진 MACD 다이버전스 및 지능형 마틴게일 전략을 기반으로 한 혁신적인 트레이딩 도구입니다. 이전과는 다른 트레이딩 경험을 준비하셨나요? Elon Musk EA를 함께 사용하면 MACD 수준, 다양한 MACD 다이버전스, 숨겨진 MACD 다이버전스 및 뛰어난 지능형 마틴게일 시스템의 잠재력을 발휘할 수 있습니다. 이러한 탁월한 요소들을 활용하여 이 EA는 야심찬 트레이더에게 완벽한 파트너가 될 것입니다. 제한을 깨고 가능성을 재정의하며 전례없는 금융적 성공을 향한 여행을 준비하세요. Elon Musk EA의 탁월한 점은 정확성과 적응성에 있습니다. 첨단 알고리즘과 철저한 시장 분석을 통해 MACD 수준을 탁월한 정확도로 감지하여 수익을 얻을 수 있는 최적의 타이밍을 포착할 수 있습니다. MACD 다이버전스 및 숨겨진 다이버전스를 활용하여 수익성이 높은 진입 및 청산 포인트를 식별하여 항상 경쟁자보다 한 발 앞설 수 있
T-REX_EA 는 MT4용으로 설계된 강력한 인공지능 기반의 트레이딩 로봇으로, 다양한 고급 전략을 결합하여 꾸준한 수익을 제공합니다. 이 EA는 AI 기술과 돌파 전략, 캔들 패턴, 볼륨 프로파일, 수요 및 공급 영역을 사용하여 시장을 분석하고, 트레이드 진입과 출구 시점을 최적화합니다. 주요 특징: 멀티 전략 접근법 : AI 분석과 전통적인 돌파 전략, 캔들 패턴 인식을 결합하여 강력한 트레이딩 우위를 제공합니다. 볼륨 프로파일과 수요/공급 구역 : 볼륨 데이터를 사용하여 높은 확률의 트레이드를 정확하게 식별합니다. 터보 모드 : 변동성이 큰 시장 상황에서 트레이드 빈도와 잠재적 수익을 높이는 특별한 기능입니다. 다양한 통화쌍 거래 가능 : EA는 모든 통화쌍에서 거래할 수 있지만, 특히 EUR/USD, GBP/USD, USD/JPY와 같은 주요 통화쌍에서 높은 수익을 기대할 수 있습니다. 유연한 거래 설정 : 최소 $500 의 잔액으로 거래를 시작할 수 있으며, 이는 작은 계
AI TRADING SYSTEM for MT4 - 당신의 궁극적인 AI 구동 이익 기계! AI TRADING SYSTEM 으로 거래의 미래를 해방하십시오. 이것은 최첨단 전문가 어드바이저(EA)로, 강력한 AI 구동 전략을 사용하여 모든 통화 쌍의 이익을 극대화합니다. 다양성을 위해 설계되었지만, EUR/USD, GBP/USD, USD/JPY와 같은 주요 쌍 에서 뛰어난 성능 을 발휘하여 시장에서 앞서 나갈 수 있습니다. AI TRADING SYSTEM 에는 두 가지 별개의 거래 모드 가 있어 거래 스타일과 수익 목표에 맞게 조정할 수 있습니다. BACIS 모드 - 최소한의 위험으로 꾸준하고 안정적인 이익을 위해 균형 잡힌 접근 방식을 찾는 거래자에게 완벽합니다. TURBO 모드 - 공격적인 고수익 전략으로 이익을 높이고 싶은 사람들에게 이상적이며, 시장 모멘텀을 포착하는 데 적합합니다. 주요 기능: 사용자 정의 설정 : 수익 실현(TP), 손절(SL), 로트 크기 및 마틴게일 옵션
Binary Smart Eye
Ramzi Abuwarda
"Binary Smart Eye" MT4 지표는 바이너리 옵션 및 외환 시장 모두에 거래 신호를 제공하도록 설계되었으며, M1에서 W1까지 광범위한 시간 프레임에서 작동합니다. 추세 수준, 지능형 이동 평균 및 최적화된 거래 기간을 결합한 독점적인 전략을 사용하여 잠재적인 진입점을 식별합니다. 주요 기능에 대한 분석은 다음과 같습니다. 다중 시간 프레임 분석: 지표의 다용도성은 트레이더가 다양한 시간 프레임에서 이를 활용하여 M1의 스캘핑부터 W1의 장기 추세 추종까지 다양한 거래 스타일에 맞출 수 있도록 합니다. 독점 전략: "Binary Smart Eye"의 핵심은 다음을 활용하는 고유한 전략에 있습니다. 추세 수준: 이러한 수준은 주요 시장 추세 및 잠재적인 반전 지점을 식별하는 데 도움이 됩니다. 지능형 이동 평균: 시장 변동성에 적응하고 정확한 추세 방향을 제공하는 사용자 정의 이동 평균입니다. 스마트 거래 기간: 지표는 최적의 시장 조건을 포착하기 위해 특정 시간 기간을
Traffic Signal
Ramzi Abuwarda
혁신적인 MT5 지표 '트래픽 신호'를 소개합니다 - 성공적인 트레이딩 세계로의 문을 열어드립니다! 정확성과 전문지식을 바탕으로 설계된 이 혁신적인 지표는 RSI, 스토캐스틱, CCI 및 모든 시간프레임의 트렌드 분석에 기반한 특별한 전략으로 가장 정확한 진입 신호를 생성합니다. 트래픽 신호는 무적의 자신감으로 시장을 탐색할 수 있도록 최상의 정확성을 제공합니다. 트래픽 신호를 통해 가장 수익성 높은 트레이딩 기회를 감지하기 위해 정밀하게 조정된 주요 기술적 지표의 철저한 분석에 접근할 수 있습니다. 불확실성에 작별을 고하고 정보 기반의 의사 결정의 새로운 시대를 맞이하세요. RSI, 스토캐스틱, CCI 및 트렌드의 잠재력을 트래픽 신호 내에서 완벽하게 융합하여 전례없는 시장의 역학을 생생하게 그려냅니다. 트래픽 신호를 통해 시장의 트렌드와 패턴을 쉽게 탐색하면서 모든 시간프레임을 주시할 수 있습니다. 단기적인 고조 또는 장기적인 전략적 플레이를 선호하든지, 이 뛰어난 지표는 여러분
통화 마술사 매트릭스 인디케이터란 무엇인가요? 통화 마술사 매트릭스 인디케이터는 통화의 강도를 보여주는 그래픽 도구입니다. 일반적인 인디케이터는 보통 다른 통화와의 상대적인 강도를 보여줍니다. 그러나 일부 계산을 통해 각 개별 통화의 절대 강도를 찾아낼 수 있습니다. 따라서 통화 마술사 매트릭스 인디케이터(또는 미터)는 통화의 절대적인 강도를 표현하기 위한 도구로, 이 강도를 다른 통화의 강도와 비교할 수 있습니다. 통화의 절대 강도를 계산하는 방법은 여러 가지가 있지만, 일반적으로 다른 인디케이터의 모든 값들을 고려하여 추출하려고 합니다. 다시 말해, 예를 들어 JPY의 강도를 계산하기 위해 알고리즘은 JPY를 포함하는 모든 통화쌍에서 동일한 인디케이터의 값들을 분석합니다. 이 개념은 통화 마술사 매트릭스에 처음 접하는 경우에는 약간 혼란스러울 수 있지만, 걱정하지 마세요. 계속 읽다보면 이해하게 될 것입니다. 통화 마술사 매트릭스는 8개 주요 통화의 강도를 측정하기 위해 개발된
Darwin Assistant
Ramzi Abuwarda
혁신적인 MT5 지표인 DARWIN Assistant   을 소개합니다. 성공적인 거래의 세계로 가는 궁극적인 관문입니다! 정확성과 전문성으로 설계된 DARWIN Assistant   은 RSI, 스토캐스틱, CCI 및 추세와 같은 고급 기술 지표의 힘을 모든 시간대에 걸쳐 활용하는 특별한 전략에 따라 운영됩니다. 이 최첨단 지표는 진입을 위한 가장 정확한 신호를 제공하므로 비교할 수 없는 확신을 가지고 시장을 탐색할 수 있으므로 특별한 거래 경험에 대비하십시오. DARWIN 트래픽을 사용하면 가장 수익성이 높은 거래 기회를 감지할 수 있도록 세심하게 보정된 중요한 지표에 대한 포괄적인 분석에 액세스할 수 있습니다. 불확실성에 작별을 고하고 정보에 입각한 의사 결정의 새로운 시대를 맞이하십시오. RSI, Stochastics, CCI 및 Trends가 DARWIN Assistant   내에서 원활하게 수렴되어 전례 없는 시장 역학을 생생하게 보여줍니다. DARWIN Assist
필터:
리뷰 없음
리뷰 답변