MetaTrader 5용 기술 지표 - 45

"Elder Ray" or "Ray" indicator is based on the Dr. Alexander Elder's oscillators: Bulls & Bears Power. Both of them works with an EMA. This indicator is used by traders to identify divergence, market directions and more... Dr. Elder's method generally uses a 13-day EMA Period but this can be modified based on your personal demand. The calculations are: Bulls Power= high candle - EMA close Bears Poder= low candle - EMA close Lime line represents Bulls Power and OrangeRed line, shows Bears Power
FREE

Hi there! Since I am starting commercial and non-commercial product publishing I would highly appreciate: If you like this product, please rate it. That will help to promote not only this product, but indirectly another ones. So, such promotion will help to make some money from commercial products. Thus, I will have opportunity to fund my another directions of trading researches like bot development using mql4 and mql5 programming languages as well as python written products like crypto bots. If
FREE

Category: Trend Indicator
Platform: MetaTrader 5
Type: Level Indicator
Timeframes: All
Trader Styles: Scalping, Day Trading, Swing Trading
Markets: All Description The Madrid Ribbon is a moving average–based trend visualization tool. It combines multiple exponential or simple moving averages into a ribbon structure that adapts to market changes. The indicator highlights trend direction, possible reentry zones, and areas where reversals may occur. Main features: Dynamic Trend Display – Multiple m

Trend Entropy – Adaptive Chaos & Order Detector
Entropy is the scientific measure of disorder or uncertainty in a system. In physics, it shows how energy disperses and why systems move toward chaos. In information theory, it measures unpredictability in data. Low entropy means order and predictability, while high entropy reflects randomness, complexity, and reduced clarity of outcomes.
Trend Entropy is a next‑generation trading indicator designed for MetaTrader 5. Unlike conventional oscillat
FREE

MACD Leader – Zero-Lag Trend & Momentum Indicator for MT5 MACD Leader is an advanced momentum and trend-following indicator for MetaTrader 5, designed to reduce the inherent lag of traditional MACD by applying a zero-lag smoothing technique. It provides earlier signals while preserving the smoothness and structure traders expect from MACD-based tools. Smoothing methods introduce delay, and since MACD relies on moving averages, it naturally lags behind price. While lag cannot be completely elimin

It is an analogue of the indicator of levels at https://www.mql5.com/en/market/product/24273 for the MetaTrader 5 platform. The indicator shows the levels of the past month, week and day. In addition, it draws a level in percentage relative to the difference between the High and Low of the past month and week. For the daily levels of the past day, the Close levels are additionally displayed. All you need to do is to configure the display parameters of the levels to your liking. In some cases, af

You can avoid constant monitoring of computer screen waiting for the DeMarker signal while receiving push notifications to a mobile terminal or a sound alert on the screen about all required events, by using this indicator - DeMarker Alerts. In fact, it is the replacement of the standard indicator with which you will never miss the oscillator signals. If you don't know the benefits of DeMarker or how to use it, please read here . If you need signals of a more popular RSI indicator, use RSI Alert

This indicator recognizes a special type of Inside Bar formation which is formed by a big Master candle followed by 4 smaller candles (please see the strategy explanation below). Features Plots buy/sell stop lines on the chart as well as well as take profit and stop loss levels. The TP/SL levels are based on the Average True Range (ATR) indicator. Object colors are changeable. Sends you a real-time alert when a Master candle formation is identified - sound / popup / email / push notification. On

Trade in the Footsteps of the Institutions The SMC Institutional Order Flow indicator brings the power of professional trading strategies directly to your MetaTrader 5 terminal. Based on the core principles of Smart Money Concepts (SMC) , this advanced tool automatically maps the key levels and structures used by banks and large institutions to move the market. Stop guessing and start seeing the market through the lens of order flow. This all-in-one suite identifies where institutions have

Trend Dot Indicator MT5
– Clean & Powerful Reversal System A fast-reacting Trend Step Regression (TSR) line with color-coded dots instantly shows the current trend. High-probability BUY/SELL signals appear only when a real reversal occurs, confirmed by minimum trend length and ADX strength. Description here: https://www.mql5.com/en/blogs/post/765867 Feel free to join my Telegram Channel
Features: Clear visual TSR line + dots (blue = up, red = down) Filtered reversal signals with text labe

Volumes ******************* Volumes для платформы секундных графиков Micro . ********************* Секундный график на порядок увеличит точность ваших входов и выходов. Секундный период , в привычном формате, позволит увидеть то, что ранее было скрыто. Бесплатные индикаторы, дополнят визуальную картину, что, в совокупности выведет вашу торговлю на новый уровень. Идеально подходит как скальперам, так и трейдерам торгующим внутри дня. Индикатор Volumes для платформы Micro. Входные парам
FREE
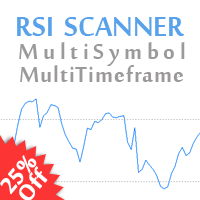
25% off. Original price: $40 (Ends on February 15) RSI Scanner is a multi symbol multi timeframe RSI dashboard that monitors Relative Strength Index indicator for price entering and exiting overbought and oversold in up to 28 symbols and 9 timeframes.
Download Demo here (Scans only M1, M5 and M10) Settings description here MT4 version here
RSI Scanner features: Signals RSI entering and exiting the overbought and oversold zones. Monitors 28 customizable instruments and 9 timeframes at th

NewTest https://backoffice.aurum.foundation/u/DHXP1U
The indicator is based on indicators built-in standard indicators, the indicator take into account the current indicators 30 indicators and give a signal to buy or sell, the General trend of all trends of other indicators. In the input parameters, you can configure special parameters for each indicator. the indicator is executed in the form of an oscillator and shows the General trend and the preponderance of all indicators in one or the othe
FREE

MultiTF Trend Indicator for MetaTrader 5 MultiTF Trend is a technical indicator for MetaTrader 5 designed to display trend directions across multiple timeframes on a single chart. It uses Moving Average (MA) slope analysis combined with an ATR-based threshold to help identify periods of directional movement in the market. This tool presents trend information in a structured and easy-to-read format, allowing users to observe trend alignment across various timeframes without switching charts. Mai

This indicator is a basic RSI but comes up with a useful feature.
You can set zones within the RSI and these zones can be displayed with different background colours. (You can see on the pictures below) You need to set the zone ranges and their colours at the input parameters. Six different zones can be set.
Should you have any questions or comments, feel free to contact me.
FREE
This is an indicator to assist a trader on trend detection of any market. This indicator is made up of a blend of moving averages for trend detection. I know no indicator is 100% accurate , but this might help you. I'm giving it for free and also , there are important settings on the last screenshot. This indicator should be on a separate window after you set it up on the chart.
FREE

RSI Scanner, Multiple Symbols and Timeframes, Graphical User Interface An indicator that scans multiple symbols added from the market watch and timeframes and displays result in a graphical panel. Features: Multi symbol Multi timeframe Alerts and Notifications Live Monitoring Sorting modes One click to change symbol and timeframe Inputs for RSI and scanner settings
FREE

ScalpReactor X A Tactical Indicator for Precision Traders The Ritz Scalping Habbit is a powerful MT5 indicator designed to help traders execute disciplined, high-probability trades through clear visual cues and multi-strategy confirmations. Whether you’re an intraday scalper or a swing trader , this tool integrates advanced market analysis into a single, easy-to-use interface. Key Strengths: Smart Buy & Sell Arrows — Based on multi-layer signals from RSI, ATR, EMA, ADX, and price momentum. Colo

SMC Trend Momentum – Adaptive Trend and Momentum Oscillator SMC Trend Momentum is a momentum oscillator plotted in a separate window.
The indicator combines a Donchian position bias with a ZigZag leg normalization and transforms this into a smoothed, color‑coded histogram for assessing trend direction and momentum changes. Optionally, a higher timeframe filter can be applied. The indicator is designed to be flexible for different trading styles (short‑term, swing, indices, FX) using ready‑to‑u
Linear Regression Channel – Indicator The Linear Regression Channel is a custom MT5 indicator that plots a regression line through price over a specified number of bars, with dynamic support and resistance boundaries. Central Line (BlueViolet):
Represents the linear regression line (best-fit line) based on the selected price type (Close or High/Low). Upper Line ( Li me):
Represents the regression-based resistance level, adjusted dynamically according to the highest deviation from the regressi
FREE
Gold Signal Quality Selector Stop Guessing. Start Trading Gold with Institutional-Grade Clarity. Are you tired of the chaotic nature of the Gold (XAUUSD) market? Frustrated with generic indicators that generate endless false signals and drain your capital? The truth is, Gold doesn't move like other assets. It demands a specialized tool built for its unique volatility and personality. It's time to stop using one-size-fits-all tools and start trading with an intelligent edge. Introducing Gold Sign

Machine Learning Adaptive SuperTrend - Take Your Trading to the Next Level!
Introducing the Machine Learning Adaptive SuperTrend , an advanced trading indicator designed to adapt to market volatility dynamically using machine learning techniques. This indicator employs k-means clustering to categorize market volatility into high, medium, and low levels, enhancing the traditional SuperTrend strategy. Perfect for traders who want an edge in identifying trend shifts and market conditio
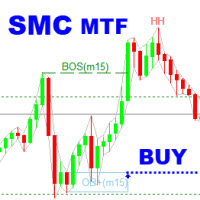
SMC Analyzer Multi-Timeframe is a powerful tool designed to help traders apply Smart Money Concepts (SMC) across multiple timeframes. This indicator identifies key structural points such as market structure shifts (Break of Structure and Change of Character), order blocks, fair value gaps (FVG), and liquidity zones from higher timeframes and overlays them onto the current chart. By aligning these critical SMC signals across multiple timeframes, traders gain a more comprehensive view of instituti

This indicator draws a vertical line repeatedly at the set time. The number of lines that can be set can be set arbitrarily. In addition, it is possible to set 4 types of lines. It is possible to change different times, colors, line types, etc. The time can be set to any time in minutes.
In the next version, we plan to display the high and low prices within the setting range.
FREE

The underlying strategy of this indicator is based on identifying momentum in the market and attempting to capture the direction of the trend through transitions between bullish and bearish moments. Utilizing bands around the RWMA allows for identifying potential overbought and oversold situations in the market.
1. Calculation of the Range Momentum Index (RMI): The RMI is based on a combination of the Relative Strength Index (RSI) and the Money Flow Index (MFI), both of which are momentum indi

Weis Wave Volume Indicator for MetaTrader 5 (MT5) Check all of our products here: All Products Specifications Platform: MetaTrader 5 (MT5)
Type: Custom Technical Trading Indicator
Level: Intermediate
Timeframes: All Timeframes (Multi-Timeframe Support)
Trading Styles: Scalping, Day Trading, Swing Trading, Position Trading
Markets: Forex, Stocks, Commodities, Indices, and Cryptocurrencies What Does This Indicator Do? The Weis Wave Volume Indicator for MT5 is a powerful Price Action + V
Optimized Trend Tracker (OTT) Indicator The Optimized Trend Tracker (OTT) is a custom indicator designed to visualize trend direction and potential changes based on a configurable moving average and dynamic support/resistance levels. It provides multiple visualization and signal options, making it suitable for discretionary analysis or integration into automated systems. Key Features Configurable Moving Average Types
Supports SMA, EMA, WMA, TMA, VAR, WWMA, ZLEMA, and TSF for flexible calculatio

Probability emerges to record higher prices when MACD breaks out oscillator historical resistance level. It's strongly encouraged to confirm price breakout with oscillator breakout since they have comparable effects to price breaking support and resistance levels; surely, short trades will have the same perception. As advantage, many times oscillator breakout precedes price breakout as early alert to upcoming event as illustrated by 2nd & 3rd screenshot. Furthermore, divergence is confirmed in c
FREE

"Wouldn't we all love to reliably know when a stock is starting to trend, and when it is in flat territory? An indicator that would somehow tell you to ignore the head fakes and shakeouts, and focus only on the move that counts?" The Choppiness Index is a non-directional indicator designed to determine if the market is choppy (trading sideways) or not choppy (trading within a trend in either direction). It is an oscillating indicator between -50 (very trendy) and +50 (very choppy). There are man
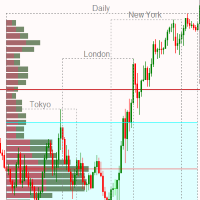
Market Session and Volume Profile Indicator A Professional Trading Tool for Advanced Market Analysis This sophisticated indicator combines Market Session Analysis with Volume Profile Technology to provide traders with critical market structure insights. Volume Profile is one of the most powerful analytical tools used by institutional traders and market makers to identify key price levels where significant trading activity occurs. Key Features: Volume Profile Analysis: POC (Point of Control) - I
Pip Scope – Accurate Chart Perception for Smarter Trades The Problem:
MetaTrader automatically adjusts the vertical scale of charts to keep all candles visible. While this is helpful for keeping price action on screen, it can distort your perception of movement size. A small move may suddenly appear huge, while a large move may look minor. This can mislead traders—especially scalpers and intraday traders—into poor risk assessment, incorrect position sizing, and misplaced stop-loss levels. T
FREE

# SamuraiFX Combined Pro V14 **Master Market Turns with Real-Time Volume & Structure**
Stop guessing where the market will turn. The **SamuraiFX Combined Pro** is a comprehensive trading system that combines **Daily Structure**, **Volume Flow**, and **Price Action** into a single, non-repainting dashboard. It helps you identify high-probability Reversals and powerful Breakouts without the lag of traditional indicators.
### **Key Advantages**
* **No Lag, No Repaint:** Signals are generated in

Historical Equity Flow Indicator (HEFI)
Description HEFI is an indicator for MetaTrader 5 that visualizes the dynamics of account balance and floating balance in real time. It helps traders analyze the historical effectiveness of their trading, as well as assess the current state of open positions.
What is it intended for?
Account balance tracking, taking into account closed transactions for the selected period.
Displaying a floating balance (balance + uncovered profits/losses).
Analysis o
FREE

ATR Progress Control
Trading is all about probability, and if you don't know how much range the price has left today, you're trading blind.
This indicator is your dashboard that answers the most important question before a trade: does it make mathematical sense to enter the market right now? It's a tool for professional volatility analysis that helps filter out false entries and avoid trades when the move is already exhausted.
What's the problem?
Imagine that the average daily movement (ATR

Fisher Transformation Indicator for MT5 – Spot Trend Reversals Before They Happen! The Fisher Transformation Indicator is your go-to tool for crystal-clear market movement detection. Through mathematical transformation of price data, it delivers unmistakable buy and sell signals – right there in your chart where you need them.
Key Benefits: Early Warning System for Trend Changes – catch uptrends and downtrends before the crowd Crystal Clear Buy & Sell Signals – color-coded for instant recogniti
FREE

Trend Regularity Adaptive Moving Average Indicator for MT5
TRAMA Indicator for MT5 Overview
The Trend Regularity Adaptive Moving Average (TRAMA) is an intelligent adaptive moving average that dynamically adjusts its sensitivity based on market structure and trend consistency. Unlike standard moving averages, TRAMA reacts to how frequently new highs or lows are formed within a defined period, providing an adaptive balance between trend-following precision and range stability. How It Works
TRAM

MTF MA Dashboard Pro v1.04 - 한국어 MTF MA Dashboard Pro v1.04 - 전문 다중 타임프레임 이동평균선 분석기 지능형 골든크로스/데드크로스 감지와 완전히 사용자 정의 가능한 시각적 대시보드를 갖춘 포괄적인 다중 타임프레임 이동평균선 분석을 제공하는 MT5용 고급 기술 지표입니다. 타임프레임 전환을 멈추세요! 최대 4개의 타임프레임을 동시에 분석하고 추세 정렬을 즉시 발견하세요. 핵심 기능 다중 타임프레임 분석 최대 4개의 타임프레임 동시 모니터링 (M1-MN1 + 사용자 정의 기간) 각 타임프레임 독립적으로 구성 가능 모든 타임프레임에서 실시간 동기화 모든 심볼에서 작동 (외환, 금, 지수, 암호화폐) 듀얼 MA 시스템 타임프레임당 두 개의 이동평균선 (빠른선 & 느린선) 기간: 1-500 (완전히 사용자 정의 가능) 방법: SMA, EMA, SMMA, LWMA 적용 가격: 종가, 시가, 고가, 저가, 중간가, 전형가, 가
FREE

Trendlines with Breaks Overview The Trendlines with Breaks indicator automatically detects and plots pivot-based trendlines, dynamically adjusting their slope and steepness to highlight significant breakout events. Designed for traders who rely on price action and market structure , this tool provides an automated, real-time way to track evolving momentum and breakout confirmations . How It Works The indicator identifies swing highs and swing lows , connecting them to form adaptive trendlines ba

عنوان: محلل الدعم والمقاومة الذكي
وصف مختصر: يقوم بتحديد مستويات الدعم والمقاومة الرئيسية بشكل ديناميكي، مع تسليط الضوء على نقاط المحور الحاسمة وأعلى الارتفاعات وأدنى الانخفاضات لاتخاذ قرارات تداول دقيقة.
الوصف الكامل: أطلق العنان لقوة تحليل السوق الديناميكي مع SmartSRAnalyzerR! يرصد هذا المؤشر المتقدم تلقائيًا قمم وقيعان نقاط المحور، ويحسب أقرب مستويات الدعم والمقاومة، ويعرضها بوضوح على مخططك البياني.
الميزات الرئيسية:
الدعم والمقاومة الديناميكية: تحدد تلقائيًا المستويات الرئيسية استنادًا
FREE

Structure Levels (Highs & Lows) Indicator for MetaTrader 5
Decode Market DNA — Trade with Institutional Precision Description:
The Structure Levels (Highs & Lows) Indicator is your secret weapon to map the market’s hidden roadmap. Designed for traders who think in terms of price action and market structure, this tool automatically identifies critical swing highs and swing lows, transforming chaotic charts into a clear blueprint of support/resistance zones, breakout opportunities, and trend rev

Apex Swing VWAP is an advanced indicator for MetaTrader 5 that combines VWAP (Volume Weighted Average Price) analysis with automatic detection of significant swing points. This combination provides accurate market sentiment insight and potential reversal points. Key Features Integrated Technical Analysis - Dynamic VWAP from relevant swing points - Historical VWAP for long-term trend analysis - Multiple configurable VWAP periods
Recommended Trading Types - Swing Trading for medium-term trends -

Introduction to GARCH Indicator GARCH is the short initial for Generalized Autoregressive Conditional Heteroskedasticity and it is the volatility prediction model commonly used in financial industry. GARCH model was first appeared in the work by Danish Economist, Tim Peter Bollerslev in 1986. The 2003 Nobel Prize winner, Robert F Engle also added much contribution for the refinement of GARCH model with Tim’s work. Our GARCH INM predictor took the original method of Nelder Mead for GARCH model bu
FREE

The Multi Strategy Ranges Indicator MT5 is a powerful tool designed to detect and visualize price consolidation zones in the market. This indicator identifies ranges and draws them on the chart, providing clear signals for efficient trading. Key Features Our indicator incorporates three essential strategies for trading within consolidation ranges: Range Breakout Strategy: A classic range breakout strategy. When the price breaks the upper or lower boundary of the range, a buy or sell signal i
FREE

Технический индикатор Trend Moving Average позволяет определить глобальное направление рынка. Данный технический индикатор создан для того, чтобы определить «линию наименьшего сопротивления» рынка и понять в какую сторону направлен тренд. Помимо классического использования МА, индикатор позволяет понять направленность рынка на основе динамики его значений. Так, если значение индикатора демонстрируют переход с нисходящего значения в восходящее (и наоборот) - это является дополнительным торговым с
FREE
Candle Timer – Simple & Standalone
This lightweight indicator displays the time remaining before the current candle closes —directly on your MT5 chart. No extra tools or templates needed. Key Features: Clear countdown display for the active candle. Works on all symbols and timeframes. Adjustable font size, color, and screen position. Zero impact on chart performance—minimal resource usage. Standalone: no dependencies or additional indicators required. Purpose:
Helps traders time their entries
FREE
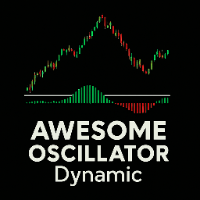
Awesome Oscillator Dynamic Technical indicator that displays, via a histogram, the difference between two simple moving averages (SMA 5 and SMA 34) applied to the median price. Bar colors change automatically to show market momentum: green for bullish, red for bearish. Quick reading: Green above zero → bullish momentum Red below zero → bearish momentum Zero crossover → possible trend change Compatible with any asset and timeframe, no setup required. Uses standard terminal data and appears in a
FREE

Chaikin Money Indicator (CMF) – Free Trading Indicator
The Chaikin Flow Indicator (CMF) is a technical analysis tool based on the original Chaikin Money Flow (CMF) indicator, developed by Marc Chaikin in the 1980s. It is designed to track capital flows into an asset and helps identify buying and selling pressure. This indicator is useful for both intraday trading and medium-term analysis .
How CMF Works CMF analyzes price action and volume over a given period by calculating the Money Flow Mult
FREE

How Momentum Flow Works for You: Momentum Flow employs a sophisticated, multi-stage process to deliver its signals: Momentum Shift Detection: It first identifies significant price impulses using dynamic breakout levels based on the Average True Range (ATR). A built-in cooldown period and direction alternation filter help to screen out weaker, less reliable moves. Adaptive Trend Analysis: The core trend direction is established by a responsive dual Exponential Moving Average (EMA) system. Adapti
FREE

The Candle Smoother is an indicator for MetaTrader 5 that helps you see price movements more calmly and clearly. It removes unnecessary "market noise" and displays the true trend more effectively.
What does the "Candle Smoother Indicator" do?
It smooths the classic candlestick data (Open, High, Low, Close). This filters out chaotic, hectic candles. Additionally, an EMA line (Exponential Moving Average) is calculated based on the smoothed prices. This helps you better recognize where the market
FREE

************************HI! Please note that this the trail version of this indicator, it will expire after one week********************** This is a 1-week trial version of Margin Monitor. For the unlimited full version, click : https://www.mql5.com/en/market/mt5/indicator?filter=margin%20monitor
Are you frustrated with the lack of a dedicated Margin Column in MT4? Well fret no more! This Margin Monitor is exactly what you have been waiting for. FINALLY! Instead of complicated and time c
FREE

Smart Trend Suite Pro – Advanced Trend Indicator with Dashboard & Alerts Overview: Smart Trend Suite Pro is a powerful trend-detection indicator that offers traders a complete set of tools for accurate trend analysis and actionable insights. Designed for versatility and precision, Smart Trend Suite Pro adapts seamlessly to multiple timeframes and market conditions, making it suitable for various trading styles, including scalping and swing trading. Key Features: Real-Time Trend Detection: Identi
FREE

Unlock Market Insights: Dynamic Trend Analysis with Statistical Precision for MT5 Are you seeking a deeper understanding of market movements? Many traditional tools may not fully capture the complex, non-linear dynamics often seen in financial markets. This can sometimes lead to uncertainty in identifying subtle trend shifts. Introducing Adaptive PolyBands Optimizer – an advanced MQL5 indicator designed to enhance your market analysis. Unlike some conventional tools, Adaptive PolyBands Optimizer
FREE
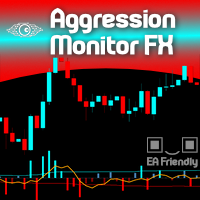
Would you like to monitor the aggression between Buyers and Sellers, minute by minute? Now you can! Welcome to the Aggression Monitor FX ! The Aggression Monitor FX indicator was developed for those markets that do not provide REAL data Volume, i.e. like the Forex market. We developed a way to use 1-minute Tick Volume data generated by Forex (and other) Brokers and manipulate it into "aggression" information in a very visual histogram with additional analysis lines. And it worked! (but hey! you

This indicator works by plotting fractals on the chart as arrows that can be used as buy or sell signals. It is a great tool for both new and experienced traders as it provides a clear visual representation of the market and helps traders identify fractals. Although it repaints, it can be used quite effectively in conjunction with other tools to filter trading strategies.
We use this indicator in this way in our Royal Fractals EA, which you can purchase on the MQL5 Market: https://www.mql5.com
FREE

The TradeQL Indicator is a customizable tool that highlights specific trading patterns on candlestick charts. Users can define patterns through TradeQL queries, which the indicator then applies to the chart, visually representing matches and captured groups. Ideal for identifying complex trade setups in real-time.
TradeQL queries are specified using the TradeQL Language. See https://github.com/abdielou/tradeql for more details. This language is expressed as a regular expression. The language al
FREE

如果产品有任何问题或者您需要在此产品上添加功能,请联系我 Contact/message me if you encounter any issue using the product or need extra feature to add on the base version.
PA Touching Alert is a tool to free you from watching price to touch certain critical price levels all day alone. With this tool, you can set two price levels: upper price and lower price, which should be greater than/less than the current price respectively. Then once price touches the upper price or lower price, alert and/or notification would be sent
FREE

SCALPFLASH-X
Where Fibonacci Precision Meets RSI Intelligence.
Next-gen trading system combining Adaptive Fibonacci Pivots, RSI Heat Mapping, and Smart Candle Analytics. Detect market dominance, momentum shifts, and reversal zones in real time across multiple timeframes. Institutional accuracy, retail simplicity — built for speed, clarity, and precision.
Advanced Multi-Timeframe Fibonacci & RSI-Driven Market Intelligence System ScalpFlash-X — A next-generation trading system combining Fibonacc

Necessary for traders: tools and indicators Waves automatically calculate indicators, channel trend trading Perfect trend-wave automatic calculation channel calculation , MT4 Perfect trend-wave automatic calculation channel calculation , MT5 Local Trading copying Easy And Fast Copy , MT4 Easy And Fast Copy , MT5 Local Trading copying For DEMO Easy And Fast Copy , MT4 DEMO Easy And Fast Copy , MT5 DEMO
Can set the cycle for other varieties of K line graph covered this window, fluctuations obser
FREE

바이너리 옵션용 신호 인디케이터로, 포렉스 및 기타 시장에서도 효과적으로 사용할 수 있습니다. M1–M5 단기 그리드 매매에 적합하며, 단계적인 포지션 증액 신호를 포함합니다. 인디케이터는 2단계 적응 방식을 사용합니다. 첫 번째는 기본 속도 프로파일(시작 단계에서 “빠르게/부드럽게” 모드 선택), 두 번째는 거래 결과에 기반한 자동 적응으로, 승리·손실 신호의 연속을 고려하여 현재 시장에 맞게 필터를 조정합니다. 모델은 차트에서 짧은 방향성 충격(임펄스)을 탐지하고, 바가 마감될 때 CALL(매수)과 PUT(매도) 화살표로 표시하며, 리페인트는 없습니다. 인디케이터는 일반 Forex/CFD 계좌에서도 사용할 수 있지만, 거래 기간이 짧기 때문에 스프레드와 수수료를 철저히 관리하여 비용이 움직임의 대부분을 “잠식”하지 않도록 해야 합니다. 동작 방식 표준 클래식 보조지표 조합 대신, 자체 개발한 다단계 적응형 예측 모델을 사용; 가격 움직임의 형태와 기울기, 추세 및 국부 변동성을

Il WaveForce Indicatorsu un sistema di doppia envelope esponenziale e smussamento dinamico, WaveForce separa matematicamente l'energia rialzista e ribassista, tracciando due curve (Bull e Bear) e una linea di segnale centrale. Questo consente al trader di percepire con chiarezza quale delle due forze stia guidando il mercato. Caratteristiche principali: Calcola la pressione rialzista e ribassista separatamente Include una linea di segnale EMA adattiva per confermare inversioni Oscillatore fluid
FREE

The Forex Gangster Indicator allows you to determine the current trend. If the Forex Gangster Indicator line has moved below the price and turned blue, then you should open deals for an increase. If the Forex Gangster Indicator line has appeared above the price and turned red, then you should open deals for a decrease: The indicator is suitable for any time frames, but it needs to be supplemented with filtering indicators, since by itself it is late and does not have time to give an accurate si
FREE

O indicador Supertrendingsignal imprime um sinal na tela indicando início de uma forte tendência. O sinal não mostra o ponto de entrada com melhor risco retorno, apenas faz a indicação de uma forte tendência. Foi idealizado a partir de um conjunto de médias móveis e volume. Parametros: Periodmalongo: Períodos da média longa Periodmamedio: Períodos da segunda media Periodmamedio2: Perídos da terceira media Periodmacurto: Períodos da média curta. PeriodATR: Períodos do indicador ATR para adequar
FREE

For those traders and students who follow the famous brazilian trader Igor Rodrigues (Mago Trader) here it is his famous 2 EMAs - based on Phi ratios - and packed with a twist: a Filling Area , to easily and visually spot the corresponding trend on the chart. You can turn On and Off this filling. If you don't know Igor Rodrigues and you are a brazilian trader and student, just google for him... Very simple and useful indicator.
If you are looking also for the MACD -based indicator of this trade
FREE

O Indicador identifica relação do Índice com a soma dos principais ativos, funciona para qualquer mercado do mund o, possui um oscilador WPR com a soma dos principais ativos escolhidos, indicando a antecipação do movimento em relação ao Índice. Características WPR com a soma dos papéis escolhidos - branco WPR do papel atual - vermelho Canal de Tendência O indicador pode indicar movimento de entradas, sendo: cruzamento das linhas cruzamento da linha Multi Symbols no -50 cruzamento entre os canai
FREE

Key Features of v1: Smart Compact Layout: Specifically optimized for Crypto (BTC) and Gold (XAU). Prices and Volumes are separated into independent columns. No more overlapping text, keeping your chart clean and professional. ️ Micro-Volume Visibility: A forced rendering algorithm ensures that even the smallest pending orders are visible as micro-bars, so you never miss liquidity details. ️ Smart Status Detection: LIVE DATA: When the broker provides real Level 2 data, the panel glow
FREE
CandleStick Patterns Indicator for MT5 — Professional Pattern Scanner Bring proven candlestick analysis into your workflow. This indicator automatically scans your chart and highlights high-quality reversal and continuation patterns, so you can react faster and with more confidence. Check the “More from author” section on the Market page to see our full suite of indicators. What it does Scans historical and live candles from a user-defined lookback range.
Detects and labels major single- and m

Quantum Volatility Analysis and Market Regime Detection Schrödinger Market Wells (SMW) offers an alternative approach to traditional technical analysis. Unlike standard volatility bands based solely on simple statistical deviations, SMW models price action using principles of Financial Quantum Mechanics . This indicator interprets price as a particle interacting within a "Potential Well," allowing traders to visualize the probability of the price remaining in a range or performing a structural b

MT5 Alert Indicator Please add Ema moving averages 60/100/200 & Rsi period 10 levels 30/70 to your chart. This indicator alert on a trend reversal strategy were - ema 60 > 100&200 - ema 100 < 200 And the Rsi is below 30 FOR BUY SIGNAL
Use this strategy in confluence with a larger timeframe trend in the same direction. This strategy identifies great entry opportunities to enter an early trend.
FREE

고정밀 거래 및 전체 시장을 위해 설계된 슬리피지 분석 라이브 또는 데모 계정 모두에서 이익 실현 및 손절로 모든 포지션을 분석하여 브로커의 슬리피지를 분석할 수 있습니다.
내 다른 개발은 여기에서 볼 수 있습니다
모든 것을 정확하게 식별할 수 있도록 모든 포지션을 이익실현 및 손절매와 함께 사용하는 것이 좋습니다.
도움이 필요하면 구매 후 즉시 저에게 연락하십시오
여러 번 우리는 슬라이딩 옵션이 있고 무엇을 배치해야할지 모릅니다. 자 이제 좋아하는 브로커에서 시장 슬라이드를 분석하고 분석한 시간에 따라 최적의 구성을 사용할 수 있습니다. 일별, 주별, 월별, 연도 등으로 분석할 수 있습니다.
수신 매개변수 -
3가지 고급 구성이 있습니다. - 구성 모드 1회 분석 - 구성 모드 2 평균화 모드 - 구성 모드 3 슬리피지 분석
FREE

For those Price Action traders who love to trade strong Price points, like today's Opening Price (or even yesterday's Price), here is an indicator to ease the identification of those values, drawn directly on your chart! Opening Price will automatically draw a line showing you this point for you, AND, if you like any OPENing price in the past, not just today's price. A must-have in your Price Action toolbox!
SETTINGS
How many past days do you want to be drawn? Do you want to draw the current da
FREE
트레이딩 전략과 기술 지표를 판매하기에 가장 좋은 장소가 왜 MetaTrader 마켓인지 알고 계십니까? 광고나 소프트웨어 보호가 필요 없고, 지불 문제도 없습니다. 모든 것이 MetaTrader 마켓에서 제공됩니다.
트레이딩 기회를 놓치고 있어요:
- 무료 트레이딩 앱
- 복사용 8,000 이상의 시그널
- 금융 시장 개척을 위한 경제 뉴스
등록
로그인
계정이 없으시면, 가입하십시오
MQL5.com 웹사이트에 로그인을 하기 위해 쿠키를 허용하십시오.
브라우저에서 필요한 설정을 활성화하시지 않으면, 로그인할 수 없습니다.