MetaTrader 5용 기술 지표 - 96

This MetaTrader 5 indicator helps traders by identifying and marking two important levels on the chart:
1. Previous Day's High (PDH):
- The highest price reached in the market during the previous trading day.
2. Previous Day's Low (PDL):
- The lowest price reached in the market during the previous trading day.
How it Works:
1. Initialization:
- When you attach the indicator to a chart, it initializes by calculating the PDH and PDL based on the highest and lowest prices of the previo

--- StudentK Ict Smc Structure --- 1. Inner Circle Trading
2. Smart Money Concept
3. Structure
--- What are included in tool --- 1. Market Session Box
2. Kill Zone
3. High/Low
4. Imbalance
5. FU Candle
6. Thicker Wick + Doji Candlestick
7. StudentK's Structure Line
8. Pivot Point
--- Context --- StudentK is not indicated as a master or K Sir for knowledgeable person who claims for winning all the time. (But lots of traders should know the fact that it is rarely truth, especially in fluctuated
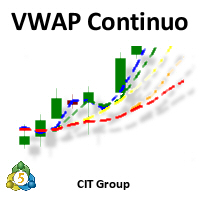
Apresentação:
- O Indicador "VWAP Contínua" da CIT Group é um indicador especializado na bolsa brasileira (B3). Objetivo:
- Especificamente desenvolvido para o perfil de pessoas que operam IntraDay.
Funcionamento:
- Calculado com base nos trades realizados durante o pregão, sendo atualizado a cada 1 segundo, tendo maior precisão dos preços Funcionalidades:
- Entrega de até 5 VWAPs simultâneas, onde as 4 primeiras são configuráveis, e a última é fixa sendo a diária - Opção para visualizar di
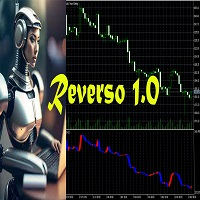
Reverso 1.0 est un Indicateur Technique basé sur la tendance. Cet Indicateur intègre une formule exceptionnelle qui permet de décider au croisement du signal et du prix de clôture d'entrer dans le marché.
Le timeframe indiqué est compris entre 2H et 1D.
Les symboles que je conseille sont les suivants:
BTCUSD-ETHUSD
XAUGBP-XAUEUR-XAUAUD-XAGEUR-XAUUSD
NZDJPY-GBPUSD-EURJPY-GBPJPY-USDJPY-CHFJPY-CADJPY-AUDJPY

The indicator is designed to close positions on the market in time. For example: to take profits ahead of schedule if the price has not reached TakeProfit, and the market is turning around. The indicator analyzes the momentum, not the trend. He does not give any information about the trend. The indicator is well suited for finding divergence. The Ershov 38 Parrots indicator dynamically adjusts to the market and detects price movement impulses of medium and high amplitude. It almost does not rea

Orders SL and TP Values Show
이것은 메인 차트의 선 위에 이익과 손실의 값을 표시하는 지표입니다. 또한, 포인트 단위의 거리가 표시됩니다.
이 지표의 일부 특징은 다음과 같습니다.
주문 손절매 및 이익 실현 값을 보다 정확하게 계산하기 위해 스왑 값을 포함하는 옵션입니다. (기본적으로 활성화됨) 가격 값의 왼쪽에 티켓 번호를 포함하는 옵션입니다. 이것은 터미널의 도구 상자에 따라 레벨을 식별하는 데 유용합니다. (기본적으로 비활성화됨) 값이 손절매 또는 이익 실현인지에 관계없이 이익이 발생하면 파란색으로 칠해지고 손실이 발생하면 빨간색으로 칠해집니다. 동일한 값을 가진 다른 티켓의 손절매 또는 이익 실현이 2개 이상 있는 경우 각각을 올바르게 식별하기 위해 티켓 번호와 함께 정보가 무작위로 회전됩니다. 값은 계정에 있는 통화로 표시됩니다. 포인트도 표시됩니다. 색상 또는 거리는 입력 매개변수를 통해 조정할 수 있습니다. 카운터는 매치된 총 티켓의 현재 인
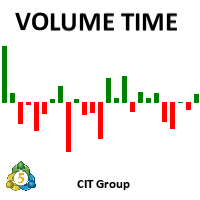
Apresentação:
- O Indicador "Volume Time" da CIT Group é um indicador especializado na bolsa brasileira (B3). Objetivo:
- Especificamente desenvolvido para o perfil de pessoas que operam IntraDay.
Funcionamento:
- Calculado com base nos trades realizados durante o pregão, sendo atualizado a cada 1 segundo, tendo maior precisão dos volumes Funcionalidades:
- Entrega de um conjunto de parâmetros como tipo de indicador (Financeiro, Volume ou Quantidade), estes podendo ser calculado (Unitário, U

Daily supply and demand levels for breakouts or reversals. Use on 1 Hour charts No nonsense, for the confident trader who trades price action supply and demand levels with daily projections without the fluff using 1 Hour charts. MT4 Version: https://www.mql5.com/en/market/product/108234 The Bank Trader Indicator is a sophisticated tool employed by institutional traders, particularly those in banking institutions, to navigate the complex world of forex markets. Rooted in the principles of daily

Make your decisions easier when rolling Covered Call. This robot provides you with information that aids in decision on how and when to roll your structure. It works for any asset in the spot market that has authorized options series on B3 (Brazilian stock exchange). Associate the robot with the asset you want to use for the Covered Call. How to use the robot: Set parameters for your current structure: Purchase price of the base asset in your structure. Code of the Call you used to build your st
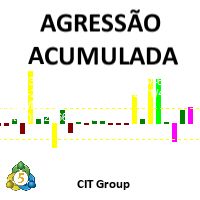
Apresentação:
- O Indicador "Agressão Acumulada" da CIT Group é um indicador especializado na bolsa brasileira (B3).
Objetivo:
- Especificamente desenvolvido para o perfil de pessoas que operam IntraDay.
Funcionamento:
- Calculado com base nos trades realizados durante o pregão, sendo atualizado a cada 1 segundo, tendo maior precisão da agressão
Funcionalidades:
- Entrega de um conjunto de parâmetros para calcular a média de agressão (Volume ou Quantidade), estes podendo ser calculado

ParabolicSAR is a multi-currency professional Expert Advisor that uses a variety of trading strategies in the foreign exchange market. Each of the individual strategies has gone through many years of development and testing on quotes with 100% simulation. Thanks to the use of several strategies for each currency pair, the Expert Advisor is successfully tested with 100% simulation of quotes over a long period of time. IMPORTANT! After the purchase please send me a private message to receive

An Implied Fair Value Gap (IFVG) is a three candles imbalance formation conceptualized by ICT that is based on detecting a larger candle body & then measuring the average between the two adjacent candle shadows.
This indicator automatically detects this imbalance formation on your charts and can be extended by a user set number of bars.
The IFVG average can also be extended until a new respective IFVG is detected, serving as a support/resistance line.
Alerts for the detection of bullish/be

It is 1 Minute Strategy. When Indicator Gives Signal Then Put on Buy. It's Best Work on Crash 300 & Crash 500. If you want to know anything details please Contact Me on Telegram In this Link: https://t.me/+mi_52VwFp3E4MGNl It is very nice for scalping & for who not gives enough time on market.
N/B: Please be carefully it's only for scalping & not trade all the day. It's only 10 or maximum 15 trade per day.
Thanks everyone.

Note: If you want to apply this indicators on indicators which are shown in a sub-window, then consider using this indicator instead: https://www.mql5.com/en/market/product/109066.  ; AIntel Predict - Your Gateway to Future Trading Success! Unlock the power of predictive analytics with AIntel Predict. Say goodbye to the guesswork and hello to improved forecasting, as AIntel Predict leverages historical data to unveil the future of your trades like never before. Whether you're a seasoned tra

Exclusive Arrival: Presenting for the First Time . This is your secret weapon for predicting which way the wind will blow with the next market shift. It assists you in developing your trading strategy by predicting the direction of the next candle. Compatible with forex, stocks, and cryptocurrencies on all timeframes, but higher timeframes are recommended. MT4 Version - https://www.mql5.com/en/market/product/108931/ How does it work ? It's pretty neat. The algorithm separates green and red ca
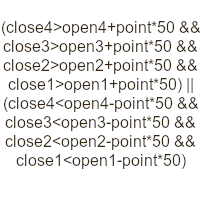
Indicator for research and finding candle bars patterns real time. Options: Alerts - Enabling alerts Push - Enable push notifications BarInd - On which bar to look for patterns for notifications (1 - formed, 0 - forming) ID - Identifier. Appended to the names of graphic objects and to the message Formula - Formula. In the bar price formula: open1, high1, low1, close1, etc. (open0, high25... any number, 0 is also possible - low0, open0...). Counting bars from right to left from zero. You can use

Higher-Lower 지표는 똑똑한 돈 개념 (SMC) 이론을 기반으로 주문 흐름 분석의 기초입니다. 입장 구역 및 오프사이트 분석에 사용됩니다. 지표 참조: Trading HUB 3.0 ICT (The Inner Circle Trader) 본인은 비록 자신이 만들어낸 이 전략에 어떤 이름을 붙이지는 않았지만, 그의 시청자들은 이 전략에 많은 이름을 붙였고, 또한 기본적으로 모두 그가 가르친 단어에서 파생되었다. 예를 들면 ICT는 흔히 똑똑한 돈을 말하기 때문에 SMC (똑똑한 돈 개념) 가 생겼다;ICT가 시장 방향(bias)을 분석할 때 order flow를 많이 사용해 주문 흐름이 생겼습니다.ICT는 어떤 지표도 사용하지 않고 나체 K선만 보기 때문에 가격 행위라고 할 수도 있다. 내가 이해하는 ICT 전략은 주로 Time X Price Theory(시간 가격 이론), PD Arrays(할인 프리미엄 모델) 및 IPDA(은행 가격 전달 알고리즘)에 기반한 실용적인 방법입니
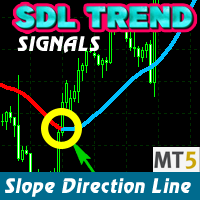
The SDL Trend Signals MT5 indicator shows the market direction with a colored moving average line. It has three inputs: Period (calculation period), Method (calculation method), and Applied price (price used for calculations).
The indicator has three buffers: Uptrend, Downtrend, and ExtMapBuffer (for indicator values). The Bullish slope is in BLUE, and the Bearish slope is in RED. For example, an upward slope indicates a Bullish market (Blue), and a downward slope indicates a Bearish market (R

Note: This indicator is for sub-window use and not for the main chart. If you need to apply it for the indicators in the main chart, then use this indicator instead: https://www.mql5.com/en/market/product/108876 AIntel Predict - Your Gateway to Future Trading Success! Unlock the power of predictive analytics with AIntel Predict. Say goodbye to the guesswork and hello to improved forecasting, as AIntel Predict leverages historical data to unveil the future of your trades like never before. Whe

이 지표는 전일, 주, 월의 최고 및 최저 가격을 보여줍니다. 극한 지점의 돌파를 식별하고 거래 진입 방향을 결정하도록 설계되었습니다. 반전 수준을 보다 정확하게 결정하기 위해 피보나치 수준을 표시할 수 있습니다. 또한 이전 청구 기간 동안의 가격 변동을 보다 명확하게 보여주기 위해 최고 가격과 최저 가격 사이의 공간에 표시할 수도 있습니다. 현재 캔들(바)이 닫힐 때까지의 시간을 나타냅니다.
버전 2.0에는 3가지 새로운 지그재그 반전 신호 레벨이 추가되었으며 각 레벨에 대한 경보를 제공합니다. This indicator shows the maximum and minimum prices of the previous day, week and month. Designed to identify breakouts of extreme points and determine the direction of entry into a trade. To more accurately determine
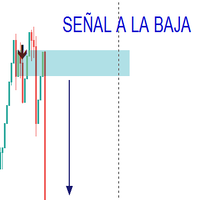
El indicador trabaja con patrones funcionales y divergentes obteniendo del mercado las mejores señales para compra y venta, ha sido testeado por 2 años mediante la estrategias personalizada. El indicador envia la señal para la compra y venta de acuerdo al analisis desarrollado en el mercado. Solo ha sido comprobado en el mercado de indice sintetico (CRASH, BOOM VOLATILITY, STEP)

In the dynamic world of financial markets, staying ahead of the curve is paramount. Traders and investors require sophisticated tools to analyze market trends, make informed decisions, and optimize their strategies. Introducing the Moving Average of Accumulation/Distribution (MAAD) Indicator – a powerful tool designed to provide insightful signals for navigating the complexities of the financial landscape. Key Features: Precision in Trend Analysis: The MAAD Indicator employs a moving average met

이 지표는 동일한 차트에서 추적하려는 다른 기간 캔들스틱을 효율적으로 추적합니다.
1. 동일한 차트에 막대를 로드하려면 더 높은 기간을 선택하세요.
2. 촛대의 색상과 스타일을 사용자 정의하세요
3. 캔들스틱을 그릴 막대 수를 선택하세요.
4. 심지 및 몸체와 함께 더 높은 기간의 전체 양초를 추적합니다.
5. 차트 전환을 원하지 않는 사람들을 위해 쉽고 편리합니다.
이 지표는 동일한 차트에서 추적하려는 다른 기간 캔들스틱을 효율적으로 추적합니다.
1. 동일한 차트에 막대를 로드하려면 더 높은 기간을 선택하세요.
2. 촛대의 색상과 스타일을 사용자 정의하세요
3. 캔들스틱을 그릴 막대 수를 선택하세요.
4. 심지 및 몸체와 함께 더 높은 기간의 전체 양초를 추적합니다.
5. 차트 전환을 원하지 않는 사람들을 위해 쉽고 편리합니다.
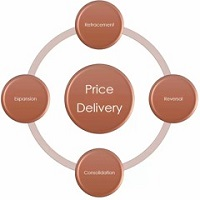
Consolidation is when price is moving inside a clear trading range. When prices are consolidated it shows the market maker placing orders on both sides of the market. This is mainly due to manipulate the un informed money. This indicator automatically identifies consolidation zones and plots them on the chart. The method of determining consolidation zones is based on pivot points and ATR, ensuring precise identification. The indicator also sends alert notifications to users when a new consolida

The Hurst Exponent gauges a time series' long-term memory and is named after Harold Edwin Hurst. The MetaTrader's Hurst Exponent Indicator analyzes an asset's price memory, helping predict future trends. It's valuable for traders of all levels, suitable for various styles like scalping or swing trading.
In Forex terms, the Hurst Exponent measures a series' dependence, indicating whether it regresses to the mean or clusters in a direction. H values between 0.5-1 suggest positive autocorrelation

MT5 RSI Experiment: This indicator leverages the Relative Strength Index (RSI) and floating levels to pinpoint potential buy and sell signals.
The code uses enums for prices and RSI calculation methods. These enums define indicator parameters.
Input variables include RSI period, price type for RSI calculation, smoothing method, and look-back period with levels for floating levels.
Index buffers store RSI fill, RSI up line, RSI middle line, RSI down line, and trend line data.
For each bar, i
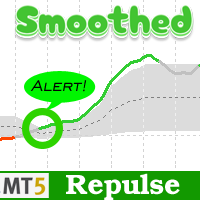
Smoothed Repulse Alert MT5 Indicator
The Smoothed Repulse Alert for MT5 is a powerful tool that visualizes market pressure through a filled area chart and two lines in a separate window. This indicator is based on the repulse indicator, assessing buying and selling pressure using high, low, open, and close prices over a specified period.
Key Features: - Customizable parameters include repulse period, moving average type, moving average multiplier, level period, upper and lower levels. - Color

This indicator builds upon the previously posted Nadaraya-Watson smoothers. Here we have created an envelope indicator based on Kernel Smoothing with integrated alerts from crosses between the price and envelope extremities. Unlike the Nadaraya-Watson estimator, this indicator follows a contrarian methodology.
Please note that by default this indicator can be subject to repainting. Users can use a non-repainting smoothing method available from the settings. The triangle labels are designed so

Elliott Wave Principle, developed by Ralph Nelson Elliott , proposes that the seemingly chaotic behaviour of the different financial markets isn’t actually chaotic. In fact the markets moves in predictable, repetitive cycles or waves and can be measured and forecast using Fibonacci numbers. These waves are a result of influence on investors from outside sources...

Scalping and Binary Signal Detector - Scalping indicator that gives directional signals for opening positions along the trend.
The indicator is a complete trading system that can be used for Forex and binary options.
The system of algorithms allows you to recognize intense price movements in several consecutive bars.
The indicator provides several types of alerts for arrows.
Works on any trading instruments and time frames (M5 or Higher recommended).
How to use for trading
The appearance of a

The indicator enables very quick orientation in the market phase (re/accumulation, re/distribution, up/down trend). It is counted only
from price data (without volume).
It is based on the assumptions of Wyckoff's law of Causa and Effect. Oscillations are an expression of the level of market uncertainty and point to the presence of Big Money. Such a "storm" is followed by a calmer trend that needs to be exited. You need to use other tools or shorter period of the same indicator for that.
I keep t
FX Zone Trend로 거래 잠재력을 발휘하세요 - 간편한 수익의 길로! 명확한 신호와 끝없는 가능성으로 거래를 높여보세요! 복잡한 지표로 혼란스러워졌나요? FX Zone Trend는 복잡성을 제거하고 명확한 신호를 제공하여 쉬운 결정을 돕는 강력한 MT5 지표입니다. FX Zone Trend를 선택하는 이유: 간소화된 거래: 복잡한 차트나 혼란스러운 지표 없이 명확한 신호를 제공합니다. FX Zone Trend는 간단하게 결정을 내릴 수 있도록 도와줍니다. 핵심 다양성: 숙련된 트레이더든 초보든, FX Zone Trend는 모든 거래 전략과 조화를 이룰 수 있습니다. 자신만의 방법을 만들거나 추가적인 확인 레이어로 사용하세요. 당신의 전략, 당신의 방식: FX Zone Trend 신호를 기반으로 자신만의 전략을 만들어 보세요. 기존 방법과 매끄럽게 통합되어 기존 방식을 강화합니다. FX Zone Trend 최적화 방법: 자유롭게 여러분의 거래 방

Ai teulendeu seupoteo(D Originals).
oehwan-ui mollag.
ulineun jongjong "beulokeolijiga eotteohge don-eul beonayo?"lago mudgo, jag-eun geolaeeseo seunglihan geos-eul chughahabnida.
hajiman (D Originals)leul sayonghago namyeon "naneun eotteohge haluachim-e bujaga dwaessji?"lago jamunhage doel geos-ibnida.
So Deep, Action-eun mogsoliboda deo keuge malhabnida.
Ai Trend Spotterleul sayonghamyeon da-eum-eul dulyeowohaji maseyo.
*sijang jojag
*sijang banjeon
* jeogyeogsu jin-ib mich jonjae
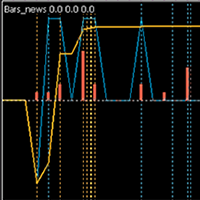
Indicator of news linked to a bar. The published current value of the news has a characteristic impact on the currency it relates to: positive, negative, neutral . The indicator summarizes all these values for the selected period, taking into account the importance of the news: high, medium, low . As a result, a percentage is calculated for the currency pair, which shows the news of which currency is dominant. If the value is positive, then the pair has news pressure towards BUY, if negative - S

This is my trusted friend of trading.
So... I musted re-write this in MQL5 to use in brokers where there is only MT5.
The indicator is like a mother-in-law, who talks often, talks a lot and often inappropriately.
The indicator, in addition to giving us an entry signal on parameters which I will then list, monitors the trend of the hourly timeframe, OSMA to understand the entry direction, RSI to sense any overbought or oversold conditions from which to abstain, ATR for the volatility and ADX fo
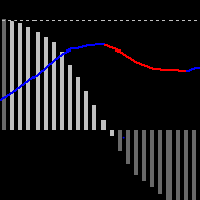
This indicator shows the MACD line and the difference WMACD - MACD to it. that is, the divergence between price and weighted acceleration. Divergence is shown with a histogram. It took a bit of math to get a readable result.
What does the histogram say?
If the course is consistent with the price movement, then the price is driven by volumes. It is passing through an area of higher liquidity, the market is being manipulated by strong money. Within Wyckoff's theory, these are typically climax and

Introducing FX Zone Custom Time OHLC Candle - Your Effortless Solution for 1-Minute Chart Analysis! Unleash the Power of Precision with Simplicity! Are you tired of complex indicators that clutter your charts? Meet FX Zone Custom Time OHLC Candle, a user-friendly tool designed for traders who value simplicity and precision in their 1-minute chart analysis. Key Features: Easy and Intuitive: Navigate effortlessly with a clean interface, making chart analysis a breeze. Custom Time OHLC

Introducing the Ultimate Custom Time Range Indicator: Unlock Precision in Your Trading Strategies! Versatile Applications: Ideal for kill zones, trading sessions, and time macro analysis, silver bullet timings. You can have as many time ranges as you need to help identify the highest to lowest range within the specified start to end broker time. Note: most brokers operate in GMT +3 - so please convert and use your own broker time.

The Price Spectrum indicator reveals opportunities for detailed market analysis. Advantages: Market Volume Profile Creation : The indicator assists in analyzing the dynamics of trading volumes in the market. This allows traders to identify crucial support and resistance levels, as well as determine market structure. Filtering Insignificant Volumes : Using the indicator helps filter out insignificant volumes, enabling traders to focus on more significant market movements. Flexible Configuration S

Fibonacci Master Pro is an advanced Fibonacci projection indicator designed to optimize your trading strategies. It incorporates the principles of Fibonacci technical analysis, providing precise projections and entry and exit opportunities in the market.
Fibonacci Master Pro draws upward and downward Fibonnaci Projections based on the maximum and minimum value of the candle you specify.
Key Features :
**Accurate Projections:** Using sophisticated algorithms, Fibonacci Master Pro calcula
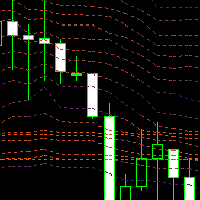
Market Profile, Volume Profile? Extra paid in TradingView, displayed for the last moment in time or discreetly, e.g. after 24 hours. Counting super-accurate values from a histogram...?
None of these ways suited me. I was looking for an expression of the dynamics of the market, its liquidity, I just wanted to clearly see where the money was flowing. I thought I would calculate the volume weighted price percentiles for a certain period.
To make the calculation more accurate, I calculate from a low

This indicator presents an alternative approach to identify Market Structure. The logic used is derived from learning material created by DaveTeaches (on X)
Upgrade v1.10: + add option to put protected high/low value to buffer (figure 11, 12) + add Retracements value to buffer when Show Retracements
When quantifying Market Structure, it is common to use fractal highs and lows to identify "significant" swing pivots. When price closes through these pivots, we may identify a Market Structure S

Hello, In this indicator, I started with a simple moving average crossover algorithm. However, in order ot get more succesfull results, I created different scenarios by basin the intersections and aptimized values of the moving averages on opening, closing, high and low values. I am presenting you with the most stable version of the moving averages that you have probably seen in any environment. We added a bit of volume into it. In my opinion, adding the Bollinger Band indicator from the ready-

All about time and price by ICT. This indicator provides a comprehensive view of ICT killzones, Silver Bullet times, and ICT Macros, enhancing your trading experience. In those time windows price either seeks liquidity or imbalances and you often find the most energetic price moves and turning points. Features: Automatic Adaptation: The ICT killzones intelligently adapt to the specific chart you are using. For Forex charts, it follows the ICT Forex times: In EST timezone: Session: Asia: 20h00-0

Cobra Pivot Points는 DEMO를 다운로드하여 직접 백테스트할 수 있는 가장 최적화된 피벗 포인트를 표시하는 지표입니다.
1. 두 가지 최고의 피벗 모드 선택: Cobra Pivots 또는 Camrilla Pivots
2. D1에 국한되지 않고 원하는 시간대를 사용할 수 있습니다.
3. Shift 매개변수를 사용하면 전일 고저 종가 값으로 플레이할 수 있습니다. 1 = 이전 막대, 2 = 이전 막대 앞의 막대 등. 이 매개변수는 피벗에 대한 연구 및 개발에 도움이 됩니다.
4. 레벨 터치 시 경고, 이메일 또는 푸시 알림을 한 번 누릅니다. 레벨을 터치하면 피벗 레벨이 완화된 것으로 간주되어 다시 경고하지 않습니다. 알림을 다시 받으려면 기간을 변경하여 알림을 재설정해야 합니다.
5. 선 색상, 선 스타일, 선 너비, 텍스트 색상 및 글꼴을 완전히 사용자 정의합니다.
Cobra Pivots는 LZone(스캘핑을 위해 매우 가까운 레벨), NZone(시장이 통

마를리 인디케이터: MT4 및 MT5에서의 정밀 트레이딩 MT4 및 MT5에서 뛰어난 신호 정확성을 제공하는 마를리 인디케이터로 트레이딩을 향상시키세요. 이 다재다능한 도구는 암호화폐와 외환 시장에 최적화되어 있으며, 귀하의 트레이딩 전략에 정밀함과 유연성을 제공합니다. MT4와의 원활한 통합: MT4 플랫폼 사용자를 위해, 마를리 인디케이터는 완벽하게 호환되며 여기 에서 접근할 수 있습니다. 암호화폐 및 외환 시장 최적화: 암호화폐 우수성 : 마를리 인디케이터는 동적인 암호화폐 시장에 맞춰 특별히 조정되어, 암호화폐 트레이딩을 탐색하는 데 필수적인 정확하고 시기적절한 신호를 제공합니다. 외환 친화적 기본 설정 : 외환 시장에서도 마찬가지로 효과적이며, 다양한 시장 조건에서의 다용도성과 신뢰성을 위해 조정되어 있습니다. 주요 기능: 유연한 표시 옵션 : 시각적으로 두드러지는 화살표 또는 정보가 풍부한 텍스트 라벨 중에서 선호하는 신호 표시 방법을 선택하세요. 조절 가능한 감도

거래 정밀도를 높이세요. Candlestick Pattern Alert MT5 지표는 주요 캔들 패턴을 신속히 감지하고 실시간 알림을 제공하는 강력한 도구로, 높은 확률의 설정에 트레이더가 대응할 수 있도록 합니다. 1990년대 스티브 니슨에 의해 대중화된 일본 캔들 차트 원리에 기반한 이 지표는 해머, 도지, 엔굴핑 같은 패턴을 통해 시장 심리를 해독하는 능력으로 시장, 외환, 암호화폐, 주식 트레이더들에게 사랑받습니다. 수동 분석을 간소화하여 시간을 절약하고, 정확성을 높이며, 기회 손실을 줄입니다—EURUSD, BTCUSD, XAUUSD 같은 변동성 시장에서 트렌드 반전이나 지속을 활용하려는 스캘퍼, 데이 트레이더, 스윙 트레이더에게 완벽합니다. Candlestick Pattern Alert MT5는 즉각적인 패턴 인식을 위해 차트에 녹색(매수)과 적색(매도) 화살표를 오버레이하며, 명확성을 위해 사용자 정의 텍스트 레이블(기본 크기7, 오프셋20%)을 제공합니다. 14가지 주
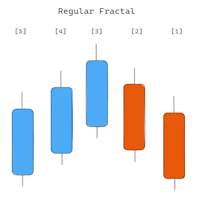
표시기는 더 높은 기간의 프랙탈을 표시합니다. 프랙탈에는 '일반 프랙탈'과 'BW 프랙탈'의 두 가지 유형을 표시할 수 있습니다. 프랙탈 'UP'의 형성을 고려하십시오. '일반 프랙탈'은 이후의 '고가'(중앙 막대의 왼쪽과 오른쪽)가 더 작은 매우 엄격한 프랙탈입니다. 반면 'BW Fractal'에는 단 하나의 조건이 있습니다. 중앙 막대(가격 '높음')가 가장 높아야 합니다. 시각적으로 이 두 모드의 차이점은 다이어그램 1에서 확인할 수 있습니다. '더 높은 기간' 매개변수는 현재 매개변수보다 커야 하며, 이 요구 사항이 충족되지 않으면 오류에 대한 설명이 포함된 경고가 발생하고 표시기가 작동하지 않습니다. 또한 최적화를 위해 새로운 바에서만 검색이 이루어집니다. 또한 '다운로드 기록 강제' 옵션도 무시할 수 없습니다. 이 옵션은 주말에 잘 작동합니다. 높은 시간대 기록을 강제로 다운로드합니다.

시장 강세 및 심리지표로 매매 결정을 최적화하고 더 이상 추세에 역행하는 트레이딩을 하지 마세요!
정확하고 시기 적절한 정보를 중요시하는 진지한 트레이더를 위해 세심하게 설계된 이 지표는 28개 주요 통화쌍을 매우 간단한 방법으로 한눈에 볼 수 있습니다. 이 도구는 인기도, 강세 또는 약세 추세 강도, 매수자 및 매도자 비율 / MT5 버전을 기준으로 통화쌍의 순위를 매길 수 있습니다.
특징 실시간 추세 강도: 각 통화쌍의 추세 강도를 정확하게 평가하여 거래 기회를 파악할 수 있는 확실한 가이드를 제공합니다. 매수자 및 매도자 분석: 각 통화쌍에 대한 매수 및 매도자 강세 순위를 통해 시장 역학에 대한 즉각적인 통찰력을 얻고 중요한 움직임을 예측할 수 있습니다. 트레이더 관심도: 각 통화쌍에 대한 트레이더 관심도 및 활동 데이터에 액세스하여 새로운 추세와 잠재적 전환점을 더 잘 이해할 수 있습니다. 직관적이고 사용자 지정 가능한 대시보드: 사용하기 쉬운 대시보드를

Right hand очень точно воспроизводит колебания цены. Когда рынок растет, кривая Right hand идет вверх. Хотя иногда бывает так, что кривая идет вверх, в то время как цена консолидируется и нет тренда вверх. Аналогично, когда рынок падает, кривая тоже убивает, исключения возникают так же в зоне консолидация рынка. Анализ большого количества графиков Индекса Направленнрго Тренда ( DTI )позволяет выявить его специальные характеристики, полезные при отслеживании тренда. В положительной области т.е

The "ZScore Quantum Edge" is based on an advanced algorithm that combines volume analysis and price movement, providing a clear and accurate representation of market trends. Key Features: In-Depth Trend Analysis : The indicator uses a configurable period for trend analysis, allowing traders to adjust the indicator's sensitivity according to their trading strategies. Data Smoothing : With an adjustable range for data smoothing, the "ZScore Quantum Edge" offers a clearer view of the market, minimi

Operating Principle: The "RSDForce" merges trading volume analysis and price movements to provide valuable market insights. Here's how it works: Volume and Price Analysis : The indicator examines the trading volume (quantity of traded assets) and price variations over time. Market Force Calculation : It calculates a value that reflects the market's 'force', indicating whether the price trend is strong and based on substantial trading volume. Simple Visualization : The result is displayed as a li

혁신적인 기본 캔들 패턴 대시보드는 차트에서 수익성 있는 캔들 패턴을 자동으로 식별하도록 특별히 설계되었습니다. 이 대시보드는 고급 알고리즘을 사용해 실시간으로 가격 차트를 스캔하고 클래식부터 복잡한 패턴까지 다양한 캔들 패턴을 감지합니다. 또한 감지된 패턴을 다양한 시간대에 시각화할 수 있는 사용하기 쉬운 인터페이스가 있어 정보에 입각한 결정을 쉽게 내릴 수 있습니다 / MT4 버전
무료 보조지표: Basic Candlestick Patterns
하모닉 패턴 포함 상승 패턴 Hammer Inverse hammer Bullish engulfing Morning star 3 White soldiers 약세 패턴 Hanging man Shooting star Bearish engulfing Evening star 3 Black crows
표시기 열 Symbol: 선택한 기호가 표시됩니다. Pattern: 패턴 유형(해머, 역해머, 강세잉태형...) Bar:

"Introducing Dynamic Supply and demand Pro – Your Ultimate Supply and Demand Trading Companion! Unleash the power of precision with this advanced indicator designed for traders seeking unparalleled market insights. Dynamic Supply and demand Pro dynamically identifies key reversal zones, showcasing the delicate dance between supply and demand forces.
This cutting-edge tool provides a comprehensive view of the market, highlighting potential turning points with pinpoint accuracy. Witness the ebb a
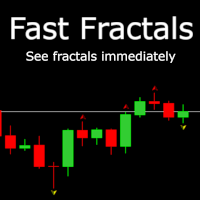
Info: It's like built in Fractals indicator but faster. Usually it shows the signal after 2 bars but FastFractals indicator shows signals immediately and that's is incredible. You can create scalp strategies with it or trade yourself. This indicator uses neural network to analyze price graph and predict. It was trained on 4 hours interval on EURUSD pair, but you can use it with different periods and instruments. There is only one minus in this indicator, it hasn't got 100% accuracy. See pictures

Tatino Super Signals is Non Repaint Indicator for Binary Option trading and Forex trading. Recommendations:
Timeframe: All timeframes. For best results we recommend using it on M1, M5 and M15 timeframes. Currency pairs: All Pairs Account type: All Type Broker time: Any Brokers : Alls Binary Trading : Expired 1 Candle Buffer Buy=1, Sell=0, Entry Next Candle Recommended Forex trading stop loss : 15 pips Recommended Forex tradingTake profit levels : 15 pips
Specifications:
Does not repaint Pa

RFX5 Bull Bear Powers indicator shows the absolute power of bulls and bears controlling the market. Both powers are shown simultaneously with red and green colors for bear and bull powers respectively. When red line goes over the green line it means that bears are controlling the market. When green line goes over the red line it means that bulls are controlling the market. The green/red horizontal symbol line at the bottom of the indicators shows which party has more strength. Time Frame: M3
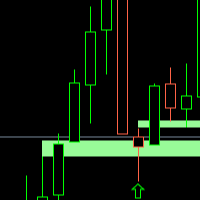
FVG WATCHER is an indicator that helps traders identify fair value gaps in the market. The indicator draws fair value gaps and alerts the user when the fair value gap has been swept. It allows users to specify how it should be swept, what time range to alert, and the size of the fair value gap to alert. It also allows the user to apply a moving average trend filter for better choice of alerts. The indicator also allows push mobile notifications. What makes FVG Watcher special is that it can be

The PUA MultiType Pivot indicator is built on the daily chart of the previous day. The PUA MultiType Pivot indicator is one of the most popular tools in technical analysis, used by traders to identify potential reversal points in financial markets. This indicator constructs three types of Pivot points: Classic, Fibonacci, and Camarilla, each offering its unique approach to market analysis. The advantages of this indicator include: Simplicity and Clarity PUA MultiType Pivot provides clearly defi
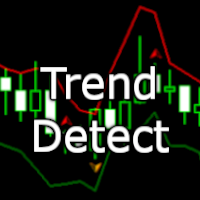
Trend change detector is an indicator for Metatrader 5.It can help you determine the change in a local trend to open a correct position. It has 2 parameters. Period and mistake offset percent. You can change the period parameter to capture little changes in trend. There are two lines: the red one and the green one. You can use them as a local support and resistance level. Arrows show the change in a trend. Up arrow the price will go down and Down arrow the price will go up. Also, by changing m

Created by imjesstwoone and mickey1984, this trade model attempts to capture the expansion from the 10:00-14:00 EST 4h candle using just 3 simple steps. All of the information presented in this description has been outlined by its creators, all I did was translate it to MQL5. All core settings of the trade model may be edited so that users can test several variations, however this description will cover its default, intended behavior using NQ 5m as an example. Step 1 is to identify our Price Ra

AI 지원 저항 지지선과 저항선을 검색하는 지표입니다. 검색은 수치 분석 및 데이터 처리를 위한 알고리즘을 사용하여 수행됩니다. 세 가지 검색 옵션을 사용할 수 있습니다("모드 #1", "모드 #2" 및 "모드 #3"). 이러한 각 옵션은 내부 알고리즘이 다릅니다(현재는 완전히 내부 설정이므로 사용자가 사용할 수 없습니다). 이러한 옵션은 검색 심각도에 따라 다르다고 말할 수 있습니다. 제한사항 : 현재 표시기에는 특정 최소 막대 수가 필요합니다. 막대가 충분하지 않으면 표시기를 찾으십시오. 자원 절약: 너무 자주 다시 계산하지 않고 컴퓨터의 계산 기능에 과부하가 걸리지 않도록 표시기는 30바마다 한 번씩 검색합니다. 라인 이름: 줄 이름에는 "sup_" 또는 "res_"가 있습니다. 기간과 내부 회선 번호도 있습니다.

El indicador Global Average es una media móvil que difiere significativamente de las medias móviles tradicionales. Su función principal es proporcionar un precio objetivo de take profit que sirve como referencia para la estrategia de regresión a la media. Este manual detallará la estrategia de Venta/Compra basada en este indicador, que implica medir el primer impulso del precio despues de romper la media del indicador, luego avanzar con el nivel de Global Average , y vender/comprar cuando el pre

The BS Vwap 5 Bands indicator is an advanced tool that integrates price and volume data, providing a comprehensive view of market dynamics. Designed with a focus on performance and tested under real trading conditions, this indicator aims to deliver valuable insights to traders. Its innovative approach combines VWAP with five distinct bands, revealing whether the price is aligned with the "fair price" and indicating overbought or oversold conditions. Additionally, the indicator offers visual cus
The Donchian Channel Indicator helps to identyfy the market trend and the breakouts of the channel. Breaking above means the momentum of the market is highly bullish. Breaking below means the momentum of the market is highly bearish.
SETTINGS: PERIOD - default value 20. The number of last candles beeing taken into account when generating the line. OFFSET - default value 0. The percentage number that makes the channel bigger or smaller. LINE_COLOR - default color is set Blue. Here you can set wh
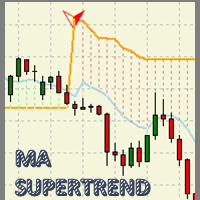
MA Super Trend MT5 An indicator based on the average maximum and minimum of a candle period, and next to the average true range (ATR) result in a powerful visual work tool to optimize the trend zones and potential areas of market entry. With great adaptability in any type of financial asset and with a potential for visual simplification in the graph, which will make the graph a simple work table. An indicator created to measure: - For MT5 desktop platform. - Great for Day trading, Swing Trading

Elevate Your Trading Experience with the famous UT Bot Alert Indicator!
Summary: The UT Bot Alert Indicator by Quant Nomad has a proven track record and is your gateway to a more profitable trading journey. It's a meticulously crafted tool designed to provide precision, real-time insights, and a user-friendly experience.
Key Features: 1. Precision Analysis: Powered by advanced algorithms for accurate trend identification, pinpointing critical support and resistance levels. 2. Real-time Alert
Introducing the Pivot Point SuperTrend MT5 version of the Trading View indicator by LonesomeTheBlue.
A revolutionary script designed to optimize your trading strategies by combining the power of Pivot Points with the precision of SuperTrend indicators. This unique algorithm offers an enhanced approach to identifying and staying within trends, delivering unparalleled performance in today's dynamic markets.
Key Features: Enhanced Trend Identification: By integrating Pivot Points and calculating

The new update makes this indicator a complete tool for studying, analyzing and operating probabilistic patterns. It includes: On-chart Multi-asset percentage monitor. Configurable martingales. Twenty-one pre-configured patterns, including Mhi patterns and C3. An advanced pattern editor to store up to 5 custom patterns. Backtest mode to test results with loss reports. Trend filter. Hit operational filter. Martingale Cycles option. Various types of strategies and alerts. Confluence between patter
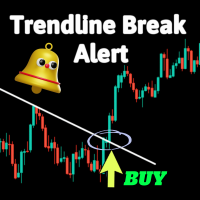
이것은 트렌드 라인 브레이크에 대한 경고를 제공하는 간단한 지표입니다.
거래에서 트렌드 라인을 사용하는 데 익숙한 경우 유용할 수 있습니다. 조정 가능한 매개 변수에는 다음이 포함됩니다.
캔들 식별기 : 브레이크 후 어느 캔들에 신호를 보낼지 그리고 3 종류의 경고 : 이메일 보내기 들을 수있는 경고음 푸시 알림
테스트 목적으로 MetaTrader 5의 전략 테스터가 트렌드 라인을 그릴 수 없으므로 MetaTrader 4를 사용하는 것을 권장합니다.
MT4 버전 : https://www.mql5.com/en/market/product/111112?source=Site+Market+My+Products+Page
전화에서 알림 경고를 설정하는 방법을 배우려면이 비디오를 시청하십시오 :
https://www.youtube.com/watch?v=4oO-3fMQ4QA
설치 가이드 :
https://www.mql5.com/en/blogs/post/739828
https:
MetaTrader 마켓은 MetaTrader 플랫폼용 애플리케이션을 구입할 수 있는 편리하고 안전한 환경을 제공합니다. Strategy Tester의 테스트를 위해 터미널에서 Expert Advisor 및 인디케이터의 무료 데모 버전을 다운로드하십시오.
MQL5.community 결제 시스템을 이용해 성능을 모니터링하고 원하는 제품에 대해 결제할 수 있도록 다양한 모드로 애플리케이션을 테스트할 수 있습니다.
트레이딩 기회를 놓치고 있어요:
- 무료 트레이딩 앱
- 복사용 8,000 이상의 시그널
- 금융 시장 개척을 위한 경제 뉴스
등록
로그인
계정이 없으시면, 가입하십시오
MQL5.com 웹사이트에 로그인을 하기 위해 쿠키를 허용하십시오.
브라우저에서 필요한 설정을 활성화하시지 않으면, 로그인할 수 없습니다.