MetaTrader 4용 Expert Advisor 및 지표 - 46
The VR Close orders script is designed to close positions in the terminal at a profit or loss mark set by the trader. The program is written as a script and can work together on the same chart with any other indicators and expert advisors. The program has a simple visual panel and is easy to configure with the mouse. With this program's help, the trader can automatically close positions and delete orders depending on the conditions set. There is often a situation when you need to close position
FREE
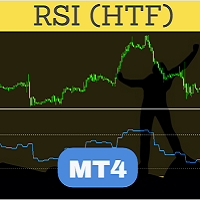
Perfected RSI (Relative Strength Index) HTF (Higher Time Frame) is perhaps the most advanced and reliable HTF indicator. Highly optimized in terms of execution, the indicator comes with standard settings of the RSI indicator which is supplied with the MT4 platform. Place the indicator on the chart, any timeframe. You may select a higher time frame in indicator inputs. The same indicator can be used on a chart multiple times to draw RSI from multiple timeframes or for different RSI period values
FREE

Overview:
The Coloured Parabolic SAR Indicator is a visually enhanced trading tool designed to make trend-following and trade identification easier. This customizable indicator provides clear visual cues with color-coded signals for bullish (buy) and bearish (sell) trends directly on your MT4 chart. Key Features: Color-Coded Signals : Lime green "o" symbol for Buy signals. Red "o" symbol for Sell signals. Customizable Inputs : Adjustable Step and Maximum parameters to fine-tune the Parabolic SA
FREE

Elevate Your Trading with Albert Einstein’s Calculated Universe for MT4! Step into the world of genius with Albert Einstein’s Calculated Universe, the revolutionary Expert Advisor (EA) meticulously crafted for MetaTrader 4 (MT4). This EA transforms the complexities of trading into a precisely engineered system of profits and advanced risk management. Ideal for traders who demand unmatched precision, adaptability, and high performance, this EA is your ultimate partner in the forex market. Join th
FREE
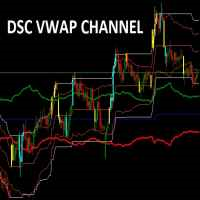
Corretora recomendada para usar esse indicador: https://tinyurl.com/5ftaha7c
Indicador usado para sabermos os pontos de suporte de resistência no gráfico. Funciona em todos ativos e timeframes.
Acerte exatamente os pontos de entradas e saídas das suas operações. SEE OUR RESULTS ON INSTAGRAM: https://www.instagram.com/diogo.cansi/ TELEGRAM GROUP = https://t.me/robosdsc More information by email dscinvestimentos@gmail.com or by Whatsapp 55-991372299
FREE

개요 True Strength Index(TSI) 지표는 MT4의 별도 창에 표시되는 모멘텀 오실레이터입니다. 모멘텀(MTM)과 그 절대값을 두 번의 지수 이동평균(EMA)으로 부드럽게 처리한 뒤, 그 비율에 100을 곱해 산출합니다. TSI는 시장 추세의 강도와 전환점을 시각적으로 파악하는 데 유용합니다. 주요 기능 이중 EMA 부드러움 처리로 노이즈 감소 및 깨끗한 선 형태 제공 신호 EMA 오버레이로 진입·청산 타이밍 보조 –100에서 +100 범위 자동 스케일링 0 및 ±50 레벨 라인 표시로 가독성 향상 Fast EMA, Slow EMA, Signal EMA 기간을 자유롭게 설정 가능 설치 방법 MT4에서 “파일” → “데이터 폴더 열기”를 선택합니다. TSI.mq4 파일을 MQL4\Indicators 폴더에 복사합니다. MT4를 재시작하거나 “네비게이터” 창에서 우클릭 후 “새로 고침”을 선택합니다. 차트 상단 “삽입” → “사용자 지정” → “TSI”를 차례로 클릭한 후
FREE
Highly configurable Macd indicator.
Features: Highly customizable alert functions (at levels, crosses, direction changes via email, push, sound, popup) Multi timeframe ability Color customization (at levels, crosses, direction changes) Linear interpolation and histogram mode options Works on strategy tester in multi timeframe mode (at weekend without ticks also) Adjustable Levels Parameters:
Macd Timeframe: You can set the lower/higher timeframes for Macd. Macd Bar Shift: you can set the o
FREE

The Magic SMA indicator is of great help in determining trend direction. It can be an excellent addition to your existing strategy or the basis of a new one. We humans can make better decisions when we see better visually. So we designed it to show a different color for rising and falling trends. Everyone can customize this in the way that suits them best. By setting the Trend Period, we can optimize it for longer or shorter trends for our strategy. It is great for all time frames.
IF YOU NEED
FREE
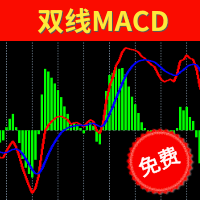
Two Lines MACD Many people who conduct technical transactions on MT4 like to use MACD to judge the turning or continuation of the market. When everyone uses the MACD indicator that comes with MT4, they find that the indicator is a single-line MACD, and the histogram seems to be similar to the past. The MACD that I understand does not match. In order to provide traders with a perfect trading experience, we especially provides free two-line MACD indicators for all traders! The single line in the
FREE

FALCON ZONES , OPORTUNIDADES EN EL MERCADO PARA COMPORAR O VENDER
Características Destacadas: Identificación de Patrones de Velas: Reconoce una amplia gama de patrones de velas, desde patrones simples hasta formaciones más complejas. Proporciona una visión completa de la psicología del mercado encapsulada en las velas. Alertas Personalizadas: Configura alertas a medida para los patrones de velas que más te interesan o que se alinean con tu estrategia. Recibe notificaciones instantáneas cuando s
FREE

FadeStormPro EA – Low-Risk Reversal Trading for Consistent Profits FadeStormPro EA is an advanced, fully automated trading system designed to capitalize on sharp, volatile price moves by executing high-probability reversal (fade) trades. Proven to deliver consistent results on EURUSD, USDCAD, and other major currency pairs, FadeStormPro combines multiple institutional-grade detection methods, robust risk management, and professional trade management features to generate profits in various market
FREE

This application is now replaced by Ofir Notify Light Edition (Free) or Ofir Notify (paid).
Thank all for your positive feedbacks.
Ofir Notify is a tool which send alerts on trades to Telegram Alert on any event concerning a position : Opening, Closing, modification (SL, TP) Send alerts to Chats, Groups and Channel Alert on Equity change Display Risk, Reward and progress of profit/lost for each position Customization of alerts ( only in full edition ) Sending charts screenshots with alerts
FREE

Never miss a trend change again! This indicator uses various calculation methods based on price action to detect changes in the direction of the trend. It can be used on high timeframes (from H1 to D1) and is most suitable for H4 and Daily timeframe. This indicator is compatible with all broker symbols (forex, indices, CFD, commodities, crypto…). It is also possible to open the indicator on several charts to follow several symbols at the same time. In addition, you don't have to stand by your P
FREE
SignalAlert 지표는 다른 지표에서 구매 및 판매 신호를 추적하고 신호가 발생하면 사운드 알림을 보내는 도구입니다. SignalAlert는 Binary Sixty Scalping과 같은 지표와 함께 사용할 때 빠르게 신호에 반응하는 데 유용합니다. 지표 설정: IndicatorName – SignalAlert가 신호를 읽을 지표의 이름을 지정합니다. 예를 들어, „Binary Sixty Scalping“을 정확히 입력하면 SignalAlert가 이 지표의 신호를 추적합니다. BuyBuffer – 구매 신호의 버퍼 번호를 지정합니다. 예를 들어, „Binary Sixty Scalping“의 구매 신호가 첫 번째 버퍼에 있으면 BuyBuffer = 0을 설정합니다. 다른 버퍼에 있으면 해당 번호를 지정합니다. SellBuffer – 판매 신호의 버퍼 번호를 지정합니다. 예를 들어, „Binary Sixty Scalping“의 판매 신호가 두 번째 버퍼에 있으면 SellBuffer
FREE

Smart Scalper's Edge: The Triple-Filter Signal Tired of chasing false signals? The "Smart Scalper's Edge" is your unfair advantage in the market, designed for traders who demand precision and confirmation. This indicator doesn't just rely on a simple crossover; it uses a powerful triple-confirmation system to filter out the noise and pinpoint high-probability trading opportunities. Get the clarity you need to enter the market with confidence! Key Advantages: Trade Smarter, Not Harder Filter Out
FREE

Medium-term trading system that tries to profit during the price rollbacks after significant movements. The system automatically determines the current trading range, the price rollback levels. This is a demonstration version of the Algorithmic EA, which is optimized over the year 2016 for trading the EURUSD currency pair. It is possible to trade in manual mode using a simple on-screen panel or in fully automatic mode. Amount of trades per month is from 5 to 18 in automatic mode. The recommended
FREE

Currency Strength Matrix (CSM) is an indicator that will show you the current strength of the major currencies in several timeframes, allowing you to sort the currencies for strength and spot possible trading setups. This indicator is ideal for scalping and in all those events of sudden big moves.
How does it work? The CSM compares the value of the current moving average with the same moving average in the previous candle for all the 28 pairs and all 9 timeframes, producing a Matrix of Strength
FREE
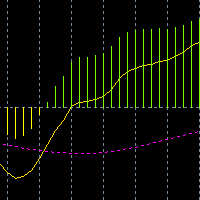
This is a user-defined algorithm based on MACD, which adds a signal line to make this indicator look like the MACD style popular in mainland China. At the same time, a pop-up box is added to indicate the buying or selling signal when two signal lines cross.
The yellow signal line shall wear the pink signal line, the pink signal line below, and the yellow signal line above, indicating long.
Under the yellow signal line, wear the pink signal line, under the yellow signal line, and above the p
FREE

SwingTradeMaster – a fully automated Expert Advisor based on classic Price Action and adaptive risk management.
The EA combines candlestick patterns (Pin Bar, Engulfing, Morning/Evening Star, Hammer) with RSI trend filters and ATR-based dynamic stop levels.
Transparent logic
Breakeven protection
Works on any pair and timeframe
Recommended for traders who want a professional, reliable and easy-to-use trading system. SwingTradeMaster is a fully automated Expert Advisor designed for swing and
FREE

Dominate the Market with Reversal Dominator! Tired of chasing trends only to get caught in a sudden reversal? Reversal Dominator is your ultimate weapon for spotting high-probability market turns before they become obvious. This powerful indicator leverages a sophisticated Absolute Strength calculation, paired with an intelligent moving average filter, to give you the precise edge needed to enter or exit trades with confidence. Why Choose Reversal Dominator? Pinpoint Reversals: Never miss a cr
FREE
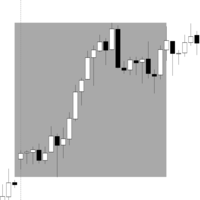
Range Box Indicator for Trading Sessions This indicator allows traders to visualize and analyze specific time ranges directly on their chart by drawing rectangular boxes for each trading session. Key Features: Customizable session interval: set your own session start and end times. Number of days displayed: choose how many past sessions are visible. Default color and special color for Monday: easily highlight weekly patterns. Adjustable border width: customize the appearance of the rectangles to
FREE

This Expert Advisor implements an RSI Mean Reversion strategy with a moving average filter for trade entries. The EA uses higher timeframe RSI conditions to detect potential buy or sell opportunities, confirmed by a lower timeframe moving average. The strategy includes risk management features like limiting the maximum number of open trades, controlling risk based on ADR, and closing trades when a predefined account profit percentage is reached. It also includes visualization tools such as a bre
FREE

Fisher Yur4ik Indicator is a momentum indicator originated by Yuri Prokiev (Russian). I combined the Fisher Test indicator with other indicators to sieve/filter signals. It is not used as a standalone indicator but in combination to filter out Price Action signals. I have uploaded this indicator (Fisher test) for download alongside the 3Bar_Play signal indicator for signals to appear. It is free.
FREE
Check out other great products from https://www.mql5.com/en/users/augustinekamatu/seller
This indicator is the best so far at estimating reversal points especially on high time frames. It does not repaint and is based on a combination of moving averages computed using custom functions. No inputs required, it is simple plug and play. The principles used ensure that it can be used on CFDs, Commodities and Stock with incredibly great results. With proper money management and portfolio balancing
FREE

Solarwind No Repaint는 정규화된 가격 데이터에 피셔 변환을 적용하는 기술적 오실레이터로, 잠재적인 시장 전환점을 식별하는 히스토그램 기반 지표를 생성합니다. 이 지표는 가격 움직임을 가우시안 정규 분포로 변환하여 주기적 패턴과 모멘텀 변화를 트레이더에게 더 명확하게 보여줍니다. 작동 원리 이 지표는 여러 계산 단계를 통해 가격 데이터를 처리합니다: 고가-저가 분석 : 지정된 기간 동안의 최고가와 최저가를 계산 가격 정규화 : 각 봉의 고가-저가 범위의 중점을 구하고 기간 범위에 대해 정규화하여 -1과 +1 사이의 값으로 스케일링 피셔 변환 적용 : 수학적 피셔 변환 공식 0.5 * ln((1+x)/(1-x)) 를 스무딩과 함께 적용 추세 신호 처리 : 값 변화와 모멘텀 임계값을 기반으로 방향성 신호 생성 주요 특징 히스토그램 표시 : 별도의 지표 창에서 컬러 바로 렌더링 추세 기반 색상 : 강세 모멘텀은 녹색 바, 약세 모멘텀은 빨간색 바 노 리페인트 설계 : 현재
FREE

The Mono Waves indicator is designed to display the wave behavior of the market on a chart. Its appearance is presented on slide 1. This indicator uses the PPPC (Point-Percent Price Channel) indicator, which can be downloaded for free from the Market . When the market moves up, the upper border of the price channel is built on High candlestick prices (for more details, see the description of the PPPC indicator at the link given above). The higher the High prices rise, t
FREE
Loop Pattern EA is an automatic long term strategy trader. Minimum trading account 10,000. Best performance on GBPUSD 1h. This EA calculates amount of candles back controllable by the user and applies certain function:
if (calculate_Green_Body()>calculate_Red_Body() && calculate_Green_High()<calculate_Red_Low() && newcandle()) { buy(); } ... There are no stoploss or takeprofit and the trades closes then the opposite signal arrives. this EA operates only once per bar
FREE
Description
The base of this indicator is an ZigZag algorithm based on ATR and Fibo retracement. This indicator is not redrawing in sense that the ZigZag's last shoulder is formed right after the appropriate conditions occur on the market. The shoulder doesn't change its direction afterwards (can only continue). Note: An indicator with advanced possibilities is also available.
Indicator input parameters
The input parameters allow to change the sensitivity of the ZigZag. ATR period ATR multip
FREE

Concept
Gold Evolution is a system that identify the safest entry and exit points.
This system is focused on a long-term stable growth .
It is a professional strategy developed years ago for manual trading of Gold, and now, perfectly adapted to automated trading .
It does not need to be constantly updated as it adapts naturally to varied market conditions.
No martingale, no grid, no hedge, no other dangerous strategy. Only strict rule-based approach to trading, allowing to maximise return w
FREE

RRS Impulse Plus EA is an advanced version of RRS Impulse EA . This upgraded version provides more flexibility with several new options. The EA scalps using the Relative Strength Index (RSI), Stochastic Oscillator, Moving Average (MA), and Bollinger Bands indicators to identify trend and counter-trend opportunities. As a multi-pair EA , it scans multiple currency pairs for signals. This EA includes various features such as Trailing, Risk Management, Money Management, Restriction Mode, and more.
FREE

It uses three moving averages to analyze the market and generate buy and sell signals. The first and second moving averages are of the simple type with respective periods of 20 and 50. They are used to determine entry and exit points.
The third moving average is of the simple type with a period of 200. It is used to indicate the trend direction based on its position relative to the price. The robot only takes signals that are consistent with the trend, allowing it to reduce the number of false
FREE
What is Squeeze Momentum? Squeeze Momentum is an innovative technical analysis indicator popularized by John Carter in "Mastering the Trade" that detects compression periods in markets. This indicator analyzes volatility changes using a combination of Bollinger Bands and Keltner Channel. What Does It Do? Squeeze Detection : Identifies periods when Bollinger Bands move inside the Keltner Channel Momentum Measurement : Shows momentum changes through linear regression calculations Color-Coded Signa
FREE

The Monday EA trades on Mondays depending on price movement on Fridays. Its aim is to take 10-20 points of profit and leave the market. This strategy works from March 2014. Currency pairs are EUR/USD and GBP/USD. For GBP / USD trading on the CCI indicator is recommended not to use Time frame is daily D1 Settings: Sig_Open1 = true; - if true, the EA trades on Mondays StartTime = "00:00"; time to start trading (applies only to "Sig_Open1")
Sig_Open2 = true; - enable only on EUR/USD (works only on
FREE

Follow the trail of the comet to know the development of the trend. This indicator helps you to determine the evolution of the price depending on how these astronomical objects are shown in the chart. When the comet seems to stop, it opens its tails considerably and warns us of a possible change in trend. On the contrary, when it seems to get speed (looks thin because lines of tail are grouped) demonstrates safety and continuity in trend. The head or comet nucleus will show red or green accordin
FREE

A signal indicator consisting of several well-known indicators that process data sequentially. 2 options - for schedule and basement. In the settings it is possible to enable alerts about the change of trend (alerts) sound, by e-mail and push. It is possible to change the colors and thickness of the lines, the colors and codes of the arrows, the number of calculation bars and separately configure the parameters included in the indicators.
FREE

Volatility Limit Trend Indicator (VLT), an original indicator by this developer, is a trend indicator based on setting a fixed volatility limit as a percentage of price. Volatile price is allowed to wander between two channel lines defining the fixed volatility about a central line. The price crossing one of the channel lines defines an exceeding of the allowed volatility, and ushering in one of two situation : either a continuation or a reversal of trend. The first buffer of the indicator (not
FREE

Economic Calendar Viewer
This economic events reader is adapted to load data from a csv file. You can prepare the csv file yourself according to this template, you can do it in notepad or csved. The file should normally be named Calendar-MM-DD-YYYY.csv. And contain lines with data column headers according to this example. In the Impact column, i.e. impact on the market depending on the importance of the event, the names accepted from the least important are: None, Low, Medium, High. In columns
FREE

Having more expert advisors running on the same account , eventually leads us to the question , which one of them are winners , or which are dragging down the account ? With this in mind I created this simple utility for displaying profits or losses taken by each expert advisor over time . This utility can be run as an expert advisor and can display up to 10 magic number results . If the inputs are left to zero , the results displayed are from the manually placed orders . It also displays depos
FREE

Latest Changes in 1.6 : Added Signal Modes input. Mode 1 : HPF positive go long blue, HPF negative go short red. Mode 2 : slow envelope only, HPF above upper envelope go long blue, HPF below lower envelope go short red. Mode 3 : HPF above both upper envelopes - go long blue, HPF below both lower envelopes go short red. Mode 4 : Go long blue if HPF crosses above upper slow, but fast upper should be below slow upper at the time, exit when HPF crosses below upper fast, reverse logic for short red
FREE

The purpose of this new version of the MT4 standard indicator provided in your platform is to display in a sub-window multiple timeframes of the same indicator. See the example shown in the picture below. But the display isn’t like a simple MTF indicator. This is the real display of the indicator on its timeframe. Here's the options available in the FFx indicator: Select the timeframes to be displayed (M1 to Monthly) Define the width (number of bars) for each timeframe box Alert pop up/sound/ema
FREE

The indicator displays zero level Accelerator Oscillator (AC) crossover in the form of dots on the chart. In indicator settings one can specify number of bars in the history to display signals, as well as shift of dots with respect to a bar. Parameters Bars — number of bars in the history to display indicator's signals; Shift — shift of dots with respect to bars.
FREE

This is a simple and free Expert Advisor that trades candlesticks. It compares several nearest bars and their volumes, and opens a trade based on that data. Unlike the professional version , it analyzes only 1 timeframe. The recommended timeframes for this EA are H1, H4, D1, it works with any currency pairs. The parameters always need to be optimized before trading, as well as after some period of trading.
Input Parameters Lots - lot size (if Lots=0, then the lot will be calculated based on the
FREE
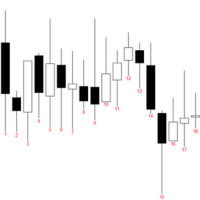
indicator that numbers the bars (candles) in a custom trading session.
The indicator allows: Defining the session start time (StartHour and StartMinute) Displaying numbers only on odd bars (if AfficherUniquementImpairs is true) Displaying numbers on the last N days (NbJours) Customizing the color and font size of the text The indicator will loop through the bars of the last N days and, for each day, start counting from the session start time.
It will display the bar number (starting at 1) belo
FREE

Smart Trend Line Alert Demo is a unique professional Trend Line, Support Line and Resistance Line Touch and Break out Alert with awesome Alert History feature, designed to help traders easily manage many charts and symbols without staring at the monitor. Note: This a Demo version operating only on USDCHF . Full version link: https://www.mql5.com/en/market/product/3085
Features Candle Break Out Alert, Price Touch Alert and Time Line Alert; 1 click for converting any drawn line into an alert line
FREE

This indicator is based on Zigzag. It shows the HH, HL, LL, LH counts. This helps in finding ongoing trends. Or ranges:
Features: Show symbols for: Higher-Highs, Higher-Lows Lower-Lows, Lower-Highs And show counter for each Non-repainting option Customize Color and horizontal/vertical labels Corresponding scanner dashboard: https://www.mql5.com/en/market/product/85346
Symbols Described: HH = Higher-Highs (Current price high is more than previous high) HL = Higher-Lows (Current price low is mo
FREE
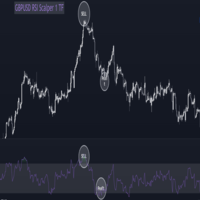
What is RSI:-
RSI stands for Relative Strength Index, which is a popular technical indicator used in financial markets, particularly in the analysis of stocks, commodities, and other securities. RSI is used by traders and investors to assess the strength and potential direction of price movements in an asset. Here's how RSI works: Calculation : RSI is calculated using a formula that takes into account the average gain and average loss over a specified period (typically 14 periods). The formula
FREE

ENGLISH DESCRIPTION (MQL5 Standard Optimized) Product Name: Emerald Jungle BandMaster (MT4) [Subtitle: Multi-Strategy Bollinger | TP/SL Sealing Protocol | Prop Firm Safe] Introduction The financial market is a jungle. To survive, you need adaptability and strict discipline. Emerald Jungle BandMaster (EJBM) is a specialized M15 Expert Advisor that brings order to chaos. It dynamically switches between three core strategies: Trend Pullback , Squeeze Breakout , and Mean-Reversion . Its unique sell
FREE
Supply Demand Ribbon is an indicator with moving supply and demand lines that help you identify price zones more easily. The indicator helps you determine flexible entry, stop loss, and take profit areas. There are also strategies for algorithmically changing ribbon colors. From there you can come up with many trading strategies for yourself! MT5 Version: Click here!
You can explore many feature in Advanced version here ! You can combine it with our indicators below to make your tradin
FREE

Expert Advisor designed for news trading. The news are downloaded from the Forex Factory, Investing.com, myfxbook.com websites. Make sure to add the URL to the terminal settings. The EA should be attached to each currency chart. In the Symbol News field, set the currency symbol for searching news in the calendar. Example: if the EA is attached to the AUDUSD chart, set Symbol News to AUD; if USDCAD, Symbol News - CAD, XAUUSD Symbol News - USD, and so on. Change the magic number for each chart, an

Multi Timeframe Indicator includes a lot of functions and can be considered as a universal helper for a trader. It's main objective is to display up to 10 indicators at a time using just one small brick per each of them. These indicators involve Awesome Oscillator, CCI, DeMarker, MACD, RSI, RVI, Stochastic, Larry Williams' Percent Range, Bulls Power and Bears Power. An important function of the indicator is an ability to monitor signals from different timeframes. You can choose different combina
FREE

Koala Trading Solution 채널 에 가입하여 MQL5 커뮤니티에서 최신 신호 및 Koala 제품에 대한 소식을 확인하세요. 가입 링크는 아래에 있습니다: https://www.mql5.com/en/channels/koalatradingsolution 설명 :
우리는 외환 시장(PSAR)에서 전문적이고 인기 있는 지표 중 하나를 기반으로 하는 새로운 무료 지표를 도입하게 된 것을 기쁘게 생각합니다. 이 지표는 원래 포물선 SAR 지표에 대한 새로운 수정이며, 프로 SAR 지표에서 점과 가격 차트 사이의 교차를 볼 수 있습니다. 교차는 신호가 아니지만 이동 가능성의 끝을 말하는 것입니다. 새로운 파란색 점으로 매수를 시작하고 첫 번째 파란색 점 앞에 손절매를 1 attr 배치하고 마지막으로 점이 가격 차트를 교차하는 즉시 종료할 수 있습니다.
매수 또는 매도 신호를 여는 방법은 무엇입니까? 첫 번째 파란색 점으로 공개 매수 거래 및 첫 번째 빨간색 점으로 공개 매
FREE

1. Make sure you trade only with GBP/USD on an 1h chart as this model is built specifically for the hourly Cable trading. 2. If you are backtesting the EA during weekends, make sure to specify a reasonable spread (such as 30 or 50) instead of using current spread because the market is not trading and the current spread may be some awkward number. During weekdays, feel free to use current spread as it is the correct current spread value. 3. If you want to have an even more stable-performing EA,
FREE
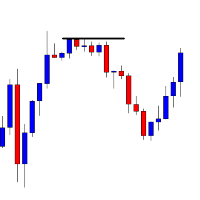
A very simple Ea that put Buy or Sell at Break-out of Maximun of the day before. Here the external variable: 1 Lots (Lot for Buy and Sell() 2 Stop (Stop for Buy and Sell with value * Point) 3 Take (Take for Buy and Sell with value * Point) 4 UpMax (A value that increase the open position on Buy) 4 DownMin(A value that decrease the open position on Sell) This Ea work on all Forex Graphics
For all dubts or problem contact me at crashmens@gmail.com
FREE

VolumeFX works placing pending orders up and down of the current price, taking benefits from the oscillations, so when the price its out of operation range a new batch of orders will be placed, allowing the program to work continously every time a new price range its shaped
All the parameters of the program may be modified, so you can adjust them to the pair you most like to operate, though the default parameters works well in the EURUSD pair with accounts of 500 usd or more. Here is how you ca
FREE

The logic of this robot is simple, but very powerful. It monitors the current trend using long-term candlesticks, using multiple candlesticks to increase reliability. The EA first monitors the current trend and then places orders in line with the trend. The timing of the orders is based on an internal RCI indicator. The entry value for RCI can be freely adjusted. A value closer to 1 will increase accuracy, but decrease the frequency of entries. It trades with a TP of 50 and an SL of 50, but if
FREE

This indicator applies the biquad high pass filter to the price-chart data, and displays the filter output for the OHLC as candlesticks. The candlesticks corresponds to the actual calculations of the filter value during the formation of each price bar (not from all historical highs lows or closes). The shape of the bars therefore corresponds directly to the shape of each price bar. High pass filters are an underappreciated type of oscillator that are seldom used in technical analysis in the st
FREE

이 무료 도구가 마음에 드셨다면 별점 5점을 남겨주세요! 정말 감사합니다 :) "위험 관리 어시스턴트" 전문가 자문 컬렉션은 다양한 시장 상황에서 효과적으로 위험을 관리하여 거래 전략을 강화하도록 설계된 포괄적인 도구 모음입니다. 이 컬렉션은 평균화, 전환, 헤지 전문가 자문의 세 가지 핵심 요소로 구성되어 있으며, 각 요소는 다양한 거래 상황에 맞춰 고유한 장점을 제공합니다.
이 EA는 시중에 나와 있는 표준 위험 관리 전략을 기반으로 개발되었습니다.
https://www.mql5.com/en/blogs/post/756961
1. "평균화 어시스턴트" EA: MT4: https://www.mql5.com/en/market/product/115468 MT5: https://www.mql5.com/en/market/product/115469 2. "스위칭 어시스턴트" EA: MT4: https://www.mql5.com/en/market/product/115478 MT5: ht
FREE
The purpose of this new version of the MT4 standard indicator provided in your platform is to display in a sub-window multiple timeframes of the same indicator. See the example shown in the picture below. But the display isn’t like a simple MTF indicator. This is the real display of the indicator on its timeframe. Here's the options available in the FFx indicator: Select the timeframes to be displayed (M1 to Monthly) Define the width (number of bars) for each timeframe box Alert pop up/sound/ema
FREE

Interactive Gann Drawer of Square 9 (Temporary free download for the 1st 20 users) This Expert Advisor (EA) turns Gann’s Square of 9 method into a dynamic and interactive trading tool . It automatically calculates and draws key amazing accurate support and resistance levels on your chart all based on a point in history that you choose by just clicking on the chart. If you just want to see it drawing and analyzing and open you trades yourself use this version. But if you want the same tool that
FREE

4H Open Line Indicator - Settings Overview This custom indicator is used to draw and visualize the opening price , midline , and high/low ranges of 4-hour candles on smaller timeframes. It's particularly useful for intraday traders who want to see higher-timeframe levels. Indicator Inputs and Descriptions Parameter Value Description OpenLineColor White Color of the line indicating the open price of the 4H candle. OpenLineWidth 1 Width of the open price line. OpenLineStyle Solid Line style
FREE

Arrow Indicator (Buy/Sell Alerts) – Simple Yet Powerful Tool! Product Version: 1.01 Indicator Type: Trend Reversal Signals Timeframes Supported: All (Recommended: H1, H4, D1) Key Features: Buy Signal: Green upward arrow () appears below the candle Sell Signal : Red downward arrow () appears above the candle Accurate Trend Reversal Detection – Based on tried and tested SMA strategy. ️ Clean Chart View – Minimalist, non-i
FREE

RJT SALAMANDER, the indicator as in a video game
VERSION 2
Pilot your PRICE spaceship inside the cavern and avoid the collision against the stalactites (green) and stalagmites (red), dodging these obstacles to win.
When these objects are forming (or disappearing) then you must make the decision how to move your ship (just like in a video game)
Depending on the market and the size of the candles/bars you can adjust the calculation of stalactites and stalagmites (based on the last bars) in the
FREE

Reverse copier is a tool that will open opposite buy/sell orders from your master account. It will help you with low profit EA's that lose consistenly and turn it to wins.
Feel free to ask for new functions/features and I will add it. Now it's a simple MT5 to MT4 bridge with straightforward logic of one position open/close.
How to install: https://www.mql5.com/en/market/product/141604
FREE

SPREADEX e' un indicatore per MT4 e MT5 che indica la distanza dell'ASSET dal GP. il GP e' il prezzo del vero valore dell'ASSET sottostante ottenuto per stima. Il GP e' come una calamita, attira il prezzo dell'ASSET con alta probabilita' ed all'interno della stessa giornata di trading. Quindi SPREADEX indica quali sono gli asset piu distanti dal GP al momento in tempo reale. Fornendo un punto di vista al TRADER su quali asset concentrarsi e cercare eventuali segnali di inversione dei prezzi per
FREE
The Variations Moving Average indicator has eight types of non-standard moving averages.
Double MA - DMA Triple MA - TMA Hull MA - HMA Jurik MA - JMA Adaptive MA - AMA Fractal Adaptive MA - FAMA Volume Weighted MA - VWMA Variable Index Dynamic MA - VIDMA
Works as a trend indicator. Indicator settings Type MA Shift MA Show Trend Period MA Method MA Applied Price MA Color MA
FREE

Get This: The Ultimate Power Tool for Traders—Draw My Levels! Believe me, folks, this is BIG. This isn’t just some regular, everyday tool—this is *the* essential tool for your trading arsenal. “Draw My Levels” is a simple, elegant, and powerful script that’ll take your trading game to a whole new level. You want precision? You want control? You want to see where the real action is happening on the chart? Then this script is for you. Why Do You Need This Script? Let me tell you, if you’re a trade
FREE

The purpose of this new version of the MT4 standard indicator provided in your platform is to display in a sub-window multiple timeframes of the same indicator. See the example shown in the picture below. But the display isn’t like a simple MTF indicator. This is the real display of the indicator on its timeframe. Here's the options available in the FFx indicator: Select the timeframes to be displayed (M1 to Monthly) Define the width (number of bars) for each timeframe box Alert pop up/sound/ema
FREE
This EA using Trend Analyzer to trade follow the trend, not againts it No Martingale, No Grid, No Averaging All orders use fix SL and TP, with RRR 1:2
Recommendation Pairs :EURUSD
TimeFrame : H1
Balance : Recommended $500 with 0.01 lot
Risk Warning: Before you use this EA please be aware of the risks involved. Past performance is no guarantee of future profitability (EA could also make losses). Always run it on demo account at first
After Download please contact me for more instructi
FREE
This EA is dedicated to exit-only operations.
You can choose between two types of exit conditions: one based on two MA evaluations, and another based on ZigZag trend reversal detection. One option confirms the MA condition with a candle close at the crossover, using a selectable execution timeframe. The MA timeframe and the candlestick timeframe used for evaluation can be set separately. Two types of trend reversal detection are available: one based on Dow Theory and the other based on the most
FREE
AZ Trade Recovery EA MT4 is a professional hedging-based recovery Expert Advisor designed to transform losing positions into profitable outcomes — even during strong market reversals. It uses an advanced Zone Recovery Hedging Mechanism (ZRH) , a proven mathematical trading model that allows your trade cycle to end with a net profit regardless of whether price moves up or down.
Instead of relying on traditional stop losses, this EA uses a controlled sequence of hedged recovery trades, placed at
MetaTrader 마켓은 개발자들이 거래 애플리케이션을 판매할 수 있는 간단하고 편리한 사이트이다.
제품을 게시하고 마켓용 제품 설명을 어떻게 준비하는가를 설명하는 데 도움이 됩니다. 마켓의 모든 애플리케이션은 암호화로 보호되며 구매자의 컴퓨터에서만 실행할 수 있습니다. 불법 복제는 불가능합니다.
트레이딩 기회를 놓치고 있어요:
- 무료 트레이딩 앱
- 복사용 8,000 이상의 시그널
- 금융 시장 개척을 위한 경제 뉴스
등록
로그인
계정이 없으시면, 가입하십시오
MQL5.com 웹사이트에 로그인을 하기 위해 쿠키를 허용하십시오.
브라우저에서 필요한 설정을 활성화하시지 않으면, 로그인할 수 없습니다.