 MetaTrader 5
 Experts
 지표
지표 라이브러리
라이브러리 유틸리티
유틸리티 위젯
위젯 규칙
규칙MetaTrader 4용 Expert Advisor 및 지표 - 339
 트레이딩 로봇은 자동으로 시장거래를 수행하는 반면 지표는 가격을 더 잘 분석하고 가격 행동을 예측할 수 있게 해줍니다.
이러한 어플리케이션을 사용하면 MetaTrader 4에서 더 많은 기회를 포착하는 동시에 보다 정보에 입각한 방식으로 거래를 수행할 수 있습니다.
트레이딩 로봇은 자동으로 시장거래를 수행하는 반면 지표는 가격을 더 잘 분석하고 가격 행동을 예측할 수 있게 해줍니다.
이러한 어플리케이션을 사용하면 MetaTrader 4에서 더 많은 기회를 포착하는 동시에 보다 정보에 입각한 방식으로 거래를 수행할 수 있습니다. 
Fractals Notifier MT4 is a modification of Bill Williams' Fractals indicator. The fractal consists of two sets of arrows - up (upper fractals) and down (lower fractals). Each fractal satisfies the following conditions: Upper fractal - maximum (high) of a signal bar exceeds or is equal to maximums of all bars from the range to the left and to the right; Lower fractal - minimum (low) of a signal bar is less or equal to minimums of all bars from the range to the left and to the right. Unlike a stan

Speed ticks 표시기는 진드기의 속도를 측정합니다. 1초의 틱 수입니다. 설정에서 지정된 틱 수를 출현 시간으로 나눈 값으로 계산됩니다. 진드기 모양의 소리 반주는 스피커 아이콘, 녹색 - 켜기, 빨간색 - 끄기가있는 버튼으로 끌 수 있습니다.
표시기 설정 설명 number_ticks - 계산을 시작할 틱 수, 지정된 전체 틱 수가 나타난 후에만 계산이 시작됩니다. _corner - 텍스트 및 버튼의 앵커 모서리, 기본적으로 오른쪽 하단 모서리 clr_back - 배경색 clr_border - 테두리 색상 clr_text - 텍스트 색상 width_border - 테두리 두께 file_sound1 - 첫 번째 사운드 파일 file_sound2 - 두 번째 사운드 파일 표시기는 진드기의 속도를 측정합니다. 1초의 틱 수입니다. 설정에서 지정된 틱 수를 출현 시간으로 나눈 값으로 계산됩니다. 진드기 모양의 소리 반주는 스피커 아이콘, 녹색 - 켜기, 빨간색 - 끄기가있는 버

Phaser Evo is a fully automated trading system. It is designed to take advantage from big and fast movements of the market and it can potentially be used in any kind of financial instrument. It is released with a portfolio of 8 different pairs already optimized, anyway there are no limitations in the development of new configurations. The stop loss is always set but only for safety reason, the robot usually closes the losing positions before stops are reached. When a profit trade is taken, it ca

3xEMA Golden Cross Alert is indicator signal strategy trading by 3 Exponential Moving Average (EMA). It'll alert signal on next bar open with an audio or pop up on the chart when EMA signal cross above/below 3 periods EMA for Buy/Sell and Exit alert signal. BUY/SELL: When Short term's EMA > Medium term's EMA > Long term's EMA = Buy Signal When Short term's EMA < Medium term's EMA < Long term's EMA = Buy Signal Exit: When Short term's EMA < Medium term's EMA > Long term's EMA = Exit Signal for Bu
The Pivot Levels Expert Advisor is based on the Pivot levels indicator. The EA trades a very simple strategy - daily reversal.
Averaging and martingale are used in the process of trading, it trades instant and pending orders, does not use stop loss or take profit. Orders are opened and closed only at a signal.
System settings martingale mode – martingale type. martingale geometric progression – geometric progression step. martingale arithmetic progression – arithmetic progression step. lotsize
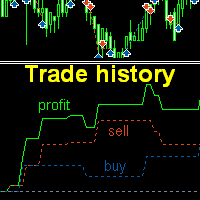
The indicator plots charts of profit taken at the Close of candles for closed (or partially closed) long and short orders individually. The indicator allows to filter orders by the current symbol, specified expert ID (magic number) a nd the presence (absence) of a substring in a order comment , to set the start time and the periodicity of profit reset (daily, weekly or monthly) to calculate the profit chart. The indicator also displays the floating (not fixed) profit of the opened orders at the
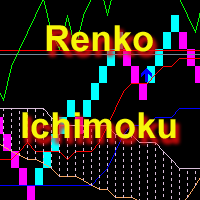
The indicator displays Renko bars, uses their data to calculate and display the Ichimoku Kinko Hyo indicator and provides buy/sell signals. Renko is a non-trivial price display method. Instead of displaying each bar within a time interval, only the bars where the price moved a certain number of points are shown. Renko bars do not depend on a time interval, therefore the indicator works on any timeframe without losing its efficiency. Indicator generates two signals: When the Tenkan-Sen line is ab

Copy Trade Copier Expert Advisor copies orders to several trading accounts (regardless of a broker) if their respective MetaTrader 4 terminals are opened on a single PC/VPS. This resource-saving trade copier features rich functionality, as well as easy and flexible settings. The EA may copy from multiple (unlimited) initial accounts to a single target one or from a single initial account to multiple (unlimited) target ones. The work of other EAs and manual trading on initial and target accounts
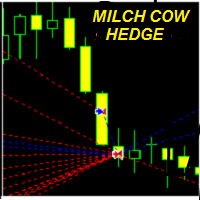
MILCH COW HEDGE V1.12 EA is primarily a Hedging Strategy. Expert support is to seize every opportunity in any direction. Not just opens the deals, but chooses the right time to close the open positions to begin trading again.
We recommend the use of an expert with a pair of high volatility for the currency, such as GBPAUD, AUDCAD Testing expert during the period from 01.01.2016 until 09.12.2016 profit doubled four times to account Experts interface allows the user to directly trading open order

Multi-timeframe Parabolic SAR dashboard allows you to add and monitor PSAR trends. The multi-timeframe Parabolic SAR dashboard will save you a lot of time and gives you a single view of the markets using PSAR. In short, you can just view one window and get a snapshot of up to 21 instruments on your MT4 platform. The indicator opens in a sub-window. Below are the features of the PSAR Dashboard Indicator Modify PSAR Settings: The PSAR Dashboard comes with default PSAR settings of 0.02 (Step) and 0

Pivot Points is used by traders to objectively determine potential support and resistance levels. Pivots can be extremely useful in Forex since many currency pairs usually fluctuate between these levels. Most of the time, price ranges between R1 and S1. Pivot points can be used by range, breakout, and trend traders. Range-bound Forex traders will enter a buy order near identified levels of support and a sell order when the pair nears resistance. But there is more one method to determine Pivot po

This expert trades on price action. It does not use signals from indicators but creates a statistics-based custom channel for entry and exit of trades. Due to independence of indicators, the expert can be optimized for several currency pairs and trading times. Each trade position is protected by stop-loss, both hidden and visible. No martingale, hedging or grid. The expert uses 3 different strategies within the same channel for entry and exit. Each opens only 1 trade at a time. Please find a sig

You may see how Martingale EAs crudely re-open doubled size new trades in fixed steps and continue this rudimentary decisions until to reach account call margin; this is a big problem. The resolution to this problem is a Smart EA that calculates accurate entry points for every single order, a Safe EA that observes market volatility to exit from high risk situations and conditions, and finally a Steady EA to satisfy traders and investors for a long period.
This is why this EA is called Smart Sa

Yogi EA is scalping Expert Advisor for EURCHF and GBPCHF. The EA performs a complex analysis, which reveals a quiet phase of the market to trade. The Expert Advisor does not use hedging, martingale, grid strategies, arbitrage, etc. Most of the settings are already integrated into the EA code. All you need to do is to select the currency pair, adjust the WET (Western European Time) time zone in the EA parameters and to start trading. Working timeframe - M15. Real account monitoring is available i

Martex is a moderately aggressive EA working on a martingale strategy with hedge. The EA independently monitors the risk and, if the risk is high, takes measures to exit the market with a minimum profit. In the hedging mode, the EA independently leaves the "lock" with a profit. A complete guide to the Martex EA can be found in the "Comments" section. Benefits automatic magic number, individual for each currency pair; automatic breakeven and automatic trailing stop; at high risk, reducing the mar

Dolphin EA is a grid Expert Advisor. It opens a grid of orders located at a specified level from each other. An order direction is defined by the built-in filters. No stop loss is used. All orders are closed by take profit. The EA works on any timeframe.
Parameters Filtr - number of points from the average for opening orders (for example, 200). 0 - disabled. AutoTakeProfit - enable take profit auto detection. Take profit should not be less than the TakeProfit parameter. TakeProfit - take profit

NIP Trading is a fully automated Expert Advisor. It works by using several different strategies at the same. Most of the strategies are trend following except for some trend reversal entry points which use Stop Orders when identified. Different strategies use different take profit and stop loss levels as well as trailing stop values, making the expert advisor very flexible to different market conditions. No martingale. No arbitrage.
Settings All trades have stop loss. Some trades have fixed tak

Your Personal Assistant is an Expert Advisor for semi-automatic Forex trading. It is designed for trades who trade manually or prefer semi-automatic trading. Suitable for trading currencies, metals and CFD. The EA helps the trader in managing the open positions, as well as open deals using virtual pending orders based on graphical horizontal and/or trend lines. Thus, positions can be opened by the following method, including their joint use: Market orders (positions are opened by the trader) Pen
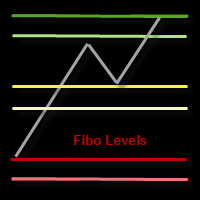
This indicator draws the Fibonacci -38.2, -17, 38.2, 61.8, 117, 138 levels for the last closed H1, H4, Daily, Weekly and Monthly candle.
Features Automatic display of the most important Fibonacci levels.
Parameters TimeFrame: Choose which timeframe you want Fibonacci levels to be based on.
SetLabels: Visible/invisible Fibonacci level labels.
Labels Position : Position of Fibonacci level labels (Right - Left - Middle).
FontSize: Font size of Fibonacci level labels. c38: Color of level 38.2%.
Work order The EA works on any timeframe and any currency pair. During operation, the EA analyzes a wide range of variables and indicators. Once necessary conditions occur, the EA opens a pending order. The EA doesn't open another order until you the previous one is closed. The EA contains the TrailingStop block, enabling you to move STOPLOSS following the price movement. The EX performs most effectively on EURUSD, GBPUSD, USDCHF, but also can be used on any other currency pair. For best result,

The Fx-PIOT indicator determines the movement direction of a financial instrument using a combined signal: the main signal + 2 filters. The screenshots were taken in real-time mode (/ Date=2017.01.24 / Symbol=NZDJPY / TF=H1 /). The main signal is displayed as arrows (Up / Down) + possible reversal zones. Calculation is made using the Open, Close, High and Low prices. Filter #1 is a trend filter determining trend on the D1 time-frame; it outputs a message: "Buy Signal" / "Wait for Signal" / "Sell

When using CCI (Commodity Channel Index) oscillator, the waiting time till the next signal can be long enough depending on a timeframe. CCI Alerts indicator prevents you from missing the indicator signals. It is a good alternative for the standard CCI indicator. Once there appears a CCI signal on the required level, the indicator will notify you with a sound or push, so you will never miss an entry. This is especially significant if you follow the indicator in different timeframes and currency p
Closing Orders At Specified Time is a utility which helps you to close opened orders and delete pending orders at a specified time - especially when you cannot be online and do it by yourself at that time. You can schedule a specific time for closing orders, and additionally you can choose what type of orders should be closed (all, only opened or only pending), what symbols (all or you can enter names of three symbols) and with what Magic Number. You can also select to close only profitable or o
Trade double tops and bottoms effectively
The PZ Double Top/Bottom Indicator is a technical analysis tool that helps traders identify potential price reversal patterns in the market. These patterns, known as double tops and bottoms, are characterized by two consecutive peaks or valleys in the price of an asset. Double tops and bottoms are often seen as potential reversal patterns because they can signal a change in the direction of the current trend. [ Installation Guide | Update Guide | Troubl

ReLSOved indicator is primarily directed at traders using trading strategies based on the price action patterns. The indicator knows exactly where the rails go! The "rails" are the five patterns of the famous Price Action strategy - Rails, Outside bar (OVB), Reversal pivot points (PPR), Wide range bar (WRB) and Inside Bar False BreakOut - IB-FB, which is known as Fakey among the fans of Price Action trading. They can be used together or in various combinations (the display of each pattern is cus
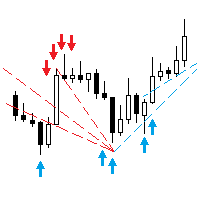
The Expert Advisor trades the signals from an artificial neural network. Network with one hidden layer. Presence of a signal is checked at the closing of the specified period, which significantly increases the optimization and testing speed. It differs from the previous version by a number of additional features: works with pending orders; subsequent trades are opened with a lot increased by the specified step; moves the trade to breakeven a specified time after it was opened; closes trades at t

The Intraday Momentum Index ( IMI ) is a technical indicator that combines aspects of Candlestick Analysis with the Relative Strength Index ( RSI ). The Intraday Momentum Index indicator concept remains similar to RSI and includes the consideration for intraday open and close prices. The IMI indicator establishes a relationship between a security open and close price over the duration of a trading day, instead of how the open and close prices vary between different days. As it takes into conside

MT5 version available here: MT5 Drawer . This tool allows you to draw on the chart using keyboard shortcuts. It also provides some custom drawing tools for your convenience. You can configure 3 variants for each tool (6 for advanced patterns), which you will be able to choose from dashboard. There is also, a possibility to define up to 30 quick access keys that skips the dashboard step and goes straight to drawing. Here are the list of supported tools: Advanced Pattern - draws two triangles Ris
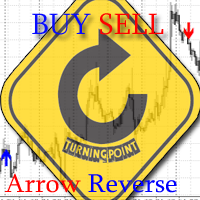
The indicator shows the market reversals as arrows. The reversal signals are based on observation of the market behavior. It is based on the principles of searching for extremums, volumes and Price Action. The indicator provides signals on the following principles: Search for the end of the ascending/descending trend Search for the reversal pattern based on Price Action Confirmation of the reversal by the contract volume. The indicator also features an alert triggered when the arrow appears. The
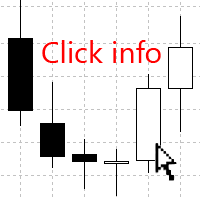
The Click Info is a simple utility that allows the trader to quickly receive information about the High, Low, Open, Close, Time values of the current chart. In order to receive information about a bar, it is necessary to left-click the selected candle. Depending on the settings, either a pop-up Alert or a Comment with the information appears. Information on the bar values (High, Low, Open, Close, Time) can be extremely useful in practice of trading using graphical analysis, evaluation of the Pri
If you use the MFI (Money Flow Index) indicator, the waiting time till the next signal can be long enough. Now you can avoid sitting in front of the monitor by using MFI Alerts. This is an addition or a replacement to the standard MFI oscillator . Once there appears an MFI signal on the required level, the indicator will notify you with a sound or push, so you will never miss a signal. This is especially significant if you follow the indicator in different timeframes and currency pairs, which ca

You can avoid constant monitoring of computer screen waiting for the DeMarker signal while receiving push notifications to a mobile terminal or a sound alert on the screen about all required events, by using this indicator - DeMarker Alerts. In fact, it is the replacement of the standard indicator with which you will never miss the oscillator signals. If you don't know the benefits of DeMarker or how to use it, please read here . If you need signals of a more popular RSI indicator, use RSI Alert
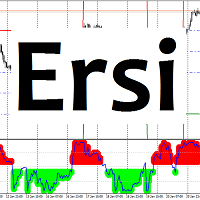
Ersi 표시기는 과매수 및 과매도 영역을 보여줍니다. 영역은 설정에서 설정한 레벨로 조정할 수 있습니다. 설정: Period_I - 지표 계산을 위한 평균 기간. Applied_Price - 중고 가격; Percent_Coefficient - 백분율 계수; Count_Bars - 표시기를 표시할 막대의 수입니다. Overbought_level - 과매수 영역 수준; Oversold_level - 과매도 구역 수준; Overbought_color - 과매수 영역의 색상. Oversold_color - 과매도 영역의 색상입니다. 표시기는 과매수 및 과매도 영역을 보여줍니다. 영역은 설정에서 설정한 레벨로 조정할 수 있습니다. 설정: Period_I - 지표 계산을 위한 평균 기간. Applied_Price - 중고 가격; Percent_Coefficient - 백분율 계수; Count_Bars - 표시기를 표시할 막대의 수입니다. Ov
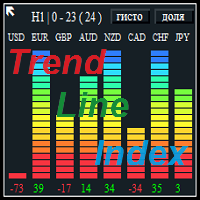
The Trend Line Index is a multi-currency indicator that shows the strength of a currency at the moment or for any period of history data.
Description of strategy and operation principle The indicator constantly analyzes 8 currencies or the ones that make up the 28 currency pairs . In the settings you can choose the period to analyze the movement you are interested in. To do this, select the timeframe, the number of the analyzed bars in the settings, as well as the number of the bar to start the

AMD Exclusive characterized by high efficiency and can constitute a complete system. Indicator based on Price Action, Statistics and Overbalance. We encourage you to study indicator on its own until you know the tendencies of how it behaves relative to price movement. Indicator automatically optimizes time frame M15, M30, H1, H4, D1 and W1 (press the button [O] on the chart). Filter OVB (overbalance) has three modes: Manual [button F on chart]. Semi-automatic [button F on chart]. Automatic [butt

The indicator calculates and displays Renko bars using Bollinger Bands and Parabolic SAR data as well as provides buy/sell signals. Renko is a non-trivial price display method. Instead of displaying each bar within a time interval, only the bars where the price moved a certain number of points are shown. Renko bars do not depend on a time interval, therefore the indicator works on any timeframe without losing its efficiency. The buy signal is generated when the average line of Bands is directed

Tribal EA is the newest conservative trading Expert Advisor with a powerful order control filter, the development of which took the last six months. The EA does not use martingale, averaging or similar risky techniques. It always uses stop loss, tale profit and order closure based on additional filters. All appropriate settings are stored in the Expert Advisor code, so there is no need to download additional set files - you only need to attach the EA to recommended pairs. The settings are valid

A scalper system only work during Asian hours. Several unique indicators to detective the price fluctuation. Dynamic TP/SL level according to market conditions. Fixed stop loss to protect the capital, very low risk of losing a lot of money. No need to obtain SET files. The parameters are the same for each currency pair. It is optimized to work on GBPUSD . It is recommended to use it on M15 chart. It is recommended to run it on FBS Zero Spread Account . It is recommended to do 99.9% modeling qua
This Expert Advisor trades based on trend lines, as well as on the basis of volume analysis. Volumes are calculated using minute bars, in order to determine if they were ascending or descending. The trend lines are drawn based on High and Lows in the trade history. There are also additional indicators. Buy or sell signals depend on all those factors. This allows the EA to enter the market with more accuracy and to perform more deals.
Input parameters Lots - lot size (if 0, a lot is calculated b
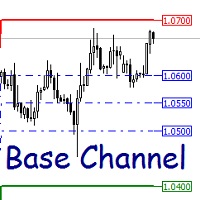
Base Channel 동적 지원 및 저항 수준의 표시기. 표시기 설정 설명: Channel_expansion_coefficient - 채널 확장 계수
Main_Level - 표시기 수준을 다시 계산하기 위한 제한 크기 ArrowRightPrice - 올바른 가격 레이블 표시 활성화 또는 비활성화 color_UP_line - 상단 저항선의 색상 color_DN_line - 하단 지지선의 색상 color_CE_line - 중심선 색상 style_ - 중심선 스타일 width_ - 중심선의 너비 동적 지원 및 저항 수준의 표시기. 표시기 설정 설명: Channel_expansion_coefficient - 채널 확장 계수
Main_Level - 표시기 수준을 다시 계산하기 위한 제한 크기 ArrowRightPrice - 올바른 가격 레이블 표시 활성화 또는 비활성화 color_UP_line - 상단 저항선의 색상 color_DN_line - 하단 지지선의 색상 color_CE_l

Features All in One indicator is a simple indicator. It makes you know about eight indicators in all timeframes at just one view in the same time. Stochastic RSI Moving Average (MA) Parabolic SAR ADX MACD CCI Last Candle (Candle) in all timeframes (M1, M5, M15, M30, H1, H4, D1, MN) in the same time.
Parameters Stochastic PercentK : period of the %K line. PercentD : period of the %D line. Slowing : slowing value. RSI RSIP1 : period 1 RSIP2 : period 2 Fast Moving Average MA averaging period: aver
Break Even LeveL 표시기는 시장에 미결 주문이 있을 때 작동하고 가격 수준을 계산합니다. 가격 수준에 도달하면 모든 미결 주문의 총 이익은 손실이 없는 수준인 0과 같습니다. 계산은 지표가 실행되는 통화 쌍의 주문을 고려합니다. 주문은 매직 넘버로 필터링할 수 있습니다. 표시기 설정 설명: Line_Create - 손실 없이 라인 표시 color_Line - 선 색상 style_Line - 선 스타일 width_Line - 선 너비 Text_Create - 줄 위와 아래에 텍스트를 표시합니다. font_Text - 텍스트의 글꼴 font_size_Text - 텍스트 글자의 높이 color_Text - 텍스트 색상 color_Text_Profit_Zone - 수익성 있는 영역의 텍스트 색상 Label_Create - 텍스트 레이블 표시 좌표_x - 텍스트 레이블의 x 좌표(픽셀 단위) 좌표_y - 텍스트 레이블의 y 좌표(픽셀 단위) corner_Label - 텍스트

This indicator depends on some secrets equations to draw Signals with Stop loss and maximum 4 Take profits. There is a free EA depends on this indicator as a gift when you purchase/rent it.
Features Simply it gives you entry point as Ready sign (Buy / Sell) and arrow (Buy / Sell) after candle closed, also SL line and 4 TP lines or less. Once SL-TP lines are shown with the arrow, they remains as they are until signal change. It is historical indicator. No Repaint. user manual for V5 please click

This is an optimized and ready-to-use automated trading system. A market entry is performed at a certain time on a quiet market. When certain conditions are met, a trade is closed. As a rule, a profit is small. The EA features SL to manage losses. The EA is recommended for use on currency pairs and M5 timeframe. Before using on a live account, it is recommended to test the EA in the strategy tester in the terminal. The EA operation requires a broker with minimum spread and minimum or no commissi

Who will be interested in this product: those who are used to diversify the portfolio with a large number of pairs. those who work with a large number of orders those who trade news using pending orders (see the "Grid request" tab). The panel is designed to make managing a large number of orders as easy as managing one.
"Trading" window "Request" tab The currency pairs and order types for opening are formed here. The prices and stop levels are set.
User can define the price values in points and
Every experienced trader knows that the trend lines should be paid the special attention in Forex trading. But plotting trend lines takes time, and there can be many of them on the charts… Do you want to learn how to quickly and easily automate this process? Then read on. There is a solution — smart and reliable trend line indicator, the Automatic Trendline . All you need to do is attach the indicator to the chart, and it will draw all possible trend lines for you. You just have to admire the re

This tool monitors your current Expert Advisors and manages stop losses and take profits. You can customize which EAs and/or which currencies to monitor. It is primarily meant for EAs that you feel manage stop losses and/or take profits poorly. If you want this tool to be able to monitor manual trades, please use '0' (zero) as the magic number. Supports hidden stoploss and take profit Supports ATR-calculated dynamic stoploss Supports Breakeven for individual trades Supports Trailing stop Lower r

This long-tern Expert Advisor uses 2 trading strategies: The first strategy will hunt down strong price movements. It will then start opening multiple trades in the direction of that trend. The trades will either hit Takeprofit or Stoploss, or the EA will close the group of trades when it exceeds a certain profit. The EA uses a smart filter to gradually capture profit. If there is a reversal in the trend, it will not add extra trades. The second strategy tracks the trend reversals. Also with thi

The List swap is an indicator for the MetaTrader 4 platform, which allows to display swaps for all symbols (available in the Market Watch). When using the free demo version, you need to remember that the Strategy Tester of the MetaTrader 4 does not provide the ability to obtain data on other symbols. In the Strategy Tester, the swap information will be displayed only for the symbol the indicator is attached to. The indicator can be useful for traders utilizing the "Carry trade" strategy, as well

Professional Prediction Indicator Based on matching the history with selected pattern model and shows the most likely outcome.
Pi indicator includes Pattern line, Scanned_Past line, Matching_Pattern line, Future_Predicted line, adjustable Model Band , and some other controls.
This indicator is designed primarily for professional use and is very useful in the search for the probability of the results relating to the future.
Note : The results depend on model_band and past_bars . They are approxim
Grid Flat Expert Advisor는 지정된 단계로 주문 그리드를 배치합니다. 주문에는 그리드 단계 거리의 이익 수준과 동일한 유형의 모든 주문에 대한 일반적인 손실 수준이 있습니다. 거래는 설정에 지정된 기간 내에서만 수행되며, 시간이 끝나면 모든 보류 중인 주문이 삭제되고 모든 열린 포지션이 강제로 닫힙니다. EA는 중요한 뉴스의 발표 또는 기타 유사한 시장 상황과 같은 특정 시장 상황에서만 작동하는 장기 거래를 위한 완전 자동화된 거래 시스템으로 사용하지 않는 것이 좋습니다.
어드바이저 설정에 대한 설명 Open_BuyStop - 보류 중인 Buy Stop 주문 그리드 열기/열지 않음 Open_SellStop - 보류 중인 판매 중지 주문 그리드 열기/열지 않음 Open_BuyLimit - 보류 중인 구매 제한 주문 그리드 열기/열지 않음 Open_SellLimit - 보류 중인 판매 제한 주문 그리드 열기/열지 않음 TIME_HOUR_START - 고문의 작업

Multi-currency grid Expert Advisor, in most cases it receives quite accurate entries. If an entry is not accurate enough, the positions are managed using an elaborate martingale strategy. Work on real account: http://tiny.cc/nkaqmz Entries are performed using the signals of RSI and Stochastic indicators, in the overbought/oversold areas, plus additional entry conditions based on a proprietary algorithm. Recommended timeframe - М15. The EA features a drawdown management system, which takes into

The EVO Exclusive EA is based on support/resistance level breakthroughs. It works autonomously on a VPS server. The EA passed testing on real ticks. Pro or ECN accounts with Market Execution are required for correct operation. The Expert Advisor controls the spread and slippage, thereby protecting your capital from risks. It does not use Martingale, grid or hedging techniques. It uses stop loss, tale profit and trailing stop. Real account monitoring: https://www.mql5.com/en/signals/author/aibeku

The strategy is based on a reverse breakout, it trades using pending BUY LIMIT and SELL LIMIT orders. Recommended currency pair/timeframe: EURUSD M30.
Monitoring https://www.mql5.com/en/signals/author/profi_mql
Parameters Magic — ID of EA's trades. Order Comment— a comment to the EA's orders. Slippage — Allowable slippage before an order triggers. Order Type — select trade direction. Max Spread — Maximum Spread allowed before pending order triggers. disable trade if spread high — disable tradi

This is an advanced Expert Advisor based on Lasors. The modified analysis algorithm allows you to better process the signals of the same-name indicator. Along with other changes and innovations, this facilitated program separation into a new product. The EA features a level breakthrough strategy. Stop loss and take profit levels are added immediately after a trade is opened. If the market has no definite trend, part of a position is gradually closed with a new impulse. In case of a dynamic trend
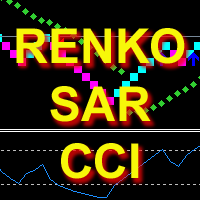
The indicator calculates and displays Renko bars using PSAR and CCI data as well as provides buy/sell signals. Renko is a non-trivial price display method. Instead of displaying each bar within a time interval, only the bars where the price moved a certain number of points are shown. Renko bars do not depend on a time interval, therefore the indicator works on any timeframe without losing its efficiency. The buy signal is generated when the CCI indicator crosses the 100 level upwards, and the PS

Strong Weak 다중 통화 표시기는 56개의 통화 쌍을 동시에 분석합니다.
AUD EUR GBP NZD CAD CHF JPY USD AUD SUMM EURAUD GBPAUD AUDNZD AUDCAD AUDCHF AUDJPY AUDUSD EUR EURAUD SUMM EURGBP EURNZD EURCAD EURCHF EURJPY EURUSD GBP GBPAUD EURGBP SUMM GBPNZD GBPCAD GBPCHF GBPJPY GBPUSD NZD AUDNZD EURNZD GBPNZD SUMM NZDCAD NZDCHF NZDJPY NZDUSD CAD AUDCAD EURCAD GBPCAD NZDCAD SUMM CADCHF CADJPY USDCAD CHF AUDCHF EURCHF GBPCHF NZDCHF CADCHF SUMM CHFJPY USDCHF JPY AUDJPY EURJPY GBPJPY NZDJPY CADJPY CHFJPY SUMM USDJPY USD AUDUSD EUR
Octet 표시기는 다중 통화이며 동시에 56개 통화 쌍을 분석합니다. 모든 통화 쌍이 시장 개요에 있고 호가가 로드되는 것이 중요합니다. 지표는 총 7개의 다른 통화에 대한 특정 통화의 상승 또는 하락을 라인 형태로 보여줍니다. 지표 값은 백분율로 표시됩니다.
표시기 설정 설명 Type_Calculation - 통화의 성장 또는 하락 비율을 계산하는 세 가지 옵션 접두사 - 통화 쌍 지정에 접두사가 있을 때 사용됩니다(예: EURUSD.fxp, 접두사 = .fxp 설정). Show_AUD - 다른 7개 통화를 기준으로 AUD 통화에 대해 계산된 총 값을 표시합니다. Show_EUR - 다른 7개 통화를 기준으로 EUR 통화에 대해 계산된 총 값을 표시합니다. Show_GBP - 다른 7개 통화를 기준으로 GBP 통화에 대해 계산된 총 값을 표시합니다. Show_NZD - 다른 7개 통화를 기준으로 NZD 통화에 대해 계산된 총 값을 표시합니다. Show_CAD - 다른 7개

Elastic Grid MT4 is a multi-functional grid Expert Advisor, designed for full or partial automation of various ideas related to grid trading. The EA trades on any timeframe and symbol. It can also trade several symbols with any amount of decimal places. It does not interfere with manual trading and other EAs' operation or any indicators. It allows to adjust its settings on the fly, works only with its own orders displaying all necessary data on them when needed, and for some situations it can be

A script for closing all open positions in one click. It has no settings, you only need to save it to folder ...\mql4\scripts folder and restart the terminal. A click on the script will close all open positions with the best possible time. Works on all types of accounts with all currency pairs and any broker. The number of open positions is not limited.
The script will be useful for trading strategies, in which you need to manage a large number of orders.
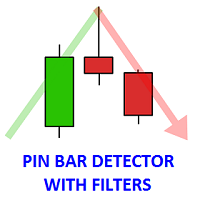
The indicator finds the Pin bars on the chart, perhaps, the most powerful Price Action pattern. The indicator has additional filters, and the user can: specify all parameters of the pin bar size as a percentage of the total candle size (minimum length of the large wick, maximum values of the short wick and body size). set the number of fractals for the last N bars, the Pin bar is based on, i.e. define the support/resistance levels. specify the required number of bearish/bullish bars before the P

Firm EA는 지표를 사용하지 않으며 지속적으로 시장에 나와 있습니다. 고문의 논리는 시장에서 이미 열린 주문의 분석을 기반으로 합니다. 권고자 설정에 대한 설명: StopLoss_Percent - 손실 수준, 백분율 TakeProfit - 이익 수준(포인트) 위험 - EA의 주문량 자동 결정을 위한 설정, LOT = 0일 때 작동 LOT - 고정 주문량 슬리피지 - 최대 허용 가격 슬리피지 MagicNumber - 고문 주문의 매직 넘버 Show_Information - 정보 게시판 활성화 또는 비활성화 color_background - 배경색 color_text - 텍스트 색상 color_negative - 음수 값의 색상 color_positive - 양수 값의 색상 EA는 지표를 사용하지 않으며 지속적으로 시장에 나와 있습니다. 고문의 논리는 시장에서 이미 열린 주문의 분석을 기반으로 합니다.

Femade Indie Vs 1.0 is a simple but multi-currency monitoring Indicator created to instantly notify the trader when an attached currency pair is ready to buy, sell or give signal when such currency pair is getting ready for a big move either up or down. It does this by visual aids on the screen charts, sound and pop-up alerts. If it shows " Medium ", this means that the so called currency signal is almost gone but can still be traded provided the trader will not need a lot of pips which can be b

Hi Traders, This useful product will Helps you to get 28 currencies power meter as indicator buffers for use in Expert Advisors and other Indicators . You can get them as buffers 0-27 for current candle. Buffers Value - This values are between -100 to +100 ("-" for Bearish Trend, "+" for Bullish Tread), For Ex. if EURUSD's Buffer is +37 it means it is in a bullish trend and bigger values is better for us. Time Frames - In all time frames you will get same values for each buffer (thy are not depe
Operation principles Non-linear TrailingStop ! The Expert Advisor works on any timeframe and currency pair. Multiple indicators are analyzed during the EA operation. If the required conditions are met, a market order is placed. The EA does not open the next order until the previous one closes.
Important! The significant part of this EA is the TrailingStop block, making the StopLoss follow the price. The main difference between this block from the standard one is that it is not linear. Specify t
Bollinger Bands (BB) + Relative Strength Index (RSI) + Alert
Many traders are interested in the Reversal Strategy. The indicators Bollinger Bands (BB) and the Relative Strength Index (RSI) are suitable for this strategy. The indicator offered here combines Bollinger Bands (BB) and the Relative Strength Index (RSI) to get pop-up and sound alerts. This supports you especially when trading multiple currency pairs. For this strategy a periodicity of for example >30 minutes could be appropriate.
T

The Panda EA trading system is based on the analysis of price action, and it monitors the trend reversals. The operation principle is similar to trailing stop, with the exception that this system helps in finding the entry points, plus additional filters.
Parameters Level: Level of the price channel (in points), for the analysis. The_number_of_levels: The number of levels. StopLoss: Stop loss. TakeProfit: Take Profit. TrailingStop: Trailing stop, works based on the order opening price, set 0 to

Listo Scalper is a fully automated Expert Advisor designed for Traders. Listo Scalp using several indicators. Recommendations for EA use EURUSD, GBPUSD, USDJPY. This robot trades on any Time Frame, please use this EA on M5 timeframe. The system is ready-to-use with the setup is simple,with simple optimization on Take Profit, Stop Loss, and Trailing. Please use a good broker with low spread.
Input Parameters OrderCmt = used for comments Magic = 256 - magic number to identify the order's mode for

The indicator can help traders to assess in advance the number of Lots, Balance and Equity, if the price deviates from the current levels. The indicator will be useful for those who trade using grid strategies or Martingale.
Features The indicator belongs to the category of risk management . It will be useful for the traders who usually have a lot of open orders on one instrument. The indicator helps to assess in advance the account change that would happen in case of possible price change from
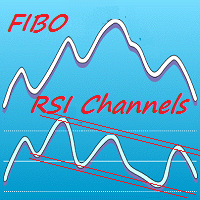
Colored indicator of the linear channels based on the Fibonacci sequence for the RSI. It is used for making trading decisions and analyzing market sentiment. The channel/channels boundaries represent strong support/resistance levels, as they are the Fibonacci proportion levels. Users can select the number of displayed lines of channel boundaries on the chart by means of the input parameters. Various options for using the indicator are shown in the screenshots. The middle of the channel is shown
MetaTrader 플랫폼 어플리케이션 스토어에서 MetaTrader 마켓에서 트레이딩 로봇을 구매하는 방법에 대해 알아 보십시오.
MQL5.community 결제 시스템은 페이팔, 은행 카드 및 인기 결제 시스템을 통한 거래를 지원합니다. 더 나은 고객 경험을 위해 구입하시기 전에 거래 로봇을 테스트하시는 것을 권장합니다.
