MetaTrader 4용 Expert Advisor 및 지표 - 31
High Low Cloud Trend 지표는 적응형 가격 경계를 통해 추세 방향과 평균 회귀 기회를 식별하는 채널 기반 기술적 분석 도구입니다. 이 시스템은 지정된 되돌아보기 기간 동안 최고 고점과 최저 저점을 계산하여 전체 가격 범위를 정의하는 외부 채널 경계를 생성하는 방식으로 작동합니다. 보조 내부 채널은 더 짧은 기간(주요 되돌아보기 기간의 4분의 1)을 사용하여 더 넓은 범위 내에서 더 즉각적인 가격 움직임을 포착합니다. 지표의 핵심 로직은 종가를 참조 값과 비교하여 추세 방향을 결정하는데, 이 참조 값은 가격이 이러한 극값에 닿는 위치에 따라 최고점과 최저점 사이에서 반전됩니다 - 가격이 최저 저점에 도달하면 참조가 최고 고점으로 전환되고 그 반대도 마찬가지입니다. 이는 지표가 채워진 히스토그램이나 선으로 하단 채널(상승 추세) 또는 상단 채널(하락 추세)을 표시하는 이진 추세 상태를 생성합니다. 평균 회귀 감지 메커니즘은 가격이 외부 경계에 닿은 후 내부 채널로 다시 이

This Weis Wave Volume indicator is a tool to help traders identify the current price trend. Understanding volume can provide insight into a market's behavior to help you determine its overall health. The most important rule is this: volume precedes price. Typically, before a market price moves, volume comes into play. It has 2 main colors histogram which are green and red. – Green indicates an upward wave. The more the price increases, the bigger the green volume gets. – The red color shows a d
FREE

It's an automated Forex strategy and programmed analytical system that allows you to sit back, relax and simply watch the Robot do its trick. After the parameters, scales and limits of your transactions have been provided by you, the Robot takes over and handles all the trades for you. This permits you to take control while focusing your energies on other important matters as well. This EA is especially designed for trading the XAUUSD (Gold pairs). It works best with M5 H1 timeframe. The trading

LAUNCH PROMO - $49 for early buyers MYFXBOOK - CLICK HERE TO SEE! - 2025 TEST, 3 YEARS SPREAD STRESS TEST , 3 YEARS AVERAGE SPREAD TEST
To see verified results, copy link below: myfxbook.com/members/ARAISYSTEMS After purchase, send me a private message to receive the installation manual and detailed setup instructions. TASMAN EA is a high-performance algorithm engineered for NZDCHF , optimized for RAW spread accounts and prop-firm trading conditions .
Backtested over 20+ years using 99% tick ac

GoldFlash EA – Precision Speed for Gold (XAU/USD) GoldFlash EA is a powerful Expert Advisor (EA) designed specifically to trade the XAU/USD (Gold/USD) pair using a fast, intelligent scalping strategy . The bot analyzes the market in real time, detects explosive moves, and places Buy Stop and Sell Stop pending orders to never miss profitable breakouts. It’s ideal for traders seeking daily results with risk-controlled performance . ️ Key Features Pending Order Entries (Buy/Sell Stop)
Strate
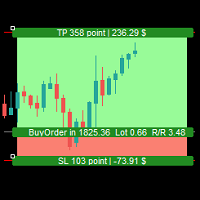
Simple Assistant for Trading
Precise Risk Management in each
Automatic Money Management Visual Trading Open Position Management User friendly and practical
during 15 years of considerable experience in stock market, we have dealt with many professional traders who have been used profitable and unrivalled methods in this market but failed in the long term. The reason is undoubtedly the lack of standard in their manner during their trade. Standard means the accurate repetition of a process….

Dark Breakout is an Indicator for intraday trading. This Indicator is based on Trend Following strategy, providing an entry signal on the breakout. The signal is provided by the arrow, which confirms the breaking of the level. We can enter in good price with this Indicator, in order to follow the main trend on the current instrument. It is advised to use low spread ECN brokers. This Indicator does Not repaint and N ot lag . Recommended timeframes are M5, M15 and H1. Recommended working pairs

''Trendlines'' is an Indicator, that every Trader need and shows Trendline and Support and resistance levels in all Timeframe's. Also In 1-hour, 4-hour and daily time frames and Current timeframes, support, and resistance levels are specified and trend lines are drawn so that the trader can see all levels on a chart. In Properties it is possible to turn off unnecessary Lines.
In ' Tendency indicator '' , as full package of Predictions that every Trader need, there is also the Predict
FREE

Oil Master indicator is a very beginner-friendly buy sell arrow type indicator that works on oil pairs, this indicator focuses on giving quick scalping signals with built-in money management in form of Take profit and stop-loss colored lines that come with each arrow signal, the indicator also has its built in Stats panel that gives signal accuracy % alongside useful info. HOW TO USE : Open trade according to arrow direction, after that use the TP and SL lines above and below the arrow and drag
FREE

The BinaryFortune indicator has been developed and adapted specifically for trading short-term binary options. The algorithm of the indicator analyzes numerous factors before generating a signal. The indicator is installed in the conventional way. The indicator consists of an information window, which displays the name of the trading instrument, support and resistance levels, and the signal itself ( BUY , SELL or WAIT ). A signal is accompanied by a sound and a pop-up Alert. Advantages of the in
FREE

SMARTMASS INDICATOR This indicator is different from all known volume indicators. It has a significant distinction; it is an algorithm that relates price movement to volume, attempting to find proportionality and efficient movement while filtering out noise and other movements that are more random and do not follow a trend or reversal. Ultimately, it reveals the true strength of the movement, indicating whether it has genuine support from bulls or bears or if it's merely a high-volume movement

QualifiedEngulfing - ProEngulfing 지표의 무료 버전입니다. ProEngulfing - Advance Engulf 지표의 유료 버전으로, 여기에서 다운로드할 수 있습니다. ProEngulfing 의 무료 버전과 유료 버전의 차이점은 무엇인가요? 무료 버전은 하루에 하나의 신호로 제한되어 있습니다. QualifiedEngulfing을 소개합니다 - MT4용 전문 Engulf 패턴 지표 QualifiedEngulfing을 사용하여 외환 시장에서 자격을 갖춘 Engulf 패턴을 식별하고 강조하는 혁신적인 지표로 정밀력의 힘을 발휘하세요. MetaTrader 4용으로 개발된 QualifiedEngulfing은 Engulf 패턴을 정확하게 인식하고 강조하기 위한 첨단 접근법을 제공하여 거래 결정에 대해 가장 신뢰할 수 있는 신호만을 제공합니다. QualifiedEngulfing 작동 방식: QualifiedEngulfing은 Engulf 패턴을 분석하기 위한 정교한
FREE
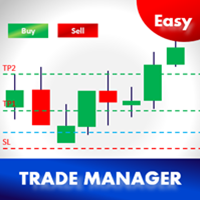
New version with Panel updated..! (Thank you users for all your great feedback!) -
Enter the Risked Amount or Lot size or % of Balance (New!) Drag the RED line on the chart to fix the Stop-Loss. Drag Blue line (New!) for Limit/Stop orders automatically ! Adjust TP1, TP2 and TP3 lines You are ready to Buy/Sell > Adjust the lines even after the trade - New!
Check the user video - https://tinyurl.com/etmmt4ea
Automatic Breakeven TP1/2 | Book Part/Partial Profit TP1-TP2 | Automatic Magic Trail TP1

이 지표의 장점: 이 지표는 스마트 머니 컨셉 (SMC) 트레이딩을 위한 도구로, 가격의 횡보(Range) 및 돌파(Breakout) 식별과 심층적인 거래량(Volume) 분석에 중점을 둡니다. 자동 범위 감지 (Automated Range Detection): 수동 작도 불필요: 시장이 횡보세에 접어들면 자동으로 박스/채널을 그려줍니다. 핵심 구간 식별: SMC의 핵심인 매집(Accumulation) 및 분산(Distribution) 구간을 명확하게 보여줍니다. 거래량 세부 분석 (Volume Breakdown): 내부 분석: 일반적인 거래량 막대와 달리 박스 내부의 거래량 구성을 분석합니다. 매수 vs 매도: 해당 구간에서 매수세와 매도세 중 어느 쪽이 우위인지 보여줍니다. 델타 볼륨 (Delta Volume): 순 차이(Net)를 계산하여 돌파 전에 추세의 강도를 확인합니다. 포인트 오브 컨트롤 (POC): 박스 내에 POC 라인(주황색 점선)을 표시합니다. 이점: 가장 많은

Check my p a id tools they work perfect! "Period Cross RSI" Is a New indicator idea that shows crosses of two RSI lines with different periods which creates ascending and descending zones for confirmation of long and short trading. This indicator is brend new and will be upgraded further, for now I recommend to use it as a confirmation, filter indicator for determination of long/short trading zones, not as a signaler indicator for now. Further upgrades can make it as a signaler indicator as w
FREE

Market Structure ICT 인디케이터 1. 자동화된 시장 구조 분석 가장 큰 장점은 주관적인 해석으로 인한 오류를 줄여준다는 것입니다. 정확한 추세 식별: 추세 지속을 위한 **BOS (구조 돌파)**와 추세 반전을 위한 **CHoCH (추세 성격 변화)**를 자동으로 식별합니다. 스윙 분류: 단기, 중기, 장기 등 시장 구조 유형을 선택할 수 있어 스캘퍼와 스윙 트레이더 모두에게 적합합니다. 2. 전문 대시보드 다른 타임프레임을 확인하기 위해 화면을 전환할 필요가 없습니다. 한눈에 보는 분석: 대시보드는 모든 타임프레임(M1~W1)의 상태를 한 화면에 표시합니다. 점수 시스템: 하위 타임프레임의 점수를 합산하여 전반적인 편향 (Overall Bias) (예: "강한 상승" 또는 "혼조")을 요약해 줍니다. 추세의 신선도: BOS가 방금 발생한 "신규 돌파(Fresh Break)"인지 오래된 구조인지 알려줍니다. 3. 차트 상의 MTF 표시 (멀티 타임프레임) 정밀한 진입

The indicator has combined 5 popular strategies. Draws an arrow after confirming a signal for the selected strategy. There are signal alerts. Doesn't redraw its values. I recommend watching my advisor - Night Zen EA
5 strategies. The main line crosses the signal line. The main line crosses the signal line in the oversold (for buy) / overbought (for sell) zones. The main line enters the oversold (for sell) / overbought (for buy) zones . The main line comes out of the oversold (for buy ) / over
FREE

See my other products here. One Click Order This product helps you to send your order as quickly and easily as possible. Send your order as fast as possible: Just set your position parameter values(Price, TP, SL, Ex Date) with just a few simple mouse drags. On the other hand, the calculation of the losses and profits value before ordering is always a big challenge for traders; This expert is very useful in taking a position and calculating the amount of the stop loss/the take profit(in the curr
FREE
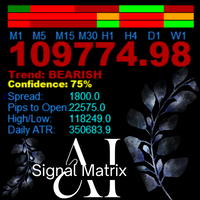
AanIsnaini Signal Matrix Multi-Timeframe Confidence Signal Dashboard AanIsnaini Signal Matrix is a powerful all-in-one indicator that analyzes market direction and confidence levels across multiple timeframes — allowing traders to see the overall bias of the market at a single glance. It combines signals from Price Action , Support–Resistance , and several proven technical tools (MACD, ADX, RSI, MA slope, ATR, and Volume Ratio), then calculates a confidence score showing how strongly th
FREE
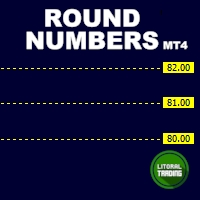
Round numbers (or key levels) is an amazing strategy. These numbers are strong support and resistance levels. So what this indicator does is draw horizontal lines on the chart to help you find these levels. Configurations: 1St level: Color - lines color. Style - lines style. Width - lines width. 2Nd level: Second level lines? - turn off second level lines. Color - lines color. Style - lines style. Width - lines width. Space between lines in points - I don't need explain :) Display at backg
FREE

MetaTrader 4용 맞춤형 지표에 대한 범용 거래 고문.
빌더 전략. Arrow 및 신호 버퍼로 표시기의 이름을 작성하면 EA xCustomEA가 이러한 신호를 거래합니다. 또한 많은 내장 기능을 사용할 수 있습니다. MetaTrader 4용 버전: MetaTrader 5 터미널용 xCustomEA 버전 범용 거래 고문 xCustomEA의 기능은 다음 하나만 제외하고 고문 X의 모든 매개변수를 정확히 복제합니다. xCustomEA 는 사용자 지정 지표에서 작동하며 MT4 터미널에 대한 거래 전략을 프로그래밍할 수 있습니다. xCustomEA 에는 인터넷이나 mql5 시장에서 다운로드할 수 있는 사용자 지정 지표에 대한 링크가 있습니다. The X EA의 표준 지표에서 +20 전략 맞춤형 지표 와 어드바이저를 프로그래밍할 수 있습니다. xCustomEA 는 신호에 대한 위치를 엽니다. Universal Trade Adviser xCusto

OpenEA Trade GPT XT Pro EA is an automated and easy to use expert advisor that has the Stochastic indicator working in combination with RSI and MACD filters built in. We have spent a lot of time testing many expert advisors . After years of testing and development, the result is an dynamic EA that is very active with trades and capital management. The EA can operate independently or in combination with additional technical indicators of e.g. PipFinite Trend Indicator Pro. The EA has been desig

Accurate Signal ARC is a non-repainting trend & reversal signal indicator designed for MT4 .
It uses ATR-weighted volatility logic combined with adaptive price channels to detect high-probability BUY and SELL points directly on the chart. How It Works Calculates a dynamic volatility channel using weighted ATR Detects trend direction (river state) and switches only when price decisively breaks the channel Filters noise using spread-aware true range Draws clear arrows : Lime Arrow → BUY si
FREE

DawnDuskDynamics EA DawnDuskDynamics is a sophisticated trading algorithm that leverages the well-known Morning Star and Evening Star candlestick patterns to identify potential market reversals. This Expert Advisor is designed for traders looking to automate their trading strategies on major currency pairs, ensuring a systematic approach to forex trading. Key Features: Trading Strategy : Utilizes the Morning Star and Evening Star patterns to determine entry points, enhancing the probability of
FREE

The We-Spread mt4 indicator is a spread trading tools and it is suitable for those who want to study the markets with a different approach to the contents that are normally available in online trading bookstores. I think the Spread Trading strategy is one of the best I've ever used in the last few years. This is a unique indicator for spread trading because allow you to study till 3 spreads in one time. What is Spread Trading on forex The Spread Trading is the study of the strength of 2 currency

Multicurrency and multitimeframe modification of the Commodity Channel Index (CCI) indicator. You can specify any desired currencies and timeframes in the parameters. Also, the panel can send notifications when crossing overbought and oversold levels. By clicking on a cell with a period, this symbol and period will be opened. This is MTF Scanner. The key to hide the dashboard from the chart is "D" by default
Parameters CCI Period — averaging period.
CCI Applied price — price type.
Clear the c
멀티 타임프레임 지원, 사용자 정의 가능한 시각적 신호 및 구성 가능한 알림 시스템을 갖춘 Relative Strength Index (RSI) 지표.
RSI란 무엇인가? Relative Strength Index (RSI)는 가격 변화의 속도와 규모를 측정하는 모멘텀 오실레이터입니다. 이 지표는 0과 100 사이에서 진동하며, 지정된 기간 동안 최근 이익의 규모와 최근 손실을 비교합니다. RSI는 주로 과매수 및 과매도 조건을 식별하는 데 사용됩니다. 높은 수치는 과매수 조건을 나타내고, 낮은 수치는 과매도 조건을 나타냅니다. 트레이더들은 또한 RSI와 가격 움직임 사이의 다이버전스를 관찰하는데, 이는 잠재적인 추세 반전을 신호할 수 있습니다. 기능: 화살표와 수직선이 있는 시각적 신호 마커 구성 가능한 트리거(방향 변경, 레벨 교차, 피크/밸리, 극단 구역)가 있는 3개의 독립적인 신호 버퍼 시간 범위 필터링이 있는 구성 가능한 알림 기능(이메일, 푸시, 사운드, 팝업) 보간
FREE
변동성과 정확성이 만나는 거래 환경에 몰입해보세요. Dynamic Grid Pro v1.7은 시장 접근 방식을 개선하도록 설계된 도구 모음을 제공합니다. 이 시스템은 끊임없이 변화하는 시장 상황에 대응하여 그리드 매개변수를 동적으로 조정하는 그리드 거래 전략 실행을 위한 유연한 프레임워크를 제공하려는 의도로 개발되었습니다. 주요 기능은 끊임없이 변화하는 시장 상황에 따라 그리드 수준을 동적으로 조정하는 능력에 있습니다. Dynamic Grid Pro v1.7 기능: 동적 그리드: 시스템은 변동성과 가격 변동에 따라 그리드 수준을 자동으로 조정하여 주문 실행을 최적화하려고 시도합니다. 주문 관리: 그리드 내에서 주문의 배치 및 관리에 대한 정밀한 제어를 허용하며, 다양한 구성 옵션을 제공합니다. 다중 진입 전략: 다양한 주문 진입 방법을 통합하여 전략 구현에 유연성을 제공합니다. 사용자 정의 가능한 설정: 시스템을 사용자의 선호도 및 거래 스타일에 맞게 조정할 수 있는 광범위한 조정
TCM Breakeven Calculator Pro is the ultimate utility for professional traders. It automatically calculates the Weighted Average Entry Price for all your open positions on the current symbol. It draws a clear line on the chart and displays a smart dashboard panel showing exactly where you need the price to go to exit with $0.00 loss . Key Features: Zero Lag: Built with high-speed event handling. Updates instantly on every tick and trade modification. Smart Dashboard: Displays the exact A
FREE

Moving Average Crossover Scanner and Dashboard Advanced Moving Average Scanner Moving Average Crossover Dashboard The indicator scans the market and sends signals and alerts for Moving Averages crossovers, death cross and golden cross. Crossovers are one of the main moving average ( MA ) strategies. MA Crossover ( cut ) strategy is to apply two moving averages to a chart: one longer and one shorter. When the shorter-term ( fast MA ) MA crosses above the longer-term ( slow MA ) MA, it's a buy sig

Introducing Dumangan MT5 - The Philippine God Of Harvest
( MT5 Version - https://www.mql5.com/en/market/product/98640 ) Experience the abundance of successful trades with Dumangan MT5, our new Expert Advisor available on MQL5.com. Named after the revered Philippine God of Harvest, Dumangan, this tool embodies the essence of reaping profits from the fertile ground of the markets, just like Dumangan blessed the fields with bountiful crops. A Focused Strategy with Customizable Settings Dumangan M
FREE

ATR Stops MTF is a trend indicator based on ATR (Average True Range) that provides dynamic stop levels, helping traders identify the prevailing market direction and potential trend reversals.
The indicator supports Multitimeframe (MTF) analysis, includes a moving average filter , and features an ON/OFF button directly on the chart for quick visual control. Main features Dynamic stops based on ATR Clear identification of the current trend Multitimeframe (MTF) support Configurable movin
FREE
Classic ZigZag formula. But no lags and repaints. You can see on screenshots that it shows values between peaks and it is useful to test strategies based on indicator. Because sometimes people find a good idea about it but don't understand that repainting indicators have some things to keep in mind. The parameters are the same as original ZigZag indicator: Depth, Deviation and Backstep.
FREE

BUILD YOUR GRID
The expert is a system to help any trader to make a grid of orders (without martingale, lite martingale, or full martingale) easy and simple. Please make your test to find your settings. Default settings are just to take an idea of how the expert works. The expert can make according or contrary grid of orders. You can set the expert to work in hedge mode if the losses are huge. The system uses a high-risk strategy. It's better to test it first in a demo account.
Version for MT5
FREE
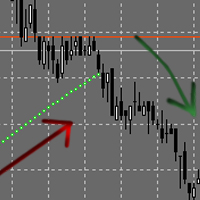
The Expert Advisor places orders based on the points of the Parabolic Sar indicator. If your trading strategy utilizes this indicator, the EA will save you from the necessity to move your pending orders after every candlestick (e.g. 5 minutes or 1 hour) and will do it automatically. You can set the EA to open only BuyStop or only SellStop or both. Buy default both Buy and Sell are enabled. The EA does not use any indicators other than Parapolic Sar. Therefore you are to decide the time to run th
FREE
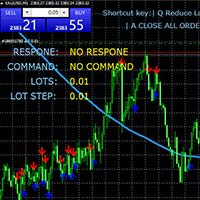
MT4 키보드 거래 플러그인 상세 설명 소개 : 이 MT4(MetaTrader 4) 플러그인은 키보드 단축키를 통해 효율적이고 직관적인 거래 경험을 제공하며, 스칼핑 전략을 따르는 거래자들이 빠르고 정확한 거래를 원하는 경우에 특히 유용합니다. 이 플러그인은 거래자의 각 거래에 대한 포지션 크기를 동적으로 조정하고, 정확한 이익추적 및 손실정지 수준을 미리 정의함으로써 거래를 간소화하고 효율화시킵니다. 핵심 기능 : 키보드 단축키 : 거래 과정을 간소화하여, 다음 거래에 대한 포지션 크기 조정, 매수, 매도, 주문 관리를 위한 사용자 정의 가능한 키보드 단축키를 사용합니다. 동적 포지션 크기 조정 : 거래 시점에 따라 포지션 크기를 쉽게 증가하거나 감소시키며, 시장에 민감하게 대응할 수 있습니다. 위험 관리 : 각 거래에 대한 이익추적 및 손실정지 수준을 피프로드로 미리 정의하여, 모든 거래에 대한 위험을 정교하게 관리합니다. 사용자 정의 : 차트의 글꼴 스타일, 글자 크기 및 배치
FREE

What is the Volume Weighted Average Price (VWAP)? The volume weighted average price (VWAP) is a trading benchmark used by traders that gives the average price an instrument has traded at throughout the day, based on both volume and price. It is important because it provides traders with insight into both the trend and value of the instrument.
What is the Difference between VWAP and AVWAP? While VWAP is having as starting point the beggining of the day,week,month etc. in the AVWAP you can plac

My Fibonacci An automated Fibonacci indicator that combines ZigZag swing detection with comprehensive Expert Advisor integration through a 20-buffer system. More details about data specification and EA integration: https://www.mql5.com/en/blogs/post/764109 Core Features Automated Fibonacci Detection The indicator identifies swing points using configurable ZigZag parameters and draws Fibonacci retracements and extensions automatically. It updates levels as new swing formations develop. Market Ad
FREE

Tipu Trend is a non-lag, non-repaint, smart indicator, that shows the trend of selected time frames.
Features Customizable Buy/Sell alerts, push alerts, email alerts, or visual on-screen alerts. As easy to trade indicator that smooths the noise in the price action. Highlights ranging markets. Add Tipu Panel (found here ) and unlock the following additional features. An easy to use Panel that shows the trend + signal of the selected time frames. Customizable Panel. The panel can be moved to any
FREE
The script allows users to easily close positions if their profit/loss reaches or Close all orders just click function that you want.
Easy Close. - close PROFIT - close LOSS - close BUY - close SELL - close ALL ORDERS
If you find problem about function or you cant not work pls contact me. I will help you anytime.
Please Ratings and Reviews.
Thanks Traders. ENJOY.
FREE
Squeeze Momentum Alert (스퀴즈 모멘텀 알림) 1. 가격 "폭발" 지점 식별 (The "Squeeze") 이 지표의 가장 큰 장점은 큰 움직임이 발생하기 전, 시장이 "숨 고르기" 또는 "에너지 축적"(횡보)하는 시기를 포착하는 능력입니다. 좋은 이유: 시장은 정체기와 폭발적인 변동성 시기를 반복합니다. 이 도구는 **"차트가 압축되고 있으니 다음 급등을 준비하라"**고 알려주어, 대형 추세의 시작을 놓치지 않게 합니다. 2. 추세 "강도"의 정밀한 구분 (Color Coded Momentum) 히스토그램은 4가지 색상 을 사용하여 추세의 건전성을 나타냅니다: 라임색 (Lime): 강력한 상승 (추격 매수 가능). 진녹색 (Dark Green): 상승세 약화 (주의: 이익 실현 준비). 빨간색 (Red): 강력한 하락 (강한 매도). 밤색 (Maroon): 하락세 약화 (매도세 소진). 좋은 이유: 추세가 강할 때 "진입" 타이밍과, 색이 바뀌자마자(모멘텀 상실)

Discover Azumi: Your Powerful and Simple Solution for XAUUSD Trading Success Azumi combines effective, no-nonsense technical analysis with robust risk management to help you capitalize on market opportunities. Using proven strategies like Fibonacci retracement levels and ATR-based calculations, Azumi ensures smart trade entries and exits while keeping your risk in check. Why Choose Azumi? Backtested over 14 months on XAUUSD with just $200 starting capital. Results and screenshots available for p
FREE

Features: fast opening / closing deals the number of deals and the total profit for the Symbol
Fast open deals: set the Lot volume set StopLoss / TakeProfit in points (if you set "0", then it is not used) set slippage set Magic (if necessary) set comment (if necessary)
Fast open features: fast open Buy fast open Sell fast close ALL open orders for the current Symbol
Attention: this utility works only on the current instrument this utility works on a VPS must enable Algo trading in the termi
FREE
Account Trailing Stop Manager MT4로 포트폴리오 리스크 관리를 강화하세요. 이 강력한 전문가 어드바이저(EA)는 MetaTrader 4에서 계정 전체 또는 특정 매직 넘버 거래의 총 수익을 자동으로 추적하고 트레일링 스톱처럼 관리하며, 현재 수익이 마지막 피크 수익 아래로 떨어지면 모든 거래를 종료하도록 설계되었습니다. MQL5, Forex Factory, Reddit의 r/Forex에서 동적 수익 고정 메커니즘으로 높은 평가를 받고 있으며, 이 EA는 외환, 지수, 암호화폐와 같은 변동성이 큰 시장에서 스캘퍼, 데이 트레이더, 스윙 트레이더들 사이에서 인기가 많습니다. 사용자들은 유리한 트렌드 동안 수익을 확보하여 수익 유지율이 20-35% 향상되었다고 보고하며, 많은 이들이 수동 모니터링 시간이 40% 감소했다고 언급합니다. 자동화된 리스크 관리를 원하는 초보 트레이더와 다중 전략 포트폴리오를 관리하는 전문가 모두에게 이상적이며, 이 EA는 다양한 트레이
FREE
SmartClose(Close All Orders) helps you close all your trades. You can use it on any symbol. You can also set a warm value to manage the risk. With these functions: Close Open Orders : Close all open trades in the trading account. You don't need to set a value for the "value" parameter. Close by Profit : Close trades when profit reaches a specific predefined level. You need to set a value for the "value" parameter. Close by Percentage : Close trades based on a certain percentage of the balance.
FREE

Draw and Sync Objects Multiple Charts 1. Draw objects by key press. ( You must: 1. Press Function key => 2. Click where you want to draw => 3. Draw it => 4. Press ESC to complete). (If you don't want to draw after pressing function key, you must press ESC to cancel). 2. Developing : Sync selected objects to multiple charts by button. 3. Developing: Hide objects that do not belong to the current symbol (Objects drawn with this indicator will belong to the symbol they are plotted
FREE

UZFX Daily Trade Guard EA는 MetaTrader 4 (MT4) 계정 및 리스크 관리 도구로, 일일 손익 한도를 모니터링하여 거래 계정을 보호하도록 설계된 단순하면서도 강력한 도구입니다. UZFX LABS(신뢰할 수 있는 외환 전문가)에서 개발된 이 Expert Advisor(EA)는 거래를 열지 않으며, 대신 리스크 관리 규칙을 엄격히 적용하여 한도가 달성되면 거래를 중단하도록 설계되었습니다. 이 도구는 모든 수준의 트레이더가 자금을 전문적으로 관리할 수 있도록 도와주며, 거래 시 규율과 안전성을 보장합니다. 다른 모든 MT4/MT5 지표 및 EA를 확인하세요 >> HERE
주요 기능 1. 일일 손익 한도 모니터링 맞춤형 일일 이익 한도(기본값: $200)와 손실 한도(기본값: -$150)를 설정합니다. EA는 계좌의 성과를 적극적으로 추적하며, 한도가 달성되면 거래를 중단하고 모든 오픈 포지션을 닫으며 대기 중인 주문을 취소하여 자본을 보호합니다.
2. 거래
FREE

UT Bot Alerts — Sistema de Trailing Stop baseado em ATR Conversão fiel do lendário indicador "UT Bot Alerts" de QuantNomad do TradingView para MQL5 e MQL4. Conceito original de HPotter, implementação inicial de Yo_adriiiiaan, versão Pine Script v4 com alertas de QuantNomad (Vadim Cissa) — um dos desenvolvedores quantitativos mais seguidos no TradingView com mais de 100 mil seguidores. O script original acumulou mais de 1,1 milhão de visualizações e 35.500 favoritos no TradingView, tornando-o um
FREE

QuanticX MultiIndices QuanticX MultiIndices Welcome to QuanticX MultiIndices, an Expert Advisor (EA) designed to optimize your trading experience on four prominent indices: US500, US30, Nasdaq, and DE30 (Dax). Our commitment to transparency and responsible trading ensures a secure and reliable approach to algorithmic trading. Key Features and Risk Management Timeframe: QuanticX MultiIndices operates exclusively on the 1-hour (1H) timeframe. Risk Management: You have the flexibility to customize
FREE

Hidden Gem: AI-Powered Precision for EURUSD Trading with Institutional-Grade Risk Management Hidden Gem – EURUSD Edition is a specialized version of the next-generation Expert Advisor (EA), designed exclusively for one of the most traded currency pairs in the world: EUR/USD. This elite version harnesses cutting-edge artificial intelligence to deliver ultra-precise trade execution, tailored risk-reward strategies, and market-adaptive logic focused solely on the EURUSD pair. - Core Innovations AI-

Key Features: Automatic swing detection on any timeframe (M1 to MN1) Visual arrow indicators (red for swing highs, blue for swing lows) Adjustable sensitivity with customizable swing strength parameter Dynamic arrow positioning that never overlaps with candles Instant display when changing timeframes - no delays Compatible with MT4 and MT5 platforms Clean, professional interface with minimal screen clutter Lightweight code for fast performance Customizable colors and arrow sizes
Customizable S
FREE

Description
SuperCCI is an indicator based on the standard CCI indicator. It identifies and displays convergences/divergences in the market and forms the corresponding entry points. Also, using the trading channel index, it determines the direction of the trend and displays the levels of support and resistance .
Features Not repaint. Shows entry points. Shows the direction of the current trend and support/resistance levels. Has notifications. Recommendations
Use convergence/divergence to ide

Fireball EA is an automated expert advisor that uses a unique approach to money management and volatility based entry signals to capture market movements independent of direction. It is fully compatible with FIFO rules and works on hedging as well as netting accounts. Pairs and Timeframe
Fireball EA runs on M15 timeframe. The following currency pairs are officially supported: EURUSD GBPUSD USDJPY USDCAD USDCHF AUDUSD NZDUSD Settings
Money Management - Either FIXED or DYNAMIC Fixed Volume - Fixed
FREE
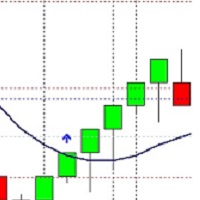
Renko Booster Choose to open a position, buy or sell, or both. Open a position with one, two or any number of reverse blocks. Close the position one, two, or any number of upside down blocks. Close position after pips. Specify the exact trading time. In my opinion, the EURUSD pair works best. 10 or 20 pips box. It also works on other pairs. Parameters in points: 10 pips = 100 points etc. My strategy EURUSD H4 box 200 points (200 points Stop Loss and 200 points TP, One reverse block, opening).
FREE

The trend pigs is a trend EA with a filtering system. It is recommended to configure the EA based on your experience.
To configure the EA, you can use the following indicators:
MA Cross indicator with parameters(periods) settings. Main signal A TREND indicator with parameters(periods) settings. There is a possibility of switching off. The Squeeze indicator with the settings(periods). There is a possibility of switching off.
The expert advisors have the ability to filter signals according to t
FREE

The "Trend Edges" indicator determines whether the trend is rising or falling. It is suitable for any time frame (tested on DAX).
The indicator should be treated like Bollinger Bands, meaning that if it breaks out upwards, you can buy with a stop loss below the lower edge.
Find a trending pair, index or CFD. Additionally :
-Sound alert on trend change.
-Alert Notification
-Alert Notification on your mobile phone Check my other indicator "Trend Edges histogram"
FREE

추세 거래를 위한 다시 그리기가 아닌 채널입니다. ATR에 따라 표시되며 반대 변동성 경계가 있습니다. 지표는 충동 수준 및 잘못된 돌파에 대한 전략에서 잘 입증되었습니다. 진입점은 지시선 수정에서 찾아야 하고 이익실현은 반대쪽 경계에서 설정해야 합니다. Blog-Link - Retest and Fake Breakout with UPD1 .
입력 매개변수.
Bars Count - 표시할 역사. ATR - 계산 기간. Coefficient - 동적 가격 채널의 높이에 영향을 미치는 계수.
Visual Channel - 단일 또는 이중 라인 디스플레이. Simple Line Visual Width - 단순한 선 두께. Simple Line Buy Color - 단순한 선 색상 Buy. Simple Line Sell Color - 단순한 선 색상 Sell.
Reverse Channel - 상대 채널 표시 여부. Reverse Channel Co
FREE
LINK : https://linktr.ee/ARFXTools ;
BBMA + SMC TRADING FLOW (Smart & Simple) 1. IDENTIFY THE MAIN TREND (Multi Time Frame) Use indicators: BBMA MTF PANEL (check trend direction on MN, W1, D1, H4) Only trade when D1 and H4 are in the same direction Example :
If D1 = Buy and H4 = Buy → Focus on Reentry Buy only 2. WAIT FOR CSA + CSM (Valid Entry Setup) CSA Buy : Candle closes outside lower Bollinger Band + MA5 low > MA10 low CSM Buy : Candle re-enters BB + MA5 low crosses above MA10
FREE
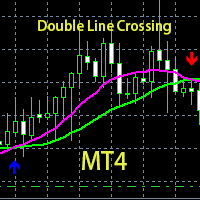
his is a custom indicator based on double-average crossing and arrow marking.
Make multiple lists when blue arrows appear up.
Make a blank list when the red arrow appears down.
When the pink line crosses the green line upwards, the pink line is above, the green line is below, the golden fork appears, and the blue arrow appears.
When the pink line crosses down through the green line, the pink line is below, the green line is above, a dead fork appears, and a red arrow appears.
This is a good
FREE

Product Name: MY DASHBOARD (v) – Smart Trading Panel for MT4 MY DASHBOARD is a professional-grade trading utility designed to streamline your MT4 workspace. It integrates essential portfolio data, risk metrics, and market insights into a single, clean interface—allowing you to focus on trading while the dashboard handles the calculations. Key Features Real-Time Market Info: Symbol Display: Clearly identifies the current trading instrument. Dynamic Spread Monitor: Visual alerts when spreads ex
FREE

You can manually open a trade (one click), and this EA will take care of setting the SL and TP. SL and TP are set based on the number of pips you specify in the input screen. You can also choose monetary SL and TP. SL and TP are determined based on the weighted average price (WAP), so if you open a new trade, SL and TP will be updated according to the new WAP. The WAP is not unique but differentiated between buy and sell trades (this is useful only if you open opposite trades on the same chart)
FREE

www tradepositive .lat
ALGO Smart Flow Structure Indicator The institutional standard for market structure. Designed for serious SMC (Smart Money Concepts) and Price Action traders, this indicator eliminates the noise of conventional fractals. Forget about repainting signals and ambiguity; get a crystal-clear view of the real market structure , validated by strict algorithmic rules. The Bias Dashboard Make informed decisions by monitoring 3 critical variables across 8 simultaneous timefr
FREE
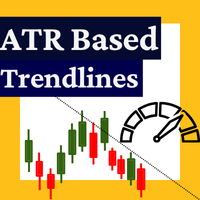
이 지표는 TradingView의 "ATR Based Trendlines - JD" by Duyck를 MetaTrader 4용으로 변환한 버전입니다. 작동 방식
이 지표는 가격뿐만 아니라 ATR이 감지한 변동성을 기반으로 자동적·지속적으로 추세선을 그립니다. 따라서 추세선의 각도는 ATR(의 일정 비율)에 의해 결정됩니다. 추세선의 각도는 피벗 포인트가 감지되는 순간의 ATR에 따라 가격 변화를 따라갑니다. ATR 백분율은 추세선이 ATR 변화율을 그대로 따를지(100%), 일부만 반영할지(<100%), 아니면 배수로 반영할지(>100%)를 결정합니다. 입력 매개변수 Lookback depth: 피벗 발생 여부를 확인할 캔들 수 설정 ATR target percentage: 추세선 방향에 대한 ATR 효과의 민감도 조정 Draw lines from wicks or real bodies: 피벗 및 ATR 계산 시 캔들 몸통 또는 심지 사용 여부 선택 추세선 방향 (상승, 하락, 또는
FREE

Overview: Golden Buzzer is a two-in-one Expert Advisor (EA) designed specifically for trading XAUUSD (Gold) on the MetaTrader 4 platform. It executes trades using two complementary strategies , referred to as Strategy 1 and Strategy 2 . Both strategies are built on similar trading principles but differ in execution style, allowing for dynamic and diversified trading behavior. You can configure the EA to run Strategy 1 , Strategy 2 , or both simultaneously , giving traders full flexibility over
FREE

Galactic Imperium EA
An Expert Advisor that places pending orders at a user-defined entry time each day and force-closes all positions at a specified exit time, capturing intraday range breakouts while avoiding overnight exposure. How It Works Entry Scan & Orders At your chosen hour & minute, the EA measures the high/low over a configurable look-back period. It places BuyStop and SellStop orders just beyond that range. Orders are split into multiple equal lots to minimize slippage and spread i
FREE

Having to check constantly if your RSI has reached a specific level can be tedious and draining at times, especially if you have to monitor different asset classes at a time. The Alert RSI indicator will assist in this task, ensuring that you get the most with little effort. When the RSI values get to a specified level, the alerts will go off, on the chart, on the MT4 phone app or via email (You can receive text messages to your phone if you activate texts on your Gmail account). The indicator d
FREE
This EA trades using the Bollinger Bands indicator. It offers many trading behaviors and flexible position management settings, plus many useful features like customizable trading sessions and a martingale mode. [ Installation Guide | Update Guide | Troubleshooting | FAQ | All Products ] Easy to use and supervise Fully customizable indicator settings Customizable break-even, SL, TP and trailing-stop Works for ECN/Non-ECN brokers Works for 2-3-4-5 digit symbols Trading can be NFA/FIFO Compliant
FREE

This masterpiece blends cutting-edge Advance MA, HMA, and Momentum logic into stunning gold star signals, giving you the power to spot market shifts without the guesswork. Perfect for every trader—beginner or expert—this tool turns your XAUUSD charts into a goldmine of opportunity. Don’t just trade—thrive!
Why You’ll Love It
Crystal-Clear Signals : Gold star alerts highlight key market moments, guiding your decisions with ease. Smart Moving Average : Pair with the Advance MA to confidently de
FREE
이 EA는 ADX(Average Directional Index) 지표를 사용하여 거래합니다. 다양한 진입 전략과 유연한 위치 관리 설정, 맞춤형 거래 세션 및 마틴게일 모드와 같은 많은 유용한 기능을 제공합니다. [ 설치 가이드 | 업데이트 가이드 | 문제 해결 | 자주하는 질문 | 모든 제품 ] 사용 및 감독 용이 4가지 진입 전략을 구현합니다. 맞춤형 손익분기점, SL, TP 및 후행 정지 ECN/비 ECN 중개인을 위한 작업 2-3-4-5 자리 기호에 대해 작동 거래는 NFA/FIFO를 준수할 수 있습니다. 마틴게일 기능 구현 외환 세션별로 거래 필터링 내장된 자금 관리 사용 가능한 네 가지 진입 전략은 다음과 같으며 독립적으로 활성화하거나 비활성화할 수 있습니다. ADX가 25 이상일 때 거래(+DI/-DI가 방향 결정) ADX에 의해 확인된 트레이드 프랙탈 브레이크아웃(+DI/-DI가 방향을 결정함) +DI/-DI 크로스오버를 ADX 레벨로 거래 거래 +DI/-DI 크로
FREE

Key Features: Custom Image: The script allows you to set any image of your choice as the chart background. The image file should be in the .bmp format and located in the MQL4/Images folder of your MetaTrader 4 data folder. Automatic Replacement: If an image is already set as the chart background, the script will automatically replace it with the new image. How It Works: The script operates in the following manner: Initialization: Upon execution, the script checks if an object named “ i
FREE
트레이딩 전략과 기술 지표를 판매하기에 가장 좋은 장소가 왜 MetaTrader 마켓인지 알고 계십니까? 광고나 소프트웨어 보호가 필요 없고, 지불 문제도 없습니다. 모든 것이 MetaTrader 마켓에서 제공됩니다.
트레이딩 기회를 놓치고 있어요:
- 무료 트레이딩 앱
- 복사용 8,000 이상의 시그널
- 금융 시장 개척을 위한 경제 뉴스
등록
로그인
계정이 없으시면, 가입하십시오
MQL5.com 웹사이트에 로그인을 하기 위해 쿠키를 허용하십시오.
브라우저에서 필요한 설정을 활성화하시지 않으면, 로그인할 수 없습니다.