MetaTrader 4용 Expert Advisor 및 지표 - 38

This expert advisor can enter and exit trades at specific times and on specific weekdays, expressed in GMT Time. It offers weekday selection, trade management settings, a martingale function and money management features. [ Installation Guide | Update Guide | Troubleshooting | FAQ | All Products ] Easy to use and supervise Fully configurable entry and exit times (up to 5 trades)
Enable or disable trading weekdays in inputs
Customizable break-even, stop-loss, take-profit and trailing-stop setting
FREE

Stop Chasing Trends, Start Sniping Reversals: Introducing Stochastic Sniper Are you tired of trading sideways markets or getting caught by false breakouts? The Stochastic Sniper indicator is engineered for precision entry . It combines the volatility channels of Keltner Bands with the momentum timing of the Stochastic Oscillator to pinpoint extreme price reversals with high accuracy. Think of it as having a sniper scope on the market. It waits for the price to stretch to its maximum, confirms t
FREE

BIG CANDLE ALERT https://www.mql5.com/en/users/earobotkk/seller#products P/S: If you like this indicator, please rate it with 5 stars in the review section, this will increase its popularity so that other users will be benefited from using it. This indicator draws a bullish and bearish vertical line inside a candle whenever the size of a candle body exceeds the minimum size specified in the input. INPUT Bullish Candle Color: choose the color of your choice. Bearish Candle Color: choose the co
FREE

The Wave Rider Indicator: Your Key to Confident Trading Tired of trying to guess market movements? The Wave Rider indicator is your solution. It's an intelligent tool designed to help you spot profitable trends with ease and confidence. What makes it so powerful? See Trends Clearly : Wave Rider simplifies complex market data, so you can easily identify the direction of the trend and make smarter decisions. Get Timely Signals : It gives you clear buy and sell signals, helping you pinpoint the be
FREE
Objective: To show on the chart the current pip sizes of ADR, Spread, Bars, Day, Risk Reward and Shift Candle. Inputs: Select in which corner it will be displayed Set the X position of the indicator
Set the Y position of the indicator
Set the Font Style Set the Font Size Set the font color of current and last bar size Set the ADR font color
Set the Spread color
Set the day color
Show/Hide the normal maximum spread on some symbols, suggested risk reward ration and last shift candle size in p
FREE

GTAS FidTdi is a trend indicator using combination of volatility and potential retracement levels. This indicator was created by Bernard Prats Desclaux, proprietary trader and ex-hedge fund manager, founder of E-Winvest.
Description The indicator is represented as a red or green envelope above or under prices.
How to use Trend detecting When the envelope is green, the trend is bullish. When it is red, the trend is bearish.
Trading Once a trade is opened, GTAS FibTdi shows retracement zones wh
FREE
Hello, This indicator is a unique high reliability 7-in-1 multicurrency indicator comprising these sub-indicator’s: A Trend Power Crossover Indicator. A Percent Change Crossover Indicator. A Currency Overbought/Oversold Indicator. A Currency Deviation Indicator. A Currency Impulse Signal Indicator. A Trend Power Indicator. A Currency Volatility Indicator. The main advantage of this indicator is that it's reasoning by currency and not by currency pair. The values of each sub-indicator are calcul
FREE

This is one of the most popular and highly rated volatility index (VIX) indicators on the market. It provides the same readings as the VIX does for stock indexes. However, this indicator works across all asset classes. VIX Fix Finds Market Bottoms. This indicator is not for inexperienced traders. Use it for day and swing trading. MT5 Version - https://www.mql5.com/en/market/product/112284 Join To Learn Market Depth - https://www.mql5.com/en/channels/suvashishfx
Bernard Baruch summed i
FREE
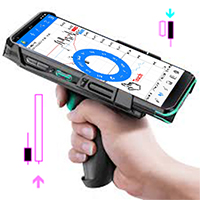
This is an indicator that helps you to scan the whole timeframe then informs you about the last candle position Engulfing Candlestick pattern was formed. The indicator also send alert to your mobile when a new engulfing candle is formed.
For the visual;
1. Green up arrow indicates a bullish engulfing candlestick pattern
2. Red down arrow indicates a bearish engulfing candlestick pattern
FREE

Future prediction is something any trader would love to know, through this simple prediction algorithm can give a picture of the future. This algorithm is based on past data and the average prices of the data to simulate future candles. This is an indicator that will be redrawn. This indicator is completely free, can be used as a trend reference but absolutely do not use for trading.
FREE

Having to check constantly if your RSI has reached a specific level can be tedious and draining at times, especially if you have to monitor different asset classes at a time. The Alert RSI indicator will assist in this task, ensuring that you get the most with little effort. When the RSI values get to a specified level, the alerts will go off, on the chart, on the MT4 phone app or via email (You can receive text messages to your phone if you activate texts on your Gmail account). The indicator d
FREE

DF Fib Trader Pro DF Fib Trader Pro는 MetaTrader 5용으로 설계된 자동 거래 시스템입니다. 피보나치 기반 가격 수준과 추세 및 구조 분석을 결합하여 진입 및 청산 시점을 정의합니다. EA는 롱 포지션과 숏 포지션을 모두 지원하며, 내장된 위험 관리 매개변수를 포함합니다.
핵심 기능: • 피보나치 되돌림 및 확장 로직을 사용하여 진입, 손절매, 이익실현 시점을 표시합니다. • 랏 크기 및 손절매/이익실현 수준 설정 가능 • 진입 시점 1개 또는 2개 선택 가능 • 시장 상황에 따라 고정 또는 동적 손절매 및 이익실현 지원 • 다양한 시간대 및 통화쌍 지원 • 최대 스프레드, 슬리피지, 거래 빈도 제어 옵션 포함 • 자동 거래 관리: 손익분기점, 트레일링 손절매, 부분 청산 옵션 • 원하는 경우 시장가 주문 지원 입력 개요: • 위험 관리: 랏 크기, 거래당 위험, 최대 거래 수 • 진입 조건: 피보나치 레벨 선택, 추세 필터 옵션 • 청산 관리:
FREE
This EA has no stop loss. All risks are at your discretion.
CHIQUITA EA is a fully automatic Expert Advisor for Scalping Trading on XAUUSD timeframe M1. The basic strategy starts with Market order in Trend Following, so this EA Follow the Trend . M1 Trend…. very very fast. MT5 version Recommendations The Expert is programmed to work on XAUUSD M1, but you can use all others timeframes with the appropriate settings. An ECN broker is always recommended A low latency VPS is always r
FREE

Discount 50% for 20 first customers
This Trading System from Scarface Trades. This expert does not use dangerous martingale, grid , have stoploss and tp, recommended to use 1% risk and 1:2 RR Ratio. The best pair is Tesla, i use icmarkets to backtest. It scan the 5 min opening range, and define order block after breakout the opening range, will take position on retest the order block. So far i have backtested only Tesla make a good profit. Use default setting Pair: TESLA TimeFrame: M1
Descri
FREE

What is Macro Kill Boxer? Macro Kill Boxer is a technical analysis indicator developed for the MetaTrader platform. It visualizes market movements during specific time intervals (e.g., Asia, London Open/Close, New York AM/PM) by drawing colored boxes on the chart. Each box represents the high and low price levels within the defined time period, often associated with macroeconomic events or high-volatility sessions. What Does It Do? Time-Based Analysis : Displays price movements as boxes for 58 c
FREE
Shows Kaufman Efficiency Ratio value and smoothed by MA. Calculation is based on movement divided by volatility on a specified period. Levels are adjustable as well as visualization. Parameters: KERPeriod - period for ratio calculation. EMAPeriod - period for moving average. Shift - indicator shift. HigherLevel - low value of the higher zone. LowerLevel - high value of the lower zone. ShowHigherZone - allow higher zone drawing. HigherZoneColor - higher zone color. ShowLowerZone - allow lower zon
FREE

Use GANN 369 to use a combination of 30's,60's,90's time to cross 3's,6's,9's. Any larger combination of these cross smaller combinations of these
Using GANN 369 Method for Trading Reversals The GANN 369 method, inspired by the works of W.D. Gann and Nikola Tesla's 3, 6, 9 numerical patterns, can be employed to identify potential reversals in financial markets. By combining specific periods (30, 60, and 90) with the numbers 3, 6, and 9, traders can seek opportunities for trend changes.
FREE

Bollinger Bands Breakout Alert is a simple indicator that can notify you when the price breaks out of the Bollinger Bands. You just need to set the parameters of the Bollinger Bands and how you want to be notified.
Parameters: Indicator Name - is used for reference to know where the notifications are from Bands Period - is the period to use to calculate the Bollinger Bands Bands Shift - is the shift to use to calculate the Bollinger Bands Bands Deviation - is the deviation to use to calculate t
FREE

Программу можно использовать как советник для ручной и полуавтоматической торговли. Или как индикатор для выявления структуры рынка. В торговой части программы отсутствуют ордера Sell, Buy. А также лимитные и стоповые ордера. Вместо этого на график выводится торговая рамка для сделок на продажу - SELL или на покупку - BUY . У торговой рамки имеются три уровня. Уровень открытия будущего ордера. Уровень стопа и уровень профита. Влево от торговой рамки выводятся три линии. Перемещая данные линии
FREE

Detailed blogpost: https://www.mql5.com/en/blogs/post/766378
Key Features
Adaptive Upper/Lower bands Smooth Center Line Customizable Length (sensitivity) Non-Repainting (only current ongoing bar is updated every "Refresh After Ticks" number of ticks) Multiple Price Sources - Choose from close, open, high, low, median, typical, or weighted close Components:
The Basis Line The smooth center line represents the weighted average of price. Think of this as the "true" price level when all the noise
FREE

Expret: The Ultimate Recovery Zone Strategy Expert Advisor for MT4 Revolutionize Your Trading with Expret Expret is a cutting-edge Expert Advisor (EA) designed for MetaTrader 4, leveraging the powerful Recovery Zone strategy to maximize your trading potential. Whether you're a novice trader or a seasoned professional, Expret offers unparalleled customization and control to adapt to your unique trading style.
Key Features: 1. Advanced Recovery Zone Strategy: Expret employs a sophisticated Recov
FREE

제품 제목 Smart Fractals (MT4) – SmartView 시리즈의 일부 간단한 설명 MetaTrader 플랫폼에서 독특한 사용자 경험을 제공하는 Fractals 지표입니다. 이전에 사용할 수 없었던 고급 기능을 제공하며, 더블 클릭으로 설정 열기, 삭제하지 않고 지표 숨기기/표시하기, 지표 창을 전체 차트 크기로 표시하기 등의 기능을 포함합니다. SmartView Indicators 시리즈의 나머지 부분과 원활하게 작동하도록 설계되었습니다. 개요 SmartView 시리즈는 혁신적인 기능을 통해 MetaTrader 플랫폼의 지표에 독특하고 독특한 사용자 경험을 제공하여 지표 관리를 더 빠르고 쉽게 만듭니다. 각 지표는 차트에 스마트 제어 패널이 장착되어 있어 필수 정보를 표시하고 모든 중요한 기능에 빠르게 액세스할 수 있습니다. 이전에 사용할 수 없었던 고유한 기능 SmartView 시리즈는 지표 작업을 더 쉽고 빠르게 만드는 고급 기능을 제공합니다: 더블 클릭으로 설정
FREE

This channel is based on the Hodrick-Prescott filter, which is a type of zero-lag digital filter. First, filtered Close price values are calculated. Then, a second filtering with a longer period is applied. This results in two arrays: HP and HPSlow. In the next step, the standard deviation of HP relative to HPSlow is computed, and a channel is constructed. The VHP channel PRT indicator displays the average spread value and the channel width relative to HPSlow (expressed as a percentage) at th
FREE

The Trading Sessions indicator is a simple tool that helps to highlight a specific trading session. For example, it can be used to differentiate the European, American or Asian sessions.
Main features The indicator shows a user-defined trading session. Alert notifications for the start and end of the session. Custom session time. Works on every timeframe (M1, M5, M15, M30, H1, H4, D1, W1, MN). Customizable parameters (Colors, alerts...). It can be used for creating EA. Available for MT4 an
FREE
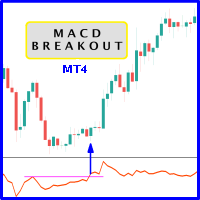
Probability emerges to record higher prices when MACD breaks out oscillator historical resistance level. It's strongly encouraged to confirm price breakout with oscillator breakout since they have comparable effects to price breaking support and resistance levels; surely, short trades will have the same perception. As advantage, many times oscillator breakout precedes price breakout as early alert to upcoming event as illustrated by 2nd & 3rd screenshot. Furthermore, divergence is confirmed
FREE

Moving Average Crossover + RSI EA — 간단하고 신뢰할 수 있는, 정말 잘 작동하는 트렌드 시스템
불필요하게 복잡하지 않은, 단순하고 규칙적이며 효과적인 EA를 찾고 계신가요?
이 EA는 명확한 트렌드 진입, 강력한 확인, 시장 상황에 적응하는 스마트한 리스크 관리를 원하는 트레이더를 위해 만들어졌습니다. MA Crossover + RSI EA는 클래식한 트렌드 추종 전략에 모멘텀 확인을 결합해 고품질 신호와 완전 자동화된 매매를 제공합니다. 이 EA가 선택받는 이유 1️⃣ 깨끗하고 신뢰성 높은 트렌드 진입
사용자 정의 가능한 빠른/느린 MA로 트렌드를 감지. 2️⃣ RSI 확인 = 높은 정확도
RSI > 50일 때만 매수
RSI < 50일 때만 매도 3️⃣ 적응형 리스크 관리
ATR 기반 SL/TP
반대 MA 교차 시 포지션 종료 4️⃣ 완전한 유연성
MA
RSI
ATR
슬리피지
트렌드 종료 필터
고정 로트 또는 % 리스크 전략 작동

Based on famous and useful indicator - Super Trend, we add some features to make this Indicator much easier to use and powerful. Ease to identify the trend of any chart. Suitable for both Scalping & Swing Better to use in the trending market be careful in sideway market, it might provide some fake signals Setting: ATR Multiplier ATR Period ATR Max Bars (Max 10.000) Show UP/DOWN node Nodes size Show Pull-back signals Pull-back filter ratio Period of MA1 Mode of MA1 Period of MA2 Mode of MA2 A
FREE
This EA is a set n forget type. Once attached to GOLD / XAUUSD chart, you can forget it. ========== Broker recommended (EA tuned) > JustMarket (fully tested & optimized) Register using this link & get 50% auto rebate with daily reimbursement > https://one.justmarkets.link/a/6dgco0za1a Change your current IB to me & get 50% auto rebate with daily reimbursement. Visit this link for instructions > https://t.me/ea1234x/1 ========== Leverage recommended > 1:500 TF > H1 (auto set & lock by this EA)
FREE

Mahdad Candle Timer MT4 — Real‑Time Candle Countdown Mahdad Candle Timer is a lightweight and precise MetaTrader 4 indicator that displays the remaining time until the current candle closes, shown directly beside the latest bar. It is designed for traders who rely on accurate timing — whether scalping, day trading, or waiting for candle confirmation in swing setups. Key Features Accurate Countdown – Remaining time in HH:MM:SS (optional milliseconds) Dynamic Placement – Always aligned with th
FREE
Highly configurable Accumulation and Distribution (AD) indicator. Features: Highly customizable alert functions (at levels, crosses, direction changes via email, push, sound, popup) Multi timeframe ability Color customization (at levels, crosses, direction changes) Linear interpolation and histogram mode options Works on strategy tester in multi timeframe mode (at weekend without ticks also) Adjustable Levels Parameters:
Ad Timeframe: You can set the lower/higher timeframes for Ad. Ad Bar Shif
FREE

Overview:
The Coloured Parabolic SAR Indicator is a visually enhanced trading tool designed to make trend-following and trade identification easier. This customizable indicator provides clear visual cues with color-coded signals for bullish (buy) and bearish (sell) trends directly on your MT4 chart. Key Features: Color-Coded Signals : Lime green "o" symbol for Buy signals. Red "o" symbol for Sell signals. Customizable Inputs : Adjustable Step and Maximum parameters to fine-tune the Parabolic SA
FREE

O Touch VWAP é um indicador que permite calcular uma Média Ponderada por Volume (VWAP) apenas apertando a tecla 'w' no seu teclado e após clicando no candle do qual deseja realizar o calculo, clicando abaixo do candle é calculada a VWAP baseado na minima dos preços com o volume, clicando sobre o corpo do candle é calculado uma VWAP sobre o preço medio com o volume e clicando acima do candle é calculado uma VWAP baseado na máxima dos preços com o volume, voce tambem tem a opção de remover a VWAP
FREE

Indotrend is a Smart indicator to detects the Trend and also view support & resistance, multiple timeframe to get validate the trend. it can be use for Forex,Index,Metal,Stock and Crypto. Parameters: Alerts - show popup alert message on Metatrader Hi Lo H1 Timeframe - Show LIne Hi/Low Price base on H1 timeframe Show Fibonaci level - Show Fibonaci retracement level
Show Support Resistance, - Show Support & Resistance H1 timeframe.
FREE

Heiken Ashi Button Heiken-Ashi , often spelled Heikin-Ashi, is a Japanese word that means "Average Bar." The Heiken-Ashi approach can be used in conjunction with candlestick charts to spot market trends and forecast future prices. It's useful for making candlestick charts easier to read and analysing patterns. Traders can use Heiken-Ashi charts to determine when to stay in trades while the trend continues and close trades when the trend reverses. The majority of earnings are made when markets a
FREE

This indicator is designed to detect high probability reversal patterns: Double Tops/Bottoms with fake breakouts . This is the FREE version of the indicator: https://www.mql5.com/en/market/product/26371 The free version works only on EURUSD and GBPUSD! Please read also the blog post " Professional Trading With Double Tops/Bottoms And Divergences! " which explains the concepts behind the ULTIMATE Double Top/Bottom indicator and how you can use a professional top-down approach. The provided video
FREE

You can manually open a trade (one click), and this EA will take care of setting the SL and TP. SL and TP are set based on the number of pips you specify in the input screen. You can also choose monetary SL and TP. SL and TP are determined based on the weighted average price (WAP), so if you open a new trade, SL and TP will be updated according to the new WAP. The WAP is not unique but differentiated between buy and sell trades (this is useful only if you open opposite trades on the same chart)
FREE

Xray EA의 특징과 이점
1. 두 통화 쌍의 관계를 이용한 독자적인 거래 방법
Xray EA는 EURUSD와 GBPUSD의 관계를 활용하여 다음과 같은 이점을 제공합니다.
위험 분산 : 다른 통화 쌍의 움직임으로 인해 하나가 손실 되더라도 다른 쪽이 이익을 내어 위험을 분산합니다.
시장 적응성 : 시장 변동에 신속하게 대응하고 안정적인 거래를 실현.
다양한 전략 선택 : 다른 통화 쌍을 이용하여 다양한 거래 전략이 가능.
2. 트렌드 읽기 기능
시세 트렌드를 자동으로 분석하여 최적의 거래를 수행합니다.
TP/SL의 자동 조정: 트렌드나 시세의 상황에 따라 적절한 이익·손절 포인트를 설정.
내부 로직의 동적 변경: 시장의 움직임에 따라 거래 로직을 실시간으로 변경.
위험 최소화 및 이익 극대화: 시장 변동에 신속하게 대응하고 안정적인 수익을 목표로 합니다.
3. 자동 변속 마틴
로트 크기를 시장의 움직임에 따라 조정하여 손실을 최소화하면서 이익을 극대화

Link several charts to each other to create a chartgroup. Used for rapid analysis of markets/symbols on multiple timeframes. ChartGroup is implemented as a MetaTrader indicator. When the indicator is applied to several charts they share either the same Symbol or Timeframe, depending on the setting of the single Input-Parameter "mode". You can create one group sharing the same symbol and one group sharing the same timeframe/period at one point in time. The number of charts for a group is not limi

Hello, I need reviews from you guys. Thank you Fractal Swing Detector Pro Indicator is designed to help traders identify key swing points in the market . By combining fractal an d pivot analysis, this indicator provides deeper insights into price movements an d potential reversals. Key Features: Fractal Analysis: Identify high and low fractals with the option to use either 3 or 5 bar fractals . Fractals help detect minor reversal points within trends. Pivot Points: Advance d pivot
FREE
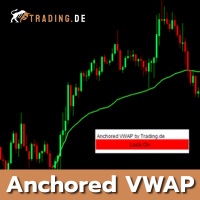
With the Anchored VWAP for MT4 from Trading.de, you can easily calculate and display the volume-based average price starting from a specific point in the chart (anchor). The indicator is ideal for our Trading.de 1-minute chart strategy, but can also be used in all other timeframes. The AVWAP for MetaTrader 4 is calculated using volume or an average period. In the settings, you can specify whether or not to use real trading volume. The indicator also has a "Lock" button in the upper right corner

This trading system is based on mathematical probability. In this case, 5 consecutive candles are compared with each other. For a logical comparison, consider these 5 candles as 1 candle on the M5 timeframe. Therefore, the comparison begins with the opening of a candle on the M5 timeframe. The probability of a match is 50% in the 1st candle, 25% in the 2nd candle, 12.5% in the 3rd candle, 6.25% in the 4th candle, 3.125% in the 5th candle. Thus, the 5th candle has a probability of matching in 1
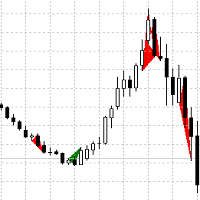
A trend indicator based on the definition of several types of candle combinations, the triangle formed is colored with the corresponding color, the red trend is down, the green one is up. Candlestick combinations of standard and non-standard types with additional conditions for their definition. The recommended timeframe is M30,H1,H4, D1. When combined with other trend indicators, it will provide more accurate points of entry and exit from the market (buying and selling).

High-frequency trend-following stable logic Xquant EA is a trend-following specialized for high-frequency trading, and reduces unrealized losses by quickly settling positions while holding them. Trend-following logic: Optimizes buy and sell positions according to market trends. Xquant EA employs an algorithm based on past price fluctuations.
Spread filter: If the spread exceeds a certain range, it suppresses new orders and reduces trading costs. High-frequency trading: Take advantage of many tr

This is a self-explanatory indicator - do nothing when the current price in the "fence" (flat) mode. Definition of a flat market: A market price that is neither Up nor Down. The input parameter counted_bars determines on how many bars the indicator's lines will be visible starting from the current Bar backward. The input parameter barsNum is used as a Period for aqua "fence" calculation.
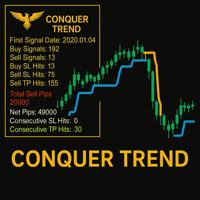
Conquer Trend – Master the Trend Like Never Before! Conquer Trend is your ultimate solution for dominating the markets with precision and simplicity. Built for traders who want to ride the strongest trends across any pair and any time frame, this powerful indicator brings together trend detection, retest confirmation, and performance tracking — all in one streamlined tool.
Multi-Timeframe Trend Analysis Get a clear view of the trend across multiple timeframes. Whether you're scalping, day tra

**Price Action Gold Trader** is a sophisticated, non-repainting multi-timeframe Price Action analysis indicator specifically designed for **XAUUSD (Gold)** trading on MetaTrader 4. This professional-grade tool automatically detects Price Action patterns, provides structured entry zones, precise stop-loss levels, dynamic take-profit targets, and comprehensive market state diagnostics.
Built with systematic trading in mind, this indicator transforms complex Price Action analysis into a fully aut
Scalping Strategy Trend detection is one of the basic challenges of every trader. Finding a way to tell when to enter a trade is very important, timing is a game changer, not too early and not too late. Sometimes, due to not knowing the market conditions, the trader closes his positions with a small profit or allows the losses to grow, these are the mistakes that novice traders make. Indicator Trend Whipper is a complete trading strategy and can improve the trader's trading process. The trend de

Any and all liability for risks resulting from investment transactions or other asset dispositions carried out by the customer based on information received or market analysis is expressly excluded by Tradeciety. All the information made available here is generally provided to serve as an example only, without obligation, and without specific recommendations for action. It does not constitute and cannot replace investment advice. We, therefore, recommend that you contact your personal financial
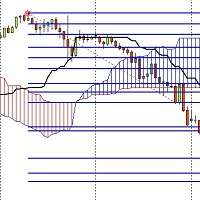
I have developed an indicator based on both the fibo musang strategy and the price breaking of the ichimoku cloud and it has amazing results
the features are:
1- Once activated it give you the trend where you are from the chart
2- After a trend change it gives you an alert on PC or notification on your phone if you are away.
3- It sends you the exact prices to take an order and 3 take profit levels and your stoploss.
4- It works on every timeframes from 1m to MN.
5- It works on pairs and C

This EA helps to Close all Positions opened. It saves you the time of closing multiple positions manually.
Parameters: Buy: Close Buy Positions Only Sell: Close Sell Positions Only Buy & Sell: Close Buy & Sell Positions Pending: Close Pending Orders
More Advanced MT4 version available at: https://www.mql5.com/en/market/product/93468?source=Unknown%3Ahttps%3A%2F%2Fwww.mql5.com%2Fen%2Fmarket%2Fmy More Advanced MT5 version available at: https://www.mql5.com/en/market/product/93301?source=Unk

A useful scanner/dashboard that shows the RSI values for multiple symbols and time-frames.
It can be easily hidden/displayed with a simple click on the scanner man top left of the dashboard.
You can input upper and lower RSI values and the colours can be set to show when above/below these values. The default values are 70 and 30. There are also input colours for when the RSI is above or below 50 (but not exceeding the upper/lower levels
Symbols and time-frames are input separated by commas.

This EA is configured to trade after London market open and all defined time ranges. This is one of the most popular strategies that every serious trader should know well. The "London Breakout Trader" EA is a trully flexible system that will allow you nearly everything to get configured from hard SL TP Trailing SL with Trailing Step, Range size fileter, Auto Parameters based on range size and all you need to set it to work for you. This EA is even more you can configure trading days hours and ra

Indicator Help to Show About CCI Multi Timeframe. ( 1M , 5M , 15M , 30M , 1Hr, 4Hr, 1D)
You can change period as you want.
CCI indicator
The commodity channel index (CCI) is an oscillator indicator that helps show when an asset has been overbought or oversold.It helps you identify peaks or troughs in an asset's price and can indicate the weakening or end of a trend and a change in direction.This means a you can, in theory, enter a trade right as a trend is beginning, or exit an existing trade

Based on TheStrat by Rob Smith (@robintheblack) #thestrat , which is a trading method that Rob has developed over a 30 year career in the market. This is TheStrat Timeframe Continuity scanner that allows you to constantly scan either the Stocks, Currency pairs, indices or commodities that you want to watch. The time frames that you can watch can be (Year, Quarter, Month, Week, Day, H4, H1, 15M and smaller if you feel like it). It tells what the current candle is doing. It is either inside b
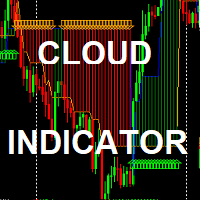
The Simple Cloud Indicator : (FREE limited time for evaluation) Strategy: Strategy is based on moving averages indicator in addition to support /resistance levels crossing *It works on any timeframe *it works on any symbols *it generates alerts *it draws uptrend / Downtrend clouds and BUY/SELL arrows inputs : *drawn start point ( in bars): not affecting strategy - it just gives you indicator history depth *alerting enable/disable

This EA will open buy or sell orders depending on any buffer indicator just but Buy buffer and sell buffer there is a lot of settings in EA like take profit stop loss trailing stop duration time auto lot double lot required profit dollars to close close it reverse
and more you can download demo version and try it back test
Good luck -------------------------------------------------------------- السلام عليكم هذا الاكسبيرت سيفتح شراء او بيع اعتمادًا على اي مؤشر بفر الاكسبيرت يحتوي على الكثير م

Search for an entry with low risk for trading by Lisek Waves Indicator. Using Lisek Waves Indicator can improve your trading performance. In it’s simplest form, this trading tool make it easy to s earch for an entry with low risk and to manage your trade and risk. Lisek Wave analysis is based on the notion that markets follow specific patterns called waves which are the result of a natural rhythm of crowd psychology that exists in all markets. You can avoid the loss from taking trades that are
FREE
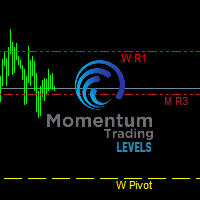
Momentum Trading Levels MT4 Indicator: - Dynamic Monthly-Weekly-Daily Support And Resistance Pivot System - Helps Locate Institutional Liquidity Levels And Forecast Price - Allows Trader To See Monthly Weekly Daily Levels On All Time Frames - Helps Locate Monthly Weekly Daily Extremes And Confluence - "Sunday Data" Feature Allows Accurate Monthly Weekly Daily Data With Minimum Discrepancies - Helps Pinpoint Optimal Entries And Exits - Ideal For Navigating Mid-Week Reversal Patterns - Premium A

Hello You can copy orders between terminals for any computer via Internet (MT4 to MT4) or (MT4 to MT5) or (MT5 to MT4) or (MT5 to MT5)
it's fast Open orders Modification Stop Loss and Take Profit Close Orders This is EA (slave) put it in Experts folder you must buy (Copy orders for any computer via Internet Master) EA too from this link if you want to copy from MT4
https://www.mql5.com/en/market/product/55096 if you want to copy from MT5
https://www.mql5.com/en/market/product/56397
Please w

Power Renko is an indicator which plots Renko bricks underneath the chart using a histogram. You can select the brick size and the timeframe of the Renko bricks as well as whether or not to use the close price or the high/low price of the candles. Renko bricks are based on price alone, not time, therefor the Renko bricks will not be aligned with the chart's time. They are extremely useful for trend trading and many different strategies can be formed from them. Buffers are provided allowing you t
The advantage of using this EA This EA directly updates takeprofit and stop losses that are still empty in a manual order
Parameters Multiplier: Multiplier value of the previous transaction Distance: Distance hedging from the previous order Takeprofit: take profit taken from the last price + the value of this column
We recommend that you do not add more than one manual transaction in the same pair martingale hedging | manual hedging | hedging manual | hedging lot | best robot | best ea

The indicator show Higher timeframe candles for ICT technical analisys Higher time frames reduce the 'noise' inherent in lower time frames, providing a clearer, more accurate picture of the market's movements.
By examining higher time frames, you can better identify trends, reversals, and key areas of support and resistance.
The Higher Time Frame Candles indicator overlays higher time frame data directly onto your current chart.
You can easily specify the higher time frame candles you'd li

Tick Speed Pro povides a charted record of tick speed to allow you to see the ebb and flow of market activity. Observing patterns in tick speed may allow you to better time entries to reduce slippage and re-quotes.
The tick speed plot updates it's entire position to show you only the last N seconds you choose, ideal for scalping and HFT approaches. An alert is provided to signal when the instrument is getting ticks at a higher rate than the alert limit. Multiple loadings are supported to compare

Overview RetraceX Scalper is an advanced pullback scalping bot that utilizes Support & Resistance levels to identify high-probability retracement entries. It ensures precise trade execution with minimal risk and maximum reward, making it an ideal tool for traders who focus on quick pullback opportunities.
Key Features Support & Resistance Detection: Identifies strong market zones for accurate trade setups. Pullback Entry Optimization: Scans for high-probability retracement entries to maximize

MACD is probably one of the most popular technical indicators out there. When the market is trending, it actually does a pretty good job, but when the market starts consolidating and moving sideways, the MACD performs not so well. SX Impulse MACD for MT5 is available here . Impulse MACD is a modified version of MACD that works very well for trading Forex, stocks, and cryptocurrencies. It has its own unique feature which perfectly filters out the values in a moving average range and enables it t

Why the RSI Alert Indicator is Essential for Your Trading Toolkit
In the fast-paced world of trading, timely and accurate information is crucial. The RSI Alert Indicator is a powerful tool designed to help you stay ahead of the market by providing real-time alerts when the Relative Strength Index (RSI) reaches critical levels. Whether you're a novice trader or a seasoned professional, this indicator can significantly enhance your trading strategy by pinpointing potential market reversals with

Mathematical Hedging - Trade like a Bank !
The strategy rule is to create a pending order instead of the Stop Loss with a bigger lot size then the first trade on the level where the Stop Loss might occur.
Below a strictly theoretical example (without taking into consideration the real settings of the EA) The position is placed according to the trend on D1 chart of an instrument.
If we consider that we have LONG position on GOLD from the price 1488.00 with Take Profit 1500 and Stop

Gioteen Volatility Index (GVI) - your ultimate solution to overcoming market unpredictability and maximizing trading opportunities. This revolutionary indicator helps you in lowering your losing trades due to choppy market movements. The GVI is designed to measure market volatility, providing you with valuable insights to identify the most favorable trading prospects. Its intuitive interface consists of a dynamic red line representing the volatility index, accompanied by blue line that indicat
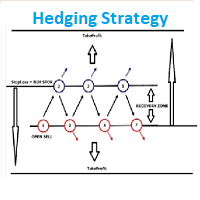
EA Hedging Strategy Is a high class automated expert advisor which is fully optimized for the future market in EURUSD etc. M5. No Loss forex Hedging Strategy and work with the open orders and open position orders to get opportunities to enter and exit trading.
ADVANTAGES: Advanced market entry filter. Automatic Money manager. High spread protection. Slip Protection. Does not use indicator.
Trailing stop and Take Profit.
No need for optimization.
RECOMMENDATIONS: leverage: 1:500!, working
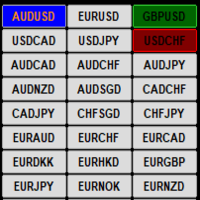
This indicator display current profit/loss status for each pair visually on a single chart. If the current open chart pair is selected and a trade/s are opened for that pair only the Symbol name is highlighted and the button color reflects the current trade/s status if the selected chart pair does not have any open trades then the button color is Blue. The input options are :
1/ Select Pairs automatically from the Market Watch
2/ Manually select your own Pairs
3/ Select all MT4 Timeframes aut
MetaTrader 마켓은 개발자들이 거래 애플리케이션을 판매할 수 있는 간단하고 편리한 사이트이다.
제품을 게시하고 마켓용 제품 설명을 어떻게 준비하는가를 설명하는 데 도움이 됩니다. 마켓의 모든 애플리케이션은 암호화로 보호되며 구매자의 컴퓨터에서만 실행할 수 있습니다. 불법 복제는 불가능합니다.
트레이딩 기회를 놓치고 있어요:
- 무료 트레이딩 앱
- 복사용 8,000 이상의 시그널
- 금융 시장 개척을 위한 경제 뉴스
등록
로그인
계정이 없으시면, 가입하십시오
MQL5.com 웹사이트에 로그인을 하기 위해 쿠키를 허용하십시오.
브라우저에서 필요한 설정을 활성화하시지 않으면, 로그인할 수 없습니다.