 MetaTrader 5
 Experts
 지표
 라이브러리
 유틸리티
 위젯
 규칙
MetaTrader 4용 새 Expert Advisor 및 지표 - 195
 트레이딩 로봇은 자동으로 시장거래를 수행하는 반면 지표는 가격을 더 잘 분석하고 가격 행동을 예측할 수 있게 해줍니다.
이러한 어플리케이션을 사용하면 MetaTrader 4에서 더 많은 기회를 포착하는 동시에 보다 정보에 입각한 방식으로 거래를 수행할 수 있습니다.

Day Trader Master 는 데이 트레이더를 위한 완벽한 거래 시스템입니다. 시스템은 두 개의 지표로 구성됩니다. 하나의 지표는 매수 및 매도를 위한 화살표 신호입니다. 얻을 수 있는 화살표 표시기입니다. 2차 지표를 무료로 드립니다. 두 번째 지표는 이러한 화살표와 함께 사용하도록 특별히 설계된 추세 지표입니다. 표시기는 반복하지 않고 늦지 않습니다! 이 시스템을 사용하는 것은 매우 간단합니다. 2색 선으로 표시되는 현재 추세 방향의 화살표 신호를 따라가기만 하면 됩니다. 파란색은 구매 추세입니다. 빨간색은 판매 추세입니다. 파란색 화살표는 매수 신호입니다. 빨간색 화살표는 매도 신호입니다. 추세선의 색상과 일치하려면 화살표의 색상과 신호의 방향이 필요합니다. 화살표 표시기는 주로 시간 간격 M5 및 M15에서 일중 거래를 위해 만들어졌습니다. 그러나 기술적으로 시스템은 다른 시간 간격으로 사용할 수 있습니다. 표시기에는 PUSH 메시지 기능이 있는 팝업 경고가 장착되어 있

KT Auto SL TP EA는 모든 수동 거래에 손절매(스탑로스)와 이익실현(테이크프로핏)을 추가하고, 이후 손절매를 본전으로 옮긴 뒤 트레일링합니다. 컴퓨터나 휴대폰에서 거래를 여세요. 잠시 후 손절매와 이익실현이 설정되고, 차트의 라벨에 현재 사용 중인 설정이 정확히 표시됩니다. 이 EA는 스스로 거래를 열거나 닫지 않습니다. 주요 기능 시장가 거래와 대기 주문에 손절매와 이익실현을 추가합니다. 차트 종목만 관리하거나, 하나의 차트에서 모든 종목을 관리할 수 있습니다. 수동 거래만 관리하며 다른 EA의 거래는 건드리지 않습니다. 새 틱이 들어올 때만이 아니라 초당 약 7회 거래를 확인합니다. 대기 주문의 레벨은 주문 가격을 기준으로 설정되므로, 주문이 체결되는 순간 보호가 준비되어 있습니다. 브로커의 최소 스탑 레벨보다 작은 거리는 그 최솟값까지 넓힙니다. 본전(브레이크이븐)과 트레일링 스탑 거래가 설정한 수익에 도달하면 EA가 손절매를 진입 가격으로 옮깁니다. 선택 사항인 오

KT Coppock Curve는 평활화된 모멘텀 값을 시장 방향을 보기 쉬운 형태로 보여 줍니다. 가격 차트 아래의 별도 창에 표시되며, 제로 라인이 가장 중요한 기준이 됩니다. 곡선의 작은 변화마다 반응하는 대신 모멘텀이 상승 쪽에 있는지 하락 쪽에 있는지를 빠르게 확인할 수 있습니다. 이 곡선은 장기와 단기의 변화율을 결합한 뒤 결과를 평활화합니다. 따라서 빠른 오실레이터에서 자주 나타나는 노이즈를 어느 정도 줄이면서 더 큰 모멘텀 변화를 추적하는 데 유용합니다. 먼저 위치를 보고 그다음 교차를 확인하세요 곡선이 제로 위에 있으면 양의 모멘텀이 우세합니다. 제로 아래에 있으면 음의 모멘텀이 우세합니다. 곡선이 제로 라인의 한쪽에 계속 머무르면 캔들 하나마다 관점을 바꾸지 않고 현재의 방향 압력에 맞춰 거래하는 데 도움이 됩니다. 제로 라인을 위로 돌파하면 위쪽 화살표가 표시되고, 아래로 돌파하면 아래쪽 화살표가 표시됩니다. 정확한 교차 지점을 눈으로 판단하지 않아도 새로운 모멘텀
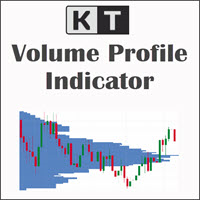
KT Volume Profile은 사용자가 선택한 차트 구간에서 거래 활동이 어느 가격대에 집중되었는지 보여 줍니다. 분석할 움직임 위에 사각형을 놓고 왼쪽 또는 오른쪽 경계를 드래그하면 됩니다. 프로파일이 즉시 다시 계산되고 선택한 가격 범위에 가로 히스토그램이 표시됩니다. 중요한 차트 구간을 직접 선택하세요 고정된 세션이나 조회 기간에 얽매이지 않습니다. 이동 가능한 박스로 추세의 한 구간, 횡보, 돌파 전 베이스, 뉴스 움직임 또는 비교하고 싶은 다른 구간을 따로 분석할 수 있습니다. 박스를 늘리거나 줄이면 프로파일도 업데이트되므로 움직임이 진행되는 동안 시장 참여가 어떻게 변했는지 쉽게 확인할 수 있습니다. 시간뿐 아니라 가격별 거래량을 읽으세요 긴 히스토그램 막대는 박스 안에서 거래량이 더 많이 누적된 가격대를 나타내고, 짧은 막대는 활동이 적었던 구간을 보여 줍니다. 시장이 어느 가격에서 더 많은 거래를 소화했고 어느 구간을 빠르게 통과했는지 실용적으로 파악할 수 있습니다

지표는 여러 쌍의 스프레드를 동시에 모니터링하는 스프레드 스크리너를 제공하며 캔들 타이머 카운트다운은 현재 막대가 닫히고 새로운 막대가 형성되기까지 남은 시간을 표시합니다.
기간 한정 제공: 당사의 모든 프리미엄 지표는 단 50$에 제공됩니다. MQL5 블로그에 액세스하면 프리미엄 지표에 대한 모든 세부 정보를 찾을 수 있습니다. 여기를 클릭하세요.
주요 특징들 동시에 확산되는 다중 쌍을 모니터링합니다. 현지 시간이 아닌 서버 시간을 추적합니다. 구성 가능한 텍스트 색상 및 글꼴 크기 CPU 사용량을 줄이기 위해 최적화 개인화 된 쌍 목록.
연락하다 질문이 있거나 도움이 필요하면 비공개 메시지를 통해 저에게 연락하십시오.
경고 경고 모든 지표와 도구는 공식 Metatrader Store( MQL5 Market )를 통해서만 사용할 수 있습니다.
작가 SAYADI ACHREF, 핀테크 소프트웨어 엔지니어이자 Finansya의 설립자
FREE

Expert Advisor는 여러 상품을 거래하여 추세 반전을 감지하도록 설계되었습니다.
여기에 사용된 알고리즘은 시장의 모든 주요 기호에서 신경망을 기반으로 추세를 정확하게 감지하고 진입 및 퇴장 신호를 생성합니다.
Expert Advisor는 공격적인 관리와 거래 방식을 가지고 있어 단기간에 큰 수익을 얻을 수 있습니다.
설정은 $ 1000의 최소 보증금을 위해 설계되었습니다.. $ 선호 금액 2500
거래 기간은 M15 / H1 / H4 / D1입니다.
• 최소 보증금 1000 $(거래 쌍당)
• 최소한의 미끄러짐을 가진 브로커.
• 모든 유형의 계정
• 레버리지 1: 100 이상
• 설정 및 사용이 매우 간편함
Expert Advisor는 여러 상품을 거래하여 추세 반전을 감지하도록 설계되었습니다.
여기에 사용된 알고리즘은 시장의 모든 주요 기호에서 신경망을 기반으로 추세를 정확하게 감지하고 진입 및 퇴장 신호를 생성합니다.
Expert Ad
FREE
이중 라인 신호, 제로 레벨 시스템, 멀티 타임프레임 지원, 사용자 지정 시각적 신호 및 고도로 구성 가능한 알림 시스템을 갖춘 고급 상대 활력 지수(RVI) 지표.
프리랜서 프로그래밍 서비스, 업데이트 및 기타 TrueTL 제품은 제 MQL5 프로필 에서 이용 가능합니다.
피드백과 리뷰는 매우 감사히 받겠습니다!
상대 활력 지수(RVI)란? 상대 활력 지수(RVI)는 John Ehlers가 개발한 모멘텀 오실레이터로, 거래 범위로 정규화하여 시가 대비 종가의 상대적 관계를 비교함으로써 최근 가격 움직임의 확신도를 측정합니다. 기본 원리는 강세 시장에서는 종가가 시가보다 높아지는 경향이 있고, 약세 시장에서는 반대가 성립한다는 것입니다. RVI는 제로 라인 주위를 진동합니다 — 양수 값은 강세 모멘텀을, 음수 값은 약세 모멘텀을 나타냅니다. 지표는 두 개의 라인으로 구성됩니다: 메인 라인(RVI 값)과 시그널 라인(메인 라인의 4봉 대칭 가중 이동 평균). 두 라인 간의 교차는
FREE
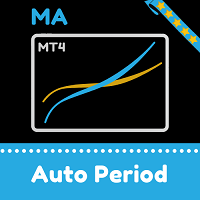
이동 평균은 이동 중에 변경됩니다. 표시기는 이동 평균을 계산할 기간을 자동으로 선택합니다. 움직임이 방향성 일수록 평균화 기간이 길어집니다. 추세가 느려지면 이동 평균의 기간이 감소하고 더 빨라집니다. 이를 통해 추세 변화에 더 빨리 반응 할 수 있습니다.
표시기는 추세 또는 추세 반전 지점에서 잘 작동합니다. 옆 방향으로 표시기는 다른 방법으로 사용할 수 있습니다(예:빠르게 움직이는 표시기가 느린 표시기를 위쪽으로 교차 할 때).이 신호는 판매 신호입니다. 또는 채널을 사용하여 대략적인 구매 또는 판매 영역을 결정할 수 있습니다. 설정에서 채널 표시를 활성화 할 수 있습니다.
매개 변수:
자동 계산을위한 막대-이 막대 수에 대해 표시기는 극단을 찾고 마지막 극단의 시간에 따라 이동 평균의 기간을 계산합니다.
승수-이동 평균의 차이를 설정합니다.
속도-이동 평균의 전환 속도를 한 기간에서 다른 기간으로 변경합니다.
채널-채널 표시를 활성화 또는 비활성화합니다.
인
FREE

이 응용 프로그램은 다른 계정 또는 다른 계정을 복사 할 수 있습니다. Demo-version can be downloaded here .
당신은 어떤 조합에서 그물 및 위험 회피 계정 사이의 위치를 복사 할 수 있습니다. 당신은 악기의 이름과 복사 할 위치의 매직 넘버에 의해 필터를 설정할 수 있습니다. 지금까지 소스는 시장 위치에 대한 정보 만 보냅니다. 보류중인 주문은 공개 시장 위치로 전환 할 때 처리됩니다.
한 터미널에서 고문은 보낸 사람 모드(보낸 사람),다른 하나는 수신기 모드(수신기)에서 시작됩니다.
터미널은 데이터를 교환하는 동일한 공유 데이터 폴더를 갖도록 동일한 서버에서 작동해야 합니다.
설치 절차
보낸 사람 계정의 터미널에서,우리는 일반 매개 변수를 구성,보낸 사람 모드에서 고문을 시작합니다. 수신기 계정의 터미널에서 우리는 수신기 모드에서 고문을 시작하고 수신기에 대한 일반 매개 변수 및 매개 변수를 구성합니다.
이 제품을 보낸 사람으로 사

지금 어느 외환 세션에서 거래하고 있는지, 그리고 각 세션이 몇 pips 움직였는지 MetaTrader 4 차트에서 바로 확인하세요. KT Forex Sessions MT4는 도쿄, 런던, 뉴욕 세션을 색깔 박스로 그리고, 각 세션의 크기를 pips로 해당 박스 위에 적어 주는 세션 지표입니다. 지표가 브로커의 GMT 오프셋을 스스로 읽고, 각 세션은 해당 도시의 현지 시간과 서머타임을 따릅니다. 박스는 일 년 내내 올바른 위치에 있으며, 설정할 것이 없습니다. 차트에서 보이는 것 모든 박스 위의 pips: 거래하는 모든 통화쌍에서 조용한 세션과 활발한 세션을 한눈에 구별할 수 있습니다. 시간대 환산이 필요 없음: 찾아볼 GMT 오프셋도 없고, 봄과 가을에 시계가 바뀔 때 바꿀 것도 없습니다. 겹치는 시간은 별도의 박스로: 런던과 뉴욕이 동시에 열려 있는 시간에는 별도의 보라색 박스가 있습니다. 열려 있는 세션은 실시간으로 커짐: 세션이 끝날 때까지 박스가 새로운 고점과 저점을 따라
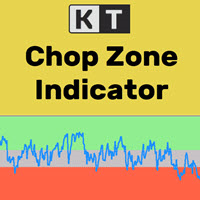
금융 시장은 약 30%의 시간 동안에만 뚜렷한 추세를 형성하고, 나머지 70%의 시간 동안은 횡보 구간에서 움직이는 것이 잘 알려진 사실입니다. 그러나 대부분의 초보 트레이더는 시장이 현재 추세 중인지, 아니면 박스권(횡보) 상태인지 판단하기 어렵습니다. KT Chop Zone은 이러한 문제를 해결해줍니다. 시장의 상태를 시각적으로 세 가지 구역으로 나누어 표시합니다: 하락 구간, 상승 구간, 그리고 Chop Zone (횡보 구간)입니다.
기능
횡보장에서의 거래를 피함으로써 즉시 거래 품질을 향상시킬 수 있습니다. 출구 신호로도 사용할 수 있습니다. 예를 들어, 매수 포지션이 Chop Zone에 진입하면 포지션을 정리할 수 있습니다. 전문가용 자동매매(EA)와 완벽하게 호환됩니다. EA에 쉽게 추가하여 전략을 개선할 수 있습니다. 모든 MetaTrader 알림 기능이 포함되어 있습니다.
입력 파라미터 메인 기간: 오실레이터에 사용하는 정수 값입니다. 권장 값은 10에서 30 사
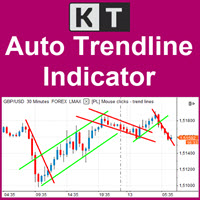
중요한 추세선을 차트에서 자동으로 업데이트 KT Auto Trendline은 최근 ZigZag 스윙 포인트를 바탕으로 상단과 하단 추세선을 자동으로 만들고 현재 차트의 미래 방향으로 두 선을 연장합니다. 같은 선을 반복해서 직접 그리지 않아도 형성 중인 돌파, 반응, 가격 방향 변화를 명확한 구조로 살펴볼 수 있습니다. 가까운 구조와 더 넓은 스윙을 함께 확인 첫 번째 추세선 세트는 기본으로 활성화되며 반응성이 높은 ZigZag 설정을 사용합니다. 더 넓은 시야가 필요하면 두 번째 세트를 켜서 별도의 민감도를 가진 상단 및 하단 추세선 한 쌍을 추가할 수 있습니다. 한 차트에서 가까운 가격 구조와 더 큰 시장 스윙을 비교하기 좋습니다. 각 추세선 세트의 반응 방식 조절 Show First Trendline: 기본 상단 및 하단 연장 추세선을 표시하거나 숨깁니다. Depth, Deviation, Back Step: 첫 번째 ZigZag 세트가 스윙 포인트를 찾는 방식을 조절합니다. S

ROC는 현재 가격이 이전 기간에 비해 얼마나 빠르게 변했는지를 측정합니다. 따라서 가격이 새로운 스윙 고점이나 저점을 만들었지만 그 움직임을 뒷받침하는 모멘텀이 따라오지 않을 때 특히 유용합니다. KT ROC Divergence는 이런 불일치를 자동으로 찾아 가격 차트와 ROC 창에 서로 대응하는 선을 표시합니다. 고정된 범위 안에서 움직이는 오실레이터와 달리 ROC는 시장의 속도에 따라 값의 폭이 커지거나 작아집니다. 서로 다른 종목의 절대 수치를 비교할 필요는 없습니다. 중요한 정보는 가격 스윙과 오실레이터 스윙 사이의 관계입니다. 트레이더의 언어로 보는 네 가지 패턴 일반 상승 다이버전스: 가격은 더 낮은 저점을 만들지만 ROC는 더 높은 저점을 만듭니다. 가격이 더 내려갔더라도 매도 모멘텀이 약해지고 있을 수 있습니다. 일반 하락 다이버전스: 가격은 더 높은 고점을 만들지만 ROC는 더 낮은 고점을 만듭니다. 가격이 여전히 오르는 동안 매수 모멘텀이 약해지고 있을 수 있습니

A unique Expert Advisor for processing reverse price divergence. The EA determines both trend direction and reversal patterns using reverse divergence. Divergence is the strongest signal of indicator analysis. Its essence lies in the formation of a new extremum in the price in the direction of the dominant trend if this extremum is not updated in the indicator. The price continues to move along the trend, while the indicator says that the trend has weakened and continues to move only by inertia,
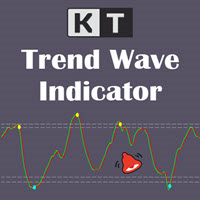
시장 흐름과 함께 Trend Wave 교차 확인 KT Trend Wave는 가격 움직임을 메인 웨이브와 부드러운 신호선으로 구성된 집중형 오실레이터로 보여 줍니다. 가격 차트 아래의 별도 창에 표시되므로 캔들을 가리지 않고 웨이브, 기준 영역 및 교차 마커를 선명하게 확인할 수 있습니다. 선, 영역 및 마커를 함께 해석 연두색 메인선: 더 빠르게 반응하는 추세 웨이브를 보여 줍니다. 빨간색 신호선: 웨이브를 부드럽게 만들어 방향 변화를 쉽게 비교할 수 있게 합니다. 하늘색 상승 마커: 하단 기준 영역에서 메인선이 신호선 위로 교차하는 강세 움직임을 표시합니다. 노란색 하락 마커: 상단 기준 영역에서 메인선이 신호선 아래로 교차하는 약세 움직임을 표시합니다. 차트를 복잡하게 만들지 않고 반응 조절 Wave Period는 메인 웨이브의 가격 반응을 조절하고 Avg. Period는 적용되는 평활화를 조절하며 History Bars는 처리할 과거 봉의 수를 제한합니다. 이 설정으로 긴 기술
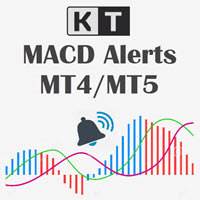
명확한 MACD 모멘텀 신호 KT MACD Alerts는 깔끔한 색상 구분 MACD 화면을 통해 시장 방향과 모멘텀의 변화를 쉽게 파악할 수 있도록 도와줍니다. 상승 및 하락 교차를 명확하게 확인할 수 있으며, 차트의 수직선과 유연한 알림 기능이 새로운 신호에 빠르게 주목할 수 있도록 지원합니다. 신호는 캔들이 마감된 후 확정되므로 차트 전반의 MACD 모멘텀 변화를 명확하고 일관되게 확인할 수 있습니다. 상승 및 하락 상태를 색상으로 구분한 MACD 표시. 교차 신호를 빠르게 찾을 수 있는 선명한 수직선. 조정 가능한 MACD 기간과 적용 가격. 선 색상, 굵기, 스타일 및 차트 확장 설정 지원. 9개 시간대 MACD 스캐너 내장 대시보드는 현재 차트 종목의 MACD 방향을 M1, M5, M15, M30, H1, H4, D1, W1, MN1의 9개 시간대에서 보여줍니다. 각 행은 최신 확정 데이터를 사용해 Bullish, Bearish 또는 Neutral을 표시하므로 단기 모멘텀과

KT Heiken Ashi Alert는 표준 Heiken Ashi 캔들에 기반하여 매수 및 매도 화살표를 표시하고 다양한 알림을 생성하는 유용한 트렌드 보조 도구입니다. Heiken Ashi를 거래 전략에 통합하고 싶은 트레이더에게 필수적인 도구입니다. Heiken Ashi가 하락 상태에서 상승 상태로 전환되면 매수 화살표가 표시됩니다. Heiken Ashi가 상승 상태에서 하락 상태로 전환되면 매도 화살표가 표시됩니다. 모바일 알림, 이메일, 사운드, 팝업 알림 모두 지원됩니다.
Heiken Ashi란? Heiken Ashi(平均足)는 일본어로 "평균 바"를 의미하며, 기존의 일본식 캔들보다 트렌드를 더 쉽게 파악할 수 있도록 설계된 차트 유형입니다. 이 캔들은 진입과 청산 전략 모두에 활용될 수 있으며, 색상이 바뀌면 종종 시장 방향의 전환을 의미합니다.
중요 포인트
Heiken Ashi Alerts를 단독으로 사용하는 것은 추천하지 않으며, 다른 보조 지표와 함께 사용하는

KT Pip Counter 는 실시간으로 핵심 데이터를 표시해 주는 간단하면서도 유용한 지표입니다. 수익·손실, 스프레드, 잔여 시간 같은 정보를 한눈에 파악할 수 있어, 급변하는 장세에서도 침착하게 대응하고 의사결정 속도를 높일 수 있습니다.
특징
현재 손익을 통화, 핍, 퍼센트로 동시에 표시. 실시간 스프레드를 표시. 현재 캔들이 마감될 때까지 남은 시간을 알려줌. 손익 상황에 따라 색상을 자동 변경. 텍스트 위치와 레이아웃을 자유롭게 설정 가능. CPU 사용량이 매우 낮아 플랫폼이 느려지지 않음.
입력값 Account P&L: true이면 계좌 전체 손익, false이면 현재 종목 손익만 표시. 색상 및 글꼴 크기 설정. Show After Current Bar: true이면 캔들 종료 후 정보 표시, 아니면 차트 구석에 고정. 나머지 입력값은 직관적으로 이해 가능.

KT Pivot Points는 최신 데이터를 기반으로 일간, 주간, 월간 피벗 레벨을 차트에 자동으로 표시합니다. 피벗 포인트는 외환 시장을 포함한 기술적 분석에서 널리 사용되는 지표입니다.
주요 기능
가격이 피벗 레벨에 도달하면 알림을 전송합니다. 각 피벗 레벨 종류별로 완전한 사용자 지정이 가능합니다. 일간, 주간, 월간 피벗 레벨을 깔끔하게 표시합니다. CPU 자원을 적게 사용하여 빠르게 계산됩니다. 차트상의 다른 지표들과 호환됩니다.
피벗 포인트란? 피벗 포인트는 전일의 고가, 저가, 종가의 평균을 이용하여 계산됩니다. 이 계산된 피벗 포인트를 기반으로 향후의 지지 및 저항 수준을 예측할 수 있으며, 이는 해당 수준 근처에서의 가격 움직임을 판단하는 데 도움이 됩니다. 일반적으로 가격이 피벗 포인트 위에서 거래되면 강세 심리를, 아래에서 거래되면 약세 심리를 나타냅니다.
피벗 계산식
피벗 레벨을 계산하기 위해 전일, 주간 또는 월간의 고가, 저가, 종가 데이터를
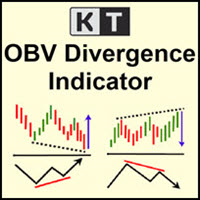
KT OBV Divergence는 가격과 OBV(온밸런스 볼륨) 오실레이터 사이에 형성되는 일반 및 숨겨진 다이버전스를 표시합니다.
기능
비대칭 다이버전스는 정확도를 높이고 시각적 혼란을 줄이기 위해 자동으로 제외됩니다. 추세 전환 및 추세 지속 전략 모두에 활용 가능합니다. Expert Advisor에 완벽히 통합 가능한 구조로 설계되었습니다. 진입 신호뿐만 아니라 청산 신호로도 활용할 수 있습니다. MetaTrader의 모든 알림 기능을 지원합니다.
다이버전스란 무엇인가요?
기술적 분석에서 일반적으로 가격이 더 높은 고점을 만들면 오실레이터도 더 높은 고점을 만들어야 하며, 가격이 더 낮은 저점을 만들면 오실레이터도 같이 낮아져야 합니다. 이와 같은 정상적인 관계가 무너질 때, 가격과 오실레이터 간에 다이버전스가 발생한 것으로 봅니다. 다이버전스는 크게 두 가지 유형이 있습니다: 일반적인 강세 다이버전스: 가격은 더 낮은 저점을 만들지만, 오실레이터는 더 높은 저점을 만듭

KT Currency Strength Meter는 주요 외환 통화쌍에 적용된 종합적인 수학 공식을 통해 각 통화의 강세와 약세를 측정하는 인디케이터입니다. 고정된 기간 동안의 양봉과 음봉을 기반으로 통화의 강도를 계산하며, 이 데이터를 기반으로 알고리즘이 가장 강한 통화와 가장 약한 통화를 실시간으로 정렬하고 지속적으로 업데이트합니다.
장점
강한 통화에 대해 약한 통화를 매수하려는 잘못된 신호를 걸러내어 거래 전략을 즉시 개선할 수 있습니다. 의도하지 않은 헤지나 과도한 거래를 방지할 수 있습니다. 강세 통화에 대해 약세 통화를 매수하는 등의 고위험 역추세 거래를 피할 수 있습니다. 서로 상쇄되는 포지션을 필터링할 수 있습니다. 가장 최근 데이터를 기반으로 실시간 업데이트가 이루어집니다. 가볍고 최적화된 코드로 CPU 리소스를 최소화하여 다른 전략이나 인디케이터의 작동에 영향을 주지 않습니다. 각 통화는 고유 색상으로 표시되어 시각적으로 빠르게 구분할 수 있습니다. 복잡한 설정 없

Magic Night is an automated trading system that uses a channel indicator and candlestick patterns to open and close trades.
Trades every day at a specific time.
Doesn't use grid, martingale or other dangerous money management methods.
Timeframe М5, currency pairs EURAUD, EURCAD, GBPCAD, GBPUSD Minimum deposit 70 usd.
Live signal https://www.mql5.com
Instructions for installing https://Blogs Magic Night
Download set files https://Sets Magic Night
Settings EA Order_Comment - Order com

Bitsgap scalping bot is a fully automatic scalping trading system. This robot automatically analyzes the market using the ATR indicator. Then the robot automatically opens and closes orders. The robot automatically calculates the lot of opened trades to achieve maximum efficiency with minimal drawdown.
Recommendations: run the robot on an ECN account. minimum deposit 200$ currency pair GBPUSD timeframe H1
Robot Advantages: does not use martingale. does not use a grid. does not use hedging. do

Displays time lines based on your custom time zone offset (Note: 30-minute offsets are not supported). It also displays price lines at clean, round intervals (e.g., 100.000, 100.010, 100.020). By default, MT4 displays grid lines based on the broker's server time and price, which often results in awkward, uneven placements that can be highly confusing. This indicator solves that by drawing grid lines exactly where you want them—at intuitive time offsets and price levels. It is highly optimized an

EA SCALPER GHOST PRO
This is single Entry type EA. It use smart alghoritme to detect market movement. It also use Stop loss and take profit . EA will not use any dangerous system like martingale, grid, averaging etc which can cause account blown in a second Tis EA use More than one pair to reduce risk. Right now im using 13 pair at the same time
Settings Options: TF M5 Pair : Please use all pairs together (7 PAIRS) USDCHF, EURUSD, , AUDUSD, EURGBP, EURAUD, AUDCAD, EURCAD
USE SETFILE ON EACH
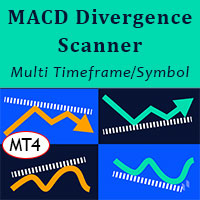
MACD Divergence Scanner is a multi-timeframe and multi-symbol dashboard and alert that checks all timeframes and symbols to find regular and hidden divergences between price chart and MACD indicator. This divergence scanner is integrated with support and resistance zones so you can check the MACD divergences in the most important areas of the chart to find trend reversals in the price chart. Download demo version (works on M 1,M5,M30,W1 timeframes) Full description of scanner parameters ->

Place Forex trades in different Metatrader accounts at the same time with Local Trade Copier software.
Become a private and independent account manager!
CopyTrade System will allowed you to managment account as Profissional...
Open two separate metatrader accounts, place same EA in experts folder... Reboot MT4 platforms, place EA Master on one Platform, and EA Slave on another platform.
How to use: - Place manual trades on Master account, they will be copied on Slave account. If deal w

It is a new indicator that frames the price movement and tracks it. It consists of oscillation channel and its center line CL . For its calculation it is only necessary to introduce the amplitude of the channel. Because of this, it is a non-lagging indicator as it is not calculated based on a number of previous candlesticks. It removes any level of noise , showing the underlying price movement cleanly via the center line . It allows you to easily identify the beginnings and ends of the trend ,

The programmable signal panel analyzes the charts of all available symbols and timeframes and sends a notification about the appearance of a trading signal. You can program all the necessary signals using the free binding indicator "Signal Collection". The binding indicator is provided with open source code. Thus, it is possible to program all the necessary signals for subsequent use in conjunction with the signal panel. The signal panel can not only analyze charts, but also manage these chart
FREE

Superdog Pro is a fully automated trading robot on mainly EURUSD. Its minimum deposit required is only 500 USD. It utilises a dynamic grid system that prioritises to avoid large floating drawdowns. With its priority on minimizing drawdowns, it closes trades when it detects potential danger in the market. Unlike most of the other grid/martingale strategies which have to wait til the market rebounces to an extent that results in profitable trades, Superdog Pro's dynamic innovative TP/SL mechanism
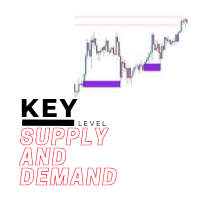
The key level supply and demand indicator is the first supply and demand indicator with options to change settings to show different zones, giving you the choice to pick the zones you see are being respected the most and saving the settings.
Advantages
The key level supply and demand DOES NOT REPAINT unlike other supply and demand currently in the market. This gives you a massive advantage to scroll back and see how price reacted on previous levels. The key level supply and demand has the opt
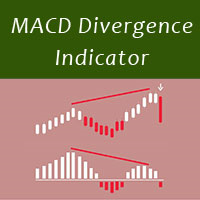
MACD divergence indicator finds divergences between price chart and MACD indicator and informs you with alerts (popup, mobile notification or email). Its main use is to find trend reversals in the chart. Always use the divergence indicators with other technical assets like support resistance zones, candlestick patterns and price action to have a higher possibility to find trend reversals. Three confirmation type for MACD divergences: MACD line cross zero level Price returns to previous H/L Creat
FREE

Run the robot on GBPUSD, H1 timeframe, minimum balance of $500 or more, ECN account type, leverage 1:100. The larger the balance, the smaller the drawdown will be. This robot analyzes the market using two indicators: ATR and Momentum. With the help of these two indicators, the robot finds points for opening trades. After the robot has opened trades, it starts to analyze them constantly. When the trade reaches the desired profit or loss, the robot closes it.
Recommendations for trading: ECN acc

Renko HMA Channel is a professional EA the uses Renko charts in combination with the Hull Moving Average.
Time Frame : This expert advisor works on all timeframes;
Account balance: it doesn't matter, but I recommend at least 1000 EUR or 1500 USD; Currency pair : Doesn't matter ; Warning! Do not use the default settings, always use optimization option in strategy tester to find the best settings for your broker, preferred chart and timeframe!
- Multiple user options, for finetuning
The indicator is a trading system for AUDUSD or NZDUSD currency pairs.
The indicator was developed for time periods: M15, M30.
At the same time, it is possible to use it on other tools and time periods after testing.
"Kangaroo Forex" helps to determine the direction of the transaction, shows entry points and has an alert system.
When the price moves in the direction of the transaction, the maximum length of the movement in points is displayed.
The indicator does not redraw, all actions occur a

Ichimoku Master EA is a fully automated Expert Advisor for trading according to Ichimoku Kinko Hyo Strategy. The signals used to start trading are very well filtered, and then a special algorithm makes sure to stay in the trend as long as possible.
Ichimoku Master EA Settings
Features
Martingale, Grid, Averaging or other dangerous techniques are not used Trend following strategy Limitation of distance between same direction orders Hard and Virtual Take Profit and Stop Loss levels Basket TP

Currency Pair Information
Useful indicator to have the following information on the chart: 1. Asset Name 2. Current Spread 3. Current ATR of the actual time frame 4. Time to close of the candle
It is located at the top right of the chart. If you request it, I can add the parameterization of the location of the information.
Other tools:
AMS Forex System
hockfx Price Alert Pro
hockfx
FREE

About the Lyne indicator
Lyne is a Metatrader 4 (MT4) indicator, the essence of which is to transform the accumulated historical data.
The Lyne indicator makes it possible to detect various features and patterns in price dynamics that are invisible to the naked eye.
Based on this information, traders can anticipate further price movement and adjust their strategy accordingly.
This indicator has proven itself in the scalping strategy. The indicator works without repainting.
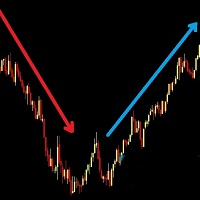
A simple and effective trend indicator. It will be a good assistant when trading. A minimum of understandable settings. Put it on a chart and set it up Good to combine with other indicators. I will post another trend indicator soon. The combination of these two indicators gives good results. Works on all timeframes. Suitable for any couple. Experiment, adjust, observe. Filter by higher timeframes.
FREE

IMP
The Panel presents a number of indicators in abbreviated form: 2 oscillators, 2 trend and 1 volume indicator. Location - upper left corner.
Indicators values and colors can be customized by the user. Combined with other market analysis, can greatly improve trading results. This Indicator is a suitable tool for beginners and professional traders as one.
Metta Trader 4 Indicator Version _1.0
FREE

KT Average Daily Range(ADR) shows the upper and lower levels using the average daily range covered by the currency pair or the instrument. The average daily range is calculated using the chosen period in the input settings. ADR High: ADR upper level is found by adding the average daily range value to the current day's low.
ADR Low: ADR lower level is found by subtracting the ADR value from the current day's high.
Features
It shows the ADR levels with several other helpful information benefici

Reborn — A Trend Robot With Strategies Built In
Reborn is a trend-following trading robot built on the Investment Castle Indicator, with several ready-made strategies inside so you can match it to your style — from straightforward stop-loss and take-profit to kill-and-switch direction changes with recovery.
What it does for you Multiple built-in strategies: choose the approach that fits your market and risk appetite. Trend-driven entries: powered by the Investment Castle Indicator. Smart recov
FREE
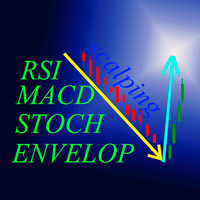
"Four eyed turkey" это индикатор на основе RSI,Stochastic,MACD и Envelopes определяющий точки входа на таймфреймах М5, М15, М30, Н1. В отдельном окне индикаторы указывают возможные точки входа, параметры можете определить самостоятельно в настройках. Для RSI и Stochastic - зоны перекупленности и зона перепроданности. Для MACD - сигнальная линия и гистограмма выше 0 это BUY, для SELL противоположно . Для Envelopes - открытие свечи выше верхней линии это BUY, открытие свечи ниже нижней линии это
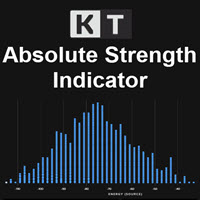
KT Absolute Strength measures and plots the absolute strength of the instrument's price action in a histogram form. It combines the moving average and histogram for a meaningful illustration. It supports two modes for the histogram calculation, i.e., it can be calculated using RSI and Stochastic both. However, for more dynamic analysis, RSI mode is always preferred.
Buy Entry
When the Absolute Strength histogram turns green and also it's higher than the previous red column.
Sell Entry
When th
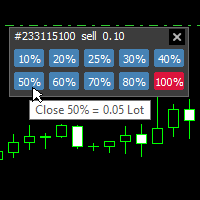
With this tool, you can easily and quickly close part of the trade . Click near the trade to display the closing panel. There are ten preset values for partial closing, but you can set your own values. You can also resize the panel according to Windows settings (125%, 150% ...) See the animation below for how it works. **********************************************************
Note: This tool does not work in the tester.
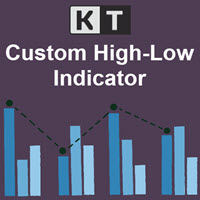
KT Custom High Low shows the most recent highs/lows by fetching the data points from multi-timeframes and then projecting them on a single chart. If two or more highs/lows are found at the same price, they are merged into a single level to declutter the charts.
Features
It is built with a sorting algorithm that declutters the charts by merging the duplicate values into a single value. Get Highs/Lows from multiple timeframes on a single chart without any fuss. Provide alerts when the current pri
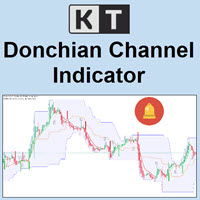
KT Donchian Channel is an advanced version of the famous Donchian channel first developed by Richard Donchian. It consists of three bands based on the moving average of last high and low prices. Upper Band: Highest price over last n period. Lower Band: Lowest price over last n period. Middle Band: The average of upper and lower band (Upper Band + Lower Band) / 2. Where n is 20 or a custom period value is chosen by the trader.
Features
A straightforward implementation of the Donchian channel ble
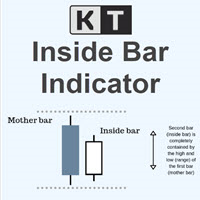
KT Inside Bar plots the famous inside bar pattern in which the bar carries a lower high and higher low compared to the previous bar. The last bar is also known as the mother bar. On smaller time-frames, the inside bar sometimes appears similar to a triangle pattern.
Features
Also plots entry, stop-loss, and take-profit levels with the inside bar pattern. No complex inputs and settings. Erase unwanted levels when the price reaches the entry line in either direction. All Metatrader alerts include
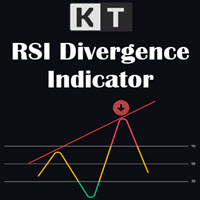
KT RSI Divergence shows the regular and hidden divergences built between the price and Relative Strength Index (RSI) oscillator. Divergence can depict the upcoming price reversal, but manually spotting the divergence between price and oscillator is not an easy task.
Features
Ability to choose the alerts only for the divergences that occur within an overbought/oversold level. Unsymmetrical divergences are discarded for better accuracy and lesser clutter. Support trading strategies for trend reve

Minimum deposit is 1000$ , or 1000 Cent = 10$. (Recommended 1500$) Every 1000$ = 0.01 Lot. Please stick to the rules, as we want you to win, win and win! (Trading is risky, and there are no guarantees for winning)
Time frame: M1
Leverage : Higher the better
Spread: Lower the better
Account type : All types
(EA may enter hedge positions, if you want to disable this feature deactivate either Buy, or Sell

This indicator detects trade direction and sends notification to your mobile phone so that you can enter/exit a trade without having to be seated in front of desktop computer all day and night. Although you have to execute/send an order yourself, you can setup rules through the setting made available for proper lots size base on the available balance/fund you are trading with. The opportunity to take a profit at the right time and set reasonable stop loss that will not be overwhelming and gett

Minimum deposit is 1000$ , or 1000 Cent = 10$. (Recommended 1500$) Every 1000$ = 0.01 Lot. Please stick to the rules, as we want you to win, win and win! (Trading is risky, and there are no guarantees for winning)
Time frame: M1
Leverage : Higher the better
Spread: Lower the better
Account type : All types
(EA may enter hedge positions, if you want to disable this feature deactivate either Buy, or Sell f

Time frame: M1
Leverage : Higher the better
Spread: Lower the better
Account type : All types
(EA may enter hedge positions, if you want to disable this feature deactivate either Buy, or Sell from the setting)
Please please do not take unnecessary risks. (Trading is risky, and there are no guarantees for winning)
We wish you successful trading. (Trading is risky, and there are no guarantees for winning

KT Fisher Transform is an advanced version of the original Fisher Transform oscillator equipped with divergence detection, crossover alerts, and many more features. Originally it was developed by John F. Ehlers. It converts the asset's price into a Gaussian normal distribution to find the local extremes in a price wave.
Features
A light-weighted oscillator that efficiently identifies the upward and downward crossovers and marks them using vertical lines. It also finds regular and hidden diverg

Time frame: M1
Leverage : Higher the better
Spread: Lower the better
Account type : All types
(EA may enter hedge positions, if you want to disable this feature deactivate either Buy, or Sell from the setting)
Please please do not take unnecessary risks. (Trading is risky, and there are no guarantees for winning)
We wish you successful trading. (Trading is risky, and there are no guarantees for winning)
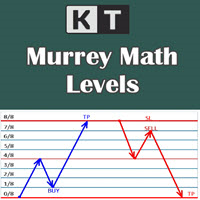
It shows the Murrey Math levels on chart and also provides an alert when price touch a particular level. T. Henning Murrey, in 1995, presented a trading system called Murrey Math Trading System, which is based on the observations made by W.D Gann.
Applications
For Murrey Math lovers, this is a must-have indicator in their arsenal. There is no need to be present on the screen all the time. Whenever the price touches a level, it will send an alert. Spot upcoming reversals in advance by speculatin

Only 1 copies left at a price of $99. Next price $199!
actual .set files (click me)
interactive panel manual (click me)
Version for MT5: Smart Start Smart Start is a smart trading system, the indicators of which allow it to be used both for trading with small deposits (fast acceleration) and for conservative trading. is a modernized trading indicator system that uses the MACD indicator to analyze the market. To analyze entry points, smart start takes into account the historical indica
KT Candle Timer shows the remaining time in the closing of the current bar. You can use the bar closing time for multiple purposes, including time and trade management during the trading hours.
Features
It also shows the Symbol spreads along with the remaining time. It offers two convenient timer display positions, i.e., chart corner or next to the current bar. From colors to text size, it offers full customization according to user preferences. It is optimized to work without using extensive c

KT Bullish Bearish shows the bullish/bearish regime of the market in the form of a colored histogram representing both of the market states alternately. Bull Market (Blue Histogram): A bull market indicates an uptrend when an instrument price rises over a continued period like days, months, or years. Bear Market (Red Histogram): A bear market indicates a downtrend when an instrument price rises over a continued period like days, months, or years.
Applications
It prevents trading against the big

Some disadvantages of Rollover Scalper: Currently the markets aren't that favorable for night scalping because of the fundamentals, so the next few months the EA might show 0% or even negative return. However, it happened in the past too and it was still profitable over all ~20 years. It's a scalper, so you'll need a broker with low spread and good execution time, preferably an ECN broker. ICMarkets would be a good choice. It's susceptible to slippage (which can't be backtested or limited on ECN

Make your Passive Income DREAM a Reality !! Let our intelligent EA(Expert Advisor) take care of your portfolio 24/7. You no longer need to watch your portfolio all day waiting to the trading moment the EA will do it for you. Let CODENoah Earth be your ANSWER to every life-style you desire. Designed for Technical and Algorithmic Trading The HIGH intelligent EA: CODENoah Earth , that will only trade when there a chance of profit and cut loss immediately when you balance is lost to a certain point

我很高兴欢迎您来到我的产品页面 面板初次加载会服从后台设置,面板控制交易管理凌驾于后台之上。请注意交易方向的管理,正确的交易方向是交易市场生存的根本,这点很重要。 Ea交易有2种策略Sto,MA和用户在面板打开的执行订单,同时也支持移动端下单(下单基础请服从后台自行设置手数)、移动端预下单功能。 Sto策略单量密度大,是激进策略;MA策略较缓和。
此EA可全自动化交易,设置偏向于辅助手控交易。 ============Basic settings============= Magic EA 交易品种(trading variety) 点差(Spreads) 点差系数(Spread coefficient) =============conditions for execution==== 交易模式(Choosing strategy) 打开新系列订单(Open new series) //是否允许,否的话会停止打开新阶段订单。关闭状态适合运行预交易功能,也就是控制运行,一阶段一结。。 开多(Trade Sell) //处于关闭状态会停止一切开Sell方向单子。 开
FREE

欢迎来到本产品界面 指标,简单可观,直接加载即可,对于趋势有一定的把握及反转。 本指标可在Taxcr EA工具中使用,作为开初始单依据,单次运用,非循环开单!伙伴们可以去了解 axcr EA工具。
IWelcome to the product interface Indicators, simple and considerable, can be loaded directly, and have a certain grasp and reversal of the trend. This indicator can be used in Taxcr EA tool as the basis for initial billing, single use, non cyclic billing!

1. Стрелочный индикатор. 2. Для анализа использует несколько скользящих средних на разных таймфреймах и соотносит их с важными уровнями цены. 3. Не перерисовывает стрелку, т.к. использует для расчета фиксированное количество исторических данных. 4. Пример работы индикатора приведен на скриншотах. 5. Показывает отличные результаты на всех валютных парах на таймфрейме от H 1 и выше. 6. Не требует оптимизации.

TopBottom Checker 는 가격의 바닥과 상단을 결정하는 지표입니다. 표시기는 모든 통화 쌍과 함께 사용할 수 있습니다. 표시기는 M1에서 D1까지의 모든 시간 프레임에서 작동합니다. 이 지표는 절대적으로 모든 전략에 매우 중요한 시장 측면과 함께 작동하므로 지표는 독립형 거래 시스템으로 또는 사용하는 거래 시스템의 일부로 사용할 수 있습니다. 지표 신호는 추세와 함께 진입하거나 추세에 반대하여 반전으로, 그리고 열린 포지션의 폐쇄 가능성, 즉 시장을 종료할 가능성을 나타내는 데 모두 사용할 수 있습니다. 표시기는 사용하기가 매우 쉽습니다. 차트에 지표를 추가하고 필요에 따라 해당 신호를 따르기만 하면 됩니다. 이 도구는 외환 거래 및 바이너리 옵션 거래에 사용할 수 있습니다. 기본적으로 지표는 가격 반전을 예측하기 위해 분석이 수행되어 그러한 조건 형성의 가장 빠른 징후를 찾으려고 시도하기 때문에 신호를 약간 다시 그릴 수 있습니다. 다시 그리기는 사소하지만 가능합니다.

Market Trend Catcher indicator analyzes the duration of trend movements and, with a certain development of the current trend, offers market entry points in the form of arrows with recommended profit targets. The indicator is very easy to use and does not require a lot of information to understand how it works. It has a minimum of settings and is transparent in understanding the principle of its operation, fully displaying the information on the basis of which it makes decisions on recommending e

Advisor 뉴스 거래의 경우 Advisor는 설정된 시간에 뉴스 이전에 보류 주문을 배치합니다!!! 임계값은 현재 가격과의 거리입니다. 보류가 실행되면 시장 주문이 열리고 반대쪽 보류는 두 배로 증가합니다. 단 3주기만 증가합니다! 테이크와 스톱은 테이크 오더가 스톱 오더의 마이너스를 커버하는 방식으로 계산되며 결과적으로 총계 + !!!를 얻게 됩니다.
상황의 1개 모델, 첫 번째 로트는 0.01입니다(예: 판매). 예를 들어 테이크와 같이 한 방향으로 무반동 움직임이 있는 경우 +를 얻습니다. 상황의 모델 2: 첫 번째 매도 주문이 0.01 개시되고 가격이 롤백되어 캐치됩니다(두 번째 구매 중지 지연). 증가된 로트가 개시됩니다. 0.02 구매 가격이 테이크에 도달하고 여전히 총계를 얻습니다. 상황의 세 번째 모델, 첫 번째 주문이 개설되어 0.01 매도하고 가격이 롤백되어 포착됩니다(2차 구매 중지 지연). 0.02의 증가된 로트가 개설되고 가격이 다시 반전되
FREE

Traders Toolbox Overwatch - 실행 중인 모든 Traders Toolbox 에 대한 모니터링 유틸리티입니다.
모든 Traders Toolbox Running 차트에 대한 간단한 차트 전환 유틸리티이자 시장 감시입니다.
특징:
1. 사용자 정의 가능한 버튼 색상, 행 및 열.
2. 세 가지 신호 유형(보유 - 황색 / 매도 - 적색 / 매수 - 녹색)
3. Traders Toolbox 의 새 인스턴스 또는 종료된 인스턴스에 따라 버튼 목록을 동적으로 업데이트합니다.
4. 단일 클릭 버튼은 관련 차트를 전경으로 가져옵니다.
5. 매수 및 매도 신호는 Traders Toolbox 차트 신호와 일치하는 백분율로 신호 강도를 표시합니다.
참고: 유틸리티는 Traders Toolbox / Traders Toolbox Lite 와 함께만 사용할 수 있으며 독립적으로 작동할 수 없습니다

Professional forex robot scalper. The robot opens within one day from 1 to 5 trading orders. Each order is insured by StopLoss and TakeProfit. After opening an order, the robot accompanies it with the help of TrailingStop (StopLoss is constantly tightened following the price to reduce the risk of loss and bring the trade into profit). Each open order is constantly analyzed using a special virtual order management module. This module, with the arrival of each new tick, constantly analyzes open o

An equity protection EA for MetaTrader that enforces your loss limits and profit target for you: when your account reaches a rule you set, it closes your trades on every symbol, before one bad day turns into a lost account. It suits prop firm challenges and personal accounts alike. Attach it to one chart, answer a few questions in the on-chart setup wizard, and it watches your whole account in the background while you trade by hand or with other EAs. What it protects Daily loss limit: a percenta
MetaTrader 마켓은 MetaTrader 플랫폼용 애플리케이션을 구입할 수 있는 편리하고 안전한 환경을 제공합니다. Strategy Tester의 테스트를 위해 터미널에서 Expert Advisor 및 인디케이터의 무료 데모 버전을 다운로드하십시오.
MQL5.community 결제 시스템을 이용해 성능을 모니터링하고 원하는 제품에 대해 결제할 수 있도록 다양한 모드로 애플리케이션을 테스트할 수 있습니다.
