 MetaTrader 5
 Experts
 지표
 라이브러리
 유틸리티
 위젯
 규칙
MetaTrader 4용 새 Expert Advisor 및 지표 - 194
 트레이딩 로봇은 자동으로 시장거래를 수행하는 반면 지표는 가격을 더 잘 분석하고 가격 행동을 예측할 수 있게 해줍니다.
이러한 어플리케이션을 사용하면 MetaTrader 4에서 더 많은 기회를 포착하는 동시에 보다 정보에 입각한 방식으로 거래를 수행할 수 있습니다.

Esse indicador mede o 1º Canal de referencia e a 1º Zona Neutra * configurar o canal macro para verificar a frequencia MAIOR H1 H4 1D * configurar o canal micro para verificar a frequencia Menor 1M 5M 15M Como instalar o Indicador fimathe. E uma pré mentoria tem uma estrategia Secreta bonus nesse video . assitao o video para enteder as logicas que podemos iniciar com esse indicador.
https://www.youtube.com/playlist?list=PLxg54MWVGlJzzKuaEntFbyI4ospQi3Kw2
FREE
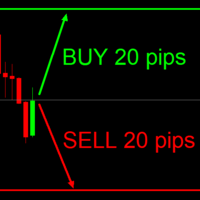
This indicator is very useful for day traders or short term traders. No need to calculate the number of pips manually, just look at the chart and you will see the Virtual Take Profit / Virtual Stop Loss target line and evaluate whether the entry point is feasible to reach the intended target or not.
Enter the intended Take Profit / Stop Loss pips for your trade. The indicator will display Virtual Take Profit / Virtual Stop Loss lines for you to easily see if the target is feasible or not.
FREE
Индикатор Strong Reversal Points H1 показывает стрелками сильные разворотные точки на таймфрейме H1. Индикатор не перерисовывает! Для максимального винрейта торгуйте только на таймфрейме H1 и только 3 (три) основные валютные пары: EURUSD, GBPUSD, USDCAD! Обязательно! Перед торговлей или тестом (прогоном в тестере) убедитесь в том, что в вашем терминале MT4 установлен правильный час открытия торгов в Нью-Йорке (параметр Terminal_NewYork_Open_Hour). Нужен час открытия Нью-Йорка именно по времени в

This is a fully FIFO compliant EA that performs money management as well as risk management. It is ideal for American residents who deal with FIFO limitations and low 1:50 leverage. The EA entry point is fully customizable and traders can conveniently modify the inputs to serve their own risk apatite. Here is the signal I created to track the progress of this EA live: https://www.mql5.com/en/signals/1491511 Since it uses martingale strategy, a gradual delay strategy is defined in the EA that clo
Don이 공격적인 거래 전문가를 만나도록 하겠습니다. 다방향 시스템으로, 모든 시간과 모든 통화를 다루고 드로다운 제어 기능을 갖추고 있습니다. 이 시스템은 더 낮은 시간과 더 긴 시간에 일어나는 일에 대한 후속 조치와 함께 내 마틴게일 논리 중 하나를 사용합니다. 또한 드로다운에 개입해야 하는지 여부도 결정됩니다. 많은 사람들이 마틴을 좋아하지 않는다는 것을 알고 있습니다. 또는 엣지 시스템 그들은 계정을 소각하는 데 익숙하지만 내 시스템은 다르다고 믿습니다. 오류를 처리하고 지속적으로 이동하기 위해 구현된 로직이므로 이러한 시스템은 높은 DD를 가질 수 있으므로 내부 시스템이 있습니다. 이를 제어하도록 설계된 시스템은 Martins가 시장에서 가장 많은 수익을 창출하는 회사라는 점을 기억하십시오.
그리드 거래를 위한 고급 기술을 사용하고 전체 시장을 관리하는 공격적인 시스템, 돈 히트로 진입이 가능합니다. 기술의 가장 진보된 기술은 진입과 퇴출을 통제하는 보호이기 때문입니다.
Fibo + Elliott + CME
The Expert Adviso r is designed as an assistant for manual trading. Ready-made trading system based on Elliott waves and Fibonacci retracement levels . It is simple and affordable. Display of the marking of Elliott waves (main or alternative option) on the chart. Construction of horizontal levels, support and resistance lines, a channel. Superposition of Fibonacci levels on waves 1, 3, 5, A Display data from CME (CME - Chicago Mercantile Exchange Chicago Mercantile Excha

제가 몇 년 동안 사용하고 있는 유용한 로봇을 소개드립니다. 반자동뿐만 아니라 자동 모드로도 사용할 수 있습니다. >>> Chat <<<
본 프로그램에는 경제 캘린더의 뉴스별로 유연한 거래 설정이 포함되어 있습니다. 전략 테스터에서 확인할 수 없습니다. 진짜 작업뿐입니다. 터미널 설정에서 허용된 URL 목록에 뉴스 사이트를 추가해야 합니다. 서비스>설정 > 조언자>를 클릭합니다. "다음 URL에 대해 WebRequest 허용:" 확인란을 선택합니다. 다음을 추가합니다 (공백 삭제): https:// nfs.faireconomy.media
최신 설정 아카이브 다운로드: https://www.mql5.com/en/blogs/post/747929 신호 모니터링: https://www.mql5.com/en/signals/author/test-standart 이 전문가를 위해 고유 설정 세트를 만들 때 블로그의 모든 매개변수에 대한 설명을 참조하십시오: https://www

차트에서 모든 볼린저 밴드 터치 모니터링 KT Bollinger Bands Alert는 상단, 중앙 및 하단 볼린저 밴드를 표시하고 현재 캔들이 선택한 밴드에 닿는지 모니터링합니다. 자신의 거래 방식에 필요한 밴드 이벤트를 활성화하면 다른 시장을 살피는 동안에도 중요한 순간을 알림으로 확인할 수 있습니다. 세 밴드의 현재 가격을 한눈에 확인 선택 가능한 가격 태그는 차트에서 상단, 중앙 및 하단 밴드의 현재 값을 따라갑니다. 각 밴드의 색상도 개별적으로 설정할 수 있어 자신의 차트 구성에서 외부 경계와 중앙 기준선을 쉽게 구분할 수 있습니다. 계산 방식과 알림 흐름 설정 볼린저 설정: 기간, 편차, 이동 및 적용 가격을 조절합니다. 차트 기록: 밴드를 표시할 과거 봉의 수를 선택합니다. 밴드 선택: 상단, 중앙 및 하단 밴드 알림을 각각 켜거나 끕니다. 알림 간격: 반복되는 터치 알림을 관리하도록 알림 사이의 최소 시간(분)을 설정합니다. 원하는 방식으로 알림 수신 선택 가능한 소리
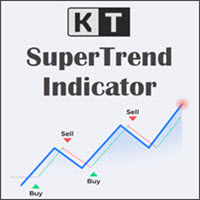
KT SuperTrend는 가격 차트에 하나의 명확한 방향선을 표시합니다. 상승 추세에서는 선이 가격 아래에서 계단식으로 움직이며 추세를 따라가는 기준이 됩니다. 하락 추세에서는 선이 가격 위로 이동해 시장의 하락을 따라갑니다. 가격과 선 사이의 거리는 Average True Range를 기반으로 하므로 변동성이 커지거나 작아질 때 자동으로 조정됩니다. 캔들이 SuperTrend 선의 반대편에서 마감되면 방향이 바뀝니다. 선 위에서 마감하면 상승 추세 신호가 표시되고, 선 아래에서 마감하면 하락 추세 신호가 표시됩니다. 최근 신호 방향과 진입 가격도 차트에 계속 표시되므로 과거 캔들을 찾아보지 않아도 현재 상태를 이해할 수 있습니다. 세 단계로 차트를 확인하세요 현재 선 확인: 선이 가격 아래에 있으면 상승 관점을, 가격 위에 있으면 하락 관점을 뒷받침합니다. 시간대 비교: 내장 스캐너는 M1부터 월봉까지 SuperTrend 방향을 보여 줍니다. 실제 거래하는 시간대의 방향이 일치하
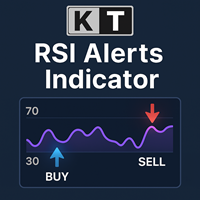
KT RSI Alerts는 RSI(상대강도지수) 오실레이터의 사용자 맞춤형 버전으로, 다음의 네 가지 사용자 지정 이벤트에 대한 신호와 알림을 제공합니다: RSI가 과매수 구간에 진입할 때 RSI가 과매수 구간에서 벗어날 때 RSI가 과매도 구간에 진입할 때 RSI가 과매도 구간에서 벗어날 때
기능 RSI의 과매수/과매도 구간 내 움직임을 기반으로 거래 전략을 구성하는 트레이더에게 매우 적합합니다. 가볍게 설계된 인디케이터로 시스템 자원을 거의 소모하지 않습니다. MetaTrader의 모든 알림 기능을 완벽하게 지원합니다.
RSI(상대강도지수)의 역사 RSI는 J. Welles Wilder가 개발하였으며, 1978년에 출판된 『New Concepts in Technical Trading Systems』와 같은 해 6월 발행된 Commodities 잡지에 처음으로 소개되었습니다. RSI는 모멘텀 오실레이터로 분류되며, 가격 움직임의 속도와 강도를 측정합니다. 상승 종가와 하락 종가

시장 방향을 한눈에 확인 KT Trend Filter는 개선된 추세 분석 방식을 가격 차트 위의 선명한 색상 라인으로 보여 줍니다. 여러 보조지표를 겹치지 않고도 시장이 상승, 하락 또는 횡보 중인지 빠르게 파악할 수 있습니다. Trend Period 기본값 200은 넓은 방향성을 보여 주면서 현재 상태를 쉽게 확인할 수 있게 합니다. 추세 방향을 명확한 시각 정보로 활용 파란색 Uptrend: 강세 시장 상태를 강조하여 자신의 전략에 맞는 매수 기회에 집중할 수 있게 합니다. 연어색 Downtrend: 약세 시장 상태를 강조하여 자신의 전략에 맞는 매도 기회에 집중할 수 있게 합니다. 카키색 Sideways: 추세 조건이 덜 분명할 때 횡보와 혼합 방향을 더 쉽게 알아볼 수 있게 합니다. 거래 중인 차트에서 진입, 포지션 관리 및 시간대 정렬을 위한 빠른 시각 필터로 라인을 활용할 수 있습니다. 9개 시간대에서 더 큰 흐름 확인 선택형 MTF Scanner는 M1, M5, M15,

KT Forex Volume은 통화쌍의 매수 및 매도 거래량을 컬러 히스토그램 형태로 표시합니다. 거래량은 자산에 대한 매수 및 매도 거래로 구성됩니다. FX 시장에서: 매수량이 매도량보다 많으면 해당 통화쌍의 가격은 상승하는 경향이 있습니다. 매도량이 매수량보다 많으면 해당 통화쌍의 가격은 하락하는 경향이 있습니다.
주요 기능 틱 볼륨 데이터를 활용하여 나쁜 거래를 피할 수 있습니다. 시장 내 큰 자금을 움직이는 플레이어의 방향에 따라 거래할 수 있도록 도와줍니다. Metatrader의 모든 알림 기능이 포함되어 있습니다.
틱 볼륨 활용하기 기타 시장과 달리, 현물 외환 시장은 중앙 집중식이 아니기 때문에 개인 트레이더가 실제 볼륨 데이터를 얻는 것은 매우 어렵습니다. 2011년 베테랑 외환 트레이더 Caspar Marney가 발표한 연구에서는 틱 볼륨과 실제 거래량 사이에 높은 정확도와 상관관계가 있다고 결론지었습니다.
히스토그램 계산 공식
KT Forex Volume 지표
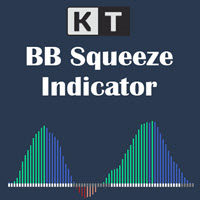
모멘텀이 확장되기 전 변동성 수축 확인 KT BB Squeeze는 변동성 상태와 모멘텀 방향을 하나의 선명한 오실레이터에 결합합니다. Bollinger Bands와 Keltner Channels를 비교하여 시장의 수축 또는 확장 상태를 표시하고, 히스토그램으로 제로선을 기준으로 한 모멘텀 변화를 보여 줍니다. 회색 점: Bollinger Bands가 Keltner Channels 안에 있으며 스퀴즈 또는 수축 구간을 나타냅니다. 흰색 점: Bollinger Bands가 Keltner Channels 밖에 있으며 확장 구간을 나타냅니다. 제로선을 기준으로 네 가지 모멘텀 상태 확인 색상 히스토그램은 방향과 강도를 구분하므로 상승 또는 하락 모멘텀이 강해지는지, 약해지기 시작하는지 쉽게 살펴볼 수 있습니다. 녹색 막대: 상승 모멘텀이 제로선 위에서 강해지고 있습니다. 파란색 막대: 상승 모멘텀이 제로선 위에 있지만 약해지고 있습니다. 빨간색 막대: 하락 모멘텀이 제로선 아래에서 강해지고
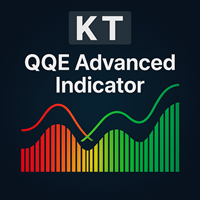
KT QQE Advanced 는 클래식 QQE 오실레이터를 색상 히스토그램과 빠른·느린 Trailing Line(TL) 로 재구성하여 더 정확하게 표현한 개선 버전입니다.
기존 QQE 와 달리, KT QQE Advanced 는 히스토그램 형태에 과매수/과매도 레벨을 표시해 추세의 과열 여부를 직관적으로 확인할 수 있습니다.
활용
MTF 스캐너로 모든 시간대에서 매수·매도 신호를 즉시 탐색. 트렌드 방향을 더욱 정확히 파악. 과매수·과매도 구간을 탐지. 가격 모멘텀을 가시화.
입력값 RSI 기간 스무딩 기간 MTF 스캐너 알림 설정
QQE란? QQE는 Quantitative Qualitative Estimation 의 약자로, 초‑스무딩 RSI 와 ATR 을 결합해 만든 오실레이터입니다. 일반 RSI 대신 Wilder RSI 를 사용하며, 이는 특수한 EMA 방식으로 평활화됩니다. Wilder 평활식 = 이전 MA + (1/n × (종가 − 이전 MA))
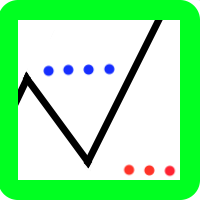
The indicator is a polyline (ZigZag segment) that tracks and connects the extreme points of the chart price that are at least a specified size apart from each other in points on the price scale.
The one and only setting is the minimum size (in points) of a ZigZag segment. The indicator displays levels to determine a possible trend reversal:
level "LevelForUp" - the breaking of this level determines the possible reversal of the trend up (to buy);
level " LevelForDown " - the breaking o
The ORB-Williams FPO trading robot is the result of combining different Opening Breakout Ranges including the Toby Crabel Opening Range Breakout (ORB) strategy with additional trending indicators for a better entry signal, with the Larry Williams First Profitable Opening (FPO) exit to close the trade. You can see the result of my real account operations in Signals: https://www.mql5.com/es/signals/1481106?source=Site +Signals+Favorites The Opening Range Breakout (ORB) is a range of price varia

Indicator of EARLY determination of the beginning of a new trend.
In addition, the indicator determines the global direction of the trend by the number of points: if there are more green dots (parameter Calculation of the global trend) - the trend is up; if there are more red dots, the trend is down.
The indicator does not redraw on the first candle.
The indicator can be used as an independent trading system, and as an addition to any other trading system.
The indicator can be used on any t
Ready trading strategy. The indicator shows price reversal points on the chart. In places of a possible price reversal, the indicator draws an arrow. If the indicator draws a green arrow, then the price will move up. If the indicator draws a red arrow, then the price will move down. The indicator also draws an average line on the chart. It is displayed in yellow. With a probability of 95%, if the indicator draws a green arrow, and the price is below the line, then in the near future the price w

Trading with the help of the MACD indicator has become even more convenient. Flexible settings will help you choose what you really need in your trading. Use the strategy that you need - the indicator uses 3 strategies. Download the demo right now! I recommend watching my advisor - Night Zen EA Subscribe to my telegram channel, link in my profile contacts - my profile See also my other products on mql5.com - my products Advantages of the indicator: In this indicator, the interpretation of th
FREE

OCTO TACK TREND INDICATOR
Summary/Description: Trend indicator showing signals to execute orders in favor of the current trend Get ready to have the best trend indicator you've ever tried. No repainting in any way, guaranteed It generates clear signals and always in favor of the trend (see screenshots) You just have to wait for the alert to indicate it and earn pip Are you tired of indicators that never work? Here we have the solution, try the free version and if you want to have more signals
FREE

OCTO TACK TREND PRO INDICATOR Summary/Description: Trend indicator Shows signals that tell you the current market trend Shows different signals to execute orders in favor of the current trend
Get ready to have the best trend indicator you've ever tried. It does not repaint in any way, once a signal has been captured, it remains there until it is finalized. It generates clear signals and always in favor of the trend (see screenshots) Just be attentive and wait for the alert to tell you when a ne

Attention!!! Do not try to test the EA in the MT4 Tester, it is simply impossible, because the EA opens positions on 27 different instruments and 8 timeframe . The tester is able to test only one pair. Multi-currency tester is possible only in MT5. Instructions for launching a multi-currency tester in MT5: https://youtu.be/WrQQwMQclrY How EA works: 1. The main strategy for the breakdown of local extremes is used. 2. An additional algorithm is used to control losing trades and redistribute

The Expert Advisor Risk Manager for MT4 is a very important tools for every trader, to manage his trading risk and keep the Balance safe.more than 60% of the Trader lose their investment because they don`t manage the risk very well. With the Risk Manager Expert Advisor, you will be able to control your risk in your trading account. Risk and profit control can be carried out both in monetary terms and in percentage terms.
For the Expert Advisor to work, simply attach it to the currency pa
An indicator for you follow the trend. We are providing a group of indicators that can support you decisions...
At this one you are having access to the trend indicator. Please review the others indicators for trend availables... That you give you the ability to understand the market flow and also you will be developing your pacience...
Trend the market as professional... We are using the Average True Range Indicator! Hope you enjoy.
An indicator for you follow the trend candles.
We are providing a group of indicators that can support your decisions...
At this one you are having access to the candle trend indicator. Please review the others indicators for trend availables...
That you give you the ability to understand the market flow and also you will be developing your pacience... Trend the market as professional...
We are using the Average True Range Indicator! Hope you enjoy.

The market eagle - it is a Secure Automated Software for trade Forex market and indices. This EA takes perspective of the market looking like an eagle. From a distance, observe the entire market amphitheater detecting the entry points and the best points to implement the algorithm based on the set that we indicate in the input.This system allows us to use the key points of the market to adapt them to our algorithms, trend and countertrend.The system uses multiple lot depending on the algorith
About the ChangePP indicator
The ChangePP indicator displays the percentage price change for the selected period according to the selected parameters and builds the corresponding bars in the indicator subwindow.
Clicking on a bar or pair name opens the corresponding chart with the period specified in the input parameters.
Without a doubt, the ChangePP trading indicator will be useful for traders using the correlation of currency pairs, as well as for analyzing the situation on the market.
FREE
StatBar 1.6 Indicator showing balance, earnings for today, yesterday and the day before yesterday. The indicator also shows: - Server; - GMT; - Server time; - Shoulder; - Spread.
Description of variables: extern int Magic = "-1"; // Magic for statistics -1 = all 0 = manual extern string Symboll = "-1"; // Symbol for statistics -1 = all 0 = current EURUSD = for EURUSD
FREE

Night scalping trading in the horizontal Bollinger channel. No risky strategies. All trades are protected by a stop loss. Accounting for the features of real accounts. It is possible to work with a minimum initial deposit of $10. Strategy. At night, near the rollover, market movements usually slow down, since at this time there are no strong disturbing factors. Price movements become small, but quite predictable. As a rule, they have the form of harmonic fluctuations. These movements can be used
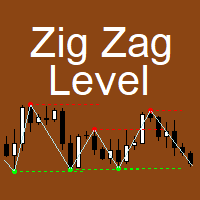
The indicator implements the author's approach to the construction of the popular "Zig-Zag" indicator.
The advantages of the "ZIgZag Level" indicator is that it filters out market noise and shows levels.
"ZIg Zag Level" is based on peaks and troughs, displays levels.
These levels can be disabled and configured.
The indicator displays the price of the level, the price tag can be disabled.
The "zigzag" line between the points can also be disabled.
The indicator has a built-in notification s

TrendMMK is an extremely simple indicator. The Buy and Sell signal changes as soon as the indicator flips over the closing price. When the TrendMMK closes below the Price, a Buy signal is generated, and when the TrendMMK closes above the Price, a Sell signal is generated.
TrendMMK is a trending indicator, and like all trending indicators it works well in trending markets. However, it does give lesser false signals than a lot of other indicators and hence if you are an intraday trader who want

Eakao is a trending following EA. This EA uses some custom indicators to detect entry signal. There are 2 trades opened per signal, one trade has fixed take profit, EA will use breakeven and trailing stop for another trade. The fixed stop loss and take profit are always set for each trade. Beside stop loss, this EA uses an exit indicator to exit the trade before stop loss or take profit are triggered. This EA has smart money management. Users only need to determine the accepted loss for each tr

Levels Pro System рассчитывает канал движения цены, учитывая волатильность инструмента, бары и тренд, - и на основании расчетных данных показывает тренд и чертит уровни поддержки/сопротивления в очень удобном визуальном представлении. В индикатор встроена система определения критических точек (критических баров), которая позволяет трейдеру значительно проще выявлять истинный пробой уровня, ложный пробой, отскок от уровня, возможный сигнал на ранней стадии движения цены итд. Таким образом, торгов

Grid trading is executed when orders are placed above or below a set price, creating a grid of orders with rising and falling prices. Our patented trader makes it possible to open new grids at the average price, thereby increasing the chances of recovering a negative floating balance.
Unlike other trading strategies, our focus is on decreasing Bollinger bands. This means that if the market has abruptly moved into a region and is weakening, it is more vulnerable to a reversal. This innovative a

ATR Scanner Pro is a multi symbol multi timeframe volatility scanner that monitors and analyzes Average True Range indicator value in up to 28 symbols and 9 timeframes in 3 modes : ATR value: As a volatility dashboard it shows the ATR indicator value in all pairs and timeframes and signals when the ATR value reaches a maximum or minimum in a given duration. Short term ATR/Long term ATR ratio: It shows ratio of 2 ATRs with different periods. It's useful in detecting short term volatility and e

Leave a review for this product, and receive another "Free" product that you want. You can see my other products here: https://www.mql5.com/en/users/zakri/seller
Grid Wizard EA has 4 built-in strategies that are really powerful. This EA is a winner EA. It can work on every symbol and timeframe, preferably H1.
Tests show it was profitable since 2010.
Entry Mode:
Both Directions, Same Basket - This strategy opens buy and sell trades at the same time, they are closed together.
Both Directions, S
Этот индикатор является уникальным в своём роде, больше всего подходит для скальпинга на XAUUSD а также для торговли на более старших таймфреймах!
Уведомление сообщит самые важные точки входа, поэтому следует торговать по тренду. Идеален для скальпинга! The Best Trend Signals - трендовый мультивалютный индикатор, может использоваться на любых финансовых инструментах валюта, криптовалюта, металлы, акции, индексы. Рекомендуемый тайм-фрейм M15, M30, H1, H4, D1.
Как торговать с помощью индикатора
FREE
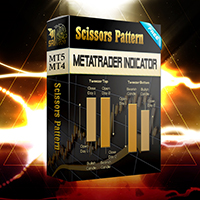
Configure scaffolding charts and signals based on the scissor pattern, which works great at low times.
Buy and sell signs based on 2 previous candle patterns
It works on the active time form, and when detecting the pattern in 4 time frames, 5 minutes, 15 minutes, 30 minutes and one hour, the alert can be set to notify us of the formation of this pattern.
MetaTrader version 5 click here
How to use:
When there is an opportunity to buy or sell, the marker places a scissors mark on the candlest
FREE

Представдяю вашему вниманию Trall StopLoss. Посмотрим что он умеет;)
#Order сразу выставляем в 0!!!
#Start это через сколько пунктов начнет срабатывать трал.
#Distance первая дистанция с которой начинает работать трал.
#DistanceTrall это стандартный трал, который просто смещает StopLoss на заданное количество пунктов.
#SL устанавливает StopLoss на заданное количества пунктов.
#MultiplicationTakeProfit устанавливает TakeProfit = SL*MultiplicationTakeProfit
#Trall а вот здесь начинается ин
FREE

Simple Strategy Checklist Panel, as its name suggests, is a panel that works as a checklist, and can place up to twenty lines of text. This was created for traders who want to have their trading plan or to-do list at hand, a simple but useful product for many.
I will write this pointless paragraph since Metatrader asks me to put a minimum of 6300 characters, so I also explain that the list can also be used to make purchases from the supermarket! Example bread, milk, flour and much more... Enjo
FREE

Super Turbo AI is a Multi Currency Trading Robot which has been carefully designed and rigorously tested for successful and consistent long term trading activities with each trade been potentially profitable. The over twelve years Optimization and back testing stages have both been well completed and default setting is best suited to the EURUSD pair. Attached also is the same EURUSD setting which can continually be used for months and even years to come (please visit the Comments section to dow

Slow trading, low risk low return strategy open position only buy no stoploss , option ea : close equity target, stop equity target. Take profit step by step. For minimum blance please download excel file, and try ea in demo account before purchase link download how our ea works is * Recommended free swap account (islamic account) * trading with own money * ea will open buy, the price goes down will buy again and so on ea will stop when the highest price is according to settings * floating min

DayNight HighLow is base on support and resistance levels, as well as averages of highs and lows. It detects trade direction and sends notification to your mobile phone so that you can enter/exit a trade without having to be seated in front of desktop computer all day and night. Although you have to execute/send an order yourself, you can setup rules through the setting made available for proper lots size base on the available balance/fund you are trading with. The opportunity to take a profit

DayNight moving averages along with support and resistance make a remarkable difference if properly utilized This indicator detects trade direction and sends notification to your mobile phone so that you can enter/exit a trade without having to be seated in front of desktop computer all day and night. Although you have to execute/send an order yourself, you can setup rules through the setting made available for proper lots size base on the available balance/fund you are trading with. The opport
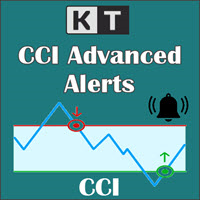
KT CCI Alerts is a personal implementation of the Commodity Channel Index (CCI) oscillator that provide signals and alerts on four custom events: When CCI enter in an overbought zone. When CCI exit from an overbought zone. When CCI enter in an oversold zone. When CCI exit from an oversold zone.
Features A perfect choice for traders who speculate the CCI movements within an overbought/oversold zone. Lightly coded without using extensive memory and resources. It implements all Metatrader alerts.

The Vortex Indicator was first presented by Douglas Siepman and Etienne Botes in January 2010 edition of Technical Analysis of Stocks & Commodities. Despite its based on a complex implosion phenomenon, the vortex is quite simple to interpret. A bullish signal is generated when +VI line cross above the -VI line and vice versa. The indicator is mostly used as a confirmation for trend trading strategies. The Vortex was inspired by the work of Viktor Schauberger, who studied the flow of water in tur

Time frame: M1
Leverage : Higher the better
Spread: Lower the better
Account type : All types
(EA may enter hedge positions, if you want to disable this feature deactivate either Buy, or Sell from the setting)
Please please do not take unnecessary risks. (Trading is risky, and there are no guarantees for winning)
We wish you successful trading. (Trading is risky, and there are no guarantees for winning
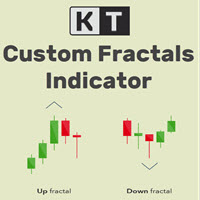
KT Custom Fractals is a personal implementation of the Fractal indicator first introduced by Bill Williams. With KT Custom Fractals you can choose a custom number of bars to allow to the left and right side of the fractal. For example, you can display the fractals that have "three" successive bars with the highest high in the middle and one lower high on both sides , or you can display the fractals that have "Eleven" consecutive bars with the lowest low in the middle and five higher lows on bot

KT Fractal Channel Breakout draws a continuous channel by connecting the successive Up and Down fractals. It provides alerts and also plots the Up and Down arrows representing the bullish and bearish breakout of the fractal channel.
Features
If you use Bill Williams fractals in your technical analysis, you must also include it in your trading arsenal. It can be very effective and useful for stop-loss trailing. A new market trend often emerges after a fractal channel breakout in a new direction.

EA only work XAGUSD symbol Slow trading, low risk low return strategy open position only buy no stoploss , option ea : close equity target, stop equity target. Take profit step by step. For minimum blance please download excel file, and try ea in demo account before purchase link download forex robot ea xagusd miner forex robot to generate profits with very low risk, such as owning a mine but does not require high-spec hardware which is very expensive, rather than buying mining hardware, it is

Time frame: M1
Leverage : Higher the better
Spread: Lower the better
Account type : All types
(EA may enter hedge positions, if you want to disable this feature deactivate either Buy, or Sell from the setting)
Please please do not take unnecessary risks. (Trading is risky, and there are no guarantees for winning)
We wish you successful trading. (Trading is risky, and there are no guarantees for winning

Time frame: M1
Leverage : Higher the better
Spread: Lower the better
Account type : All types
(EA may enter hedge positions, if you want to disable this feature deactivate either Buy, or Sell from the setting)
Please please do not take unnecessary risks. (Trading is risky, and there are no guarantees for winning)
We wish you successful trading. (Trading is risky, and there are no guarantees for winning
PV Super Trend Signals
- Detects Key Points of Reversals - Enters Trades at Key Points - Closes Trades at Accurate Levels
- Extremely accurate - Great for almost every currency - Amazing for EURUSD H1 - Backtested across many currencies over many years on many timeframes - H1 is the best timeframe - Can be used to make stable profit - Can be used to hedge other trading robots - ReInvest with Risk and Leverage features if desired - Backtested accurately across many currencies using tick data -
MACD Pro - Features a built-from-scratch overhauled MACD indicator - Signals Buy and Sell Zones - Uses an exceptional noise cancelling filter - Signals up trends and down trends - Precise and accurate signals
MACD Pro is an indicator built from the ground up and is designed to signal optimal buy and sell zones. Take buy trades in the buy zones and sell trades in the sell zones. It includes a noise cancelation feature which rivals the best products on the market.
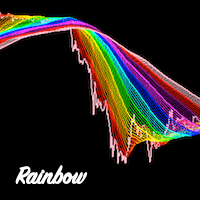
Rainbow Ribbon - Rainbow MA bands - Useful for spotting trend changes - Useful for spotting trend slopes - Useful for spotting trend acceleration - Ability to choose ribbon colors, moving averages, and distances - Provides colorful rainbow ribbons to show an array of moving averages
Rainbow Ribbon is an extremely useful indicator, it has been designed to make it easy to spot the trend and also changes within the trend before they occur. It can be used many different ways and provides the abili
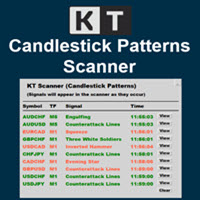
KT Candlestick Patterns Scanner is a Multi-Symbol and Multi-Timeframe scanner that fetches and shows various candlestick patterns on 28 currency pairs and 9 time-frames concurrently . The scanner finds the candlestick patterns by loading the KT Candlestick Patterns indicator as a resource in the background.
Features
The scanner can find the candlestick patterns on 252* combinations of symbols and time-frames from a single chart. Open the signal's chart loaded with a predefined template with a s
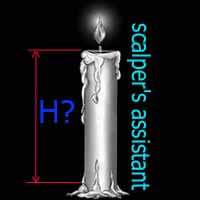
Индикатор "TakeOver" простой в использовании, создавался он для удобства определения разницы между открытием и закрытием текущей свечи. "TakeOver" рекомендуется применять в скальпинге с различными стандартными индикаторами МТ4, к примеру Envelopes, ZigZag, RSI и т.д. В настройках по умолчанию установлены уровни 200 и -200, но вы можете самостоятельно изменить. Один из примеров обнаружения входа в открытие сделки изображено на скриншоте, SELL если свеча закрылась выше уровня Envelopes и гистогра

Time frame: M1
Leverage : Higher the better
Spread: Lower the better
Account type : All types
(EA may enter hedge positions, if you want to disable this feature deactivate either Buy, or Sell from the setting)
Please please do not take unnecessary risks. (Trading is risky, and there are no guarantees for winning)
We wish you successful trading. (Trading is risky, and there are no guarantees for winning
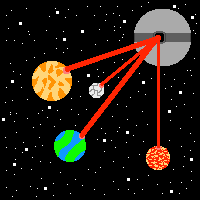
Starkiller Grid Trader Starkiller Grid Trader is a MT4 trading robot which specializes in the management of grid trading systems. A very large variety of customizable settings are included to make sure that you are able to place grid trades on any currency pair, stock, index or commodity automatically according to your own liking. Starkiller is accurate, versatile and robust. - Includes numerous grid trading settings - Includes the ability to select open/close indicators - Includes color coded

Time frame: M1
Leverage : Higher the better
Spread: Lower the better
Account type : All types
(EA may enter hedge positions, if you want to disable this feature deactivate either Buy, or Sell from the setting)
Please please do not take unnecessary risks. (Trading is risky, and there are no guarantees for winning)
We wish you successful trading. (Trading is risky, and there are no guarantees for winning

Hello all The expert works on the intersection of moving averages with a digital method of opening deals With closing deals on a profit of a number of points programmatically With opening deals with the trend and closing some deals together for a profit until all are closed together for a profit The expert works on regular candles. It is possible to experiment on the timing of five minutes, quarter-hour, half-hour or hour parameters:
Lot1: Manual Lot Size Auto_Lot: Set true to automatically ca

Time frame: M1
Leverage : Higher the better
Spread: Lower the better
Account type : All types
(EA may enter hedge positions, if you want to disable this feature deactivate either Buy, or Sell from the setting)
Please please do not take unnecessary risks. (Trading is risky, and there are no guarantees for winning)
We wish you successful trading. (Trading is risky, and there are no guarantees for winning

Sistema de trading automático adaptado a la volatilidad de la sesión de New York. Se basa en la ruptura de un rango de baja volatilidad con el objetivo de aprovechar diariamente el movimiento fuerte de la sesión americana. El sistema cuenta con parámetros de manejo de riesgo por porcentaje, parámetros de Stop Loss, Take Profit, Break Even, Tambien cuenta con parametro para cantidad de operaciones diarias y validación de entrada por cierre de vela o ruptura de precio.

Simple Order Panel for calculating actual lot size with fixed risk amount. Working on both Market orders and pending orders. Notify Line Application when an order is opened or closed. Automatic set up Stoploss and Takeprofit with Risk Reward Ratio. Open one order with the risk(amount) per trade or separate the bet into three orders in one click. Involuntary modification Stopsloss to Breakeven when the Market takes the first or second-order profit. Filter button Buy or Sell when Moving Averate C

Day Trader Master 는 데이 트레이더를 위한 완벽한 거래 시스템입니다. 시스템은 두 개의 지표로 구성됩니다. 하나의 지표는 매수 및 매도를 위한 화살표 신호입니다. 얻을 수 있는 화살표 표시기입니다. 2차 지표를 무료로 드립니다. 두 번째 지표는 이러한 화살표와 함께 사용하도록 특별히 설계된 추세 지표입니다. 표시기는 반복하지 않고 늦지 않습니다! 이 시스템을 사용하는 것은 매우 간단합니다. 2색 선으로 표시되는 현재 추세 방향의 화살표 신호를 따라가기만 하면 됩니다. 파란색은 구매 추세입니다. 빨간색은 판매 추세입니다. 파란색 화살표는 매수 신호입니다. 빨간색 화살표는 매도 신호입니다. 추세선의 색상과 일치하려면 화살표의 색상과 신호의 방향이 필요합니다. 화살표 표시기는 주로 시간 간격 M5 및 M15에서 일중 거래를 위해 만들어졌습니다. 그러나 기술적으로 시스템은 다른 시간 간격으로 사용할 수 있습니다. 표시기에는 PUSH 메시지 기능이 있는 팝업 경고가 장착되어 있

KT Auto SL TP EA는 모든 수동 거래에 손절매(스탑로스)와 이익실현(테이크프로핏)을 추가하고, 이후 손절매를 본전으로 옮긴 뒤 트레일링합니다. 컴퓨터나 휴대폰에서 거래를 여세요. 잠시 후 손절매와 이익실현이 설정되고, 차트의 라벨에 현재 사용 중인 설정이 정확히 표시됩니다. 이 EA는 스스로 거래를 열거나 닫지 않습니다. 주요 기능 시장가 거래와 대기 주문에 손절매와 이익실현을 추가합니다. 차트 종목만 관리하거나, 하나의 차트에서 모든 종목을 관리할 수 있습니다. 수동 거래만 관리하며 다른 EA의 거래는 건드리지 않습니다. 새 틱이 들어올 때만이 아니라 초당 약 7회 거래를 확인합니다. 대기 주문의 레벨은 주문 가격을 기준으로 설정되므로, 주문이 체결되는 순간 보호가 준비되어 있습니다. 브로커의 최소 스탑 레벨보다 작은 거리는 그 최솟값까지 넓힙니다. 본전(브레이크이븐)과 트레일링 스탑 거래가 설정한 수익에 도달하면 EA가 손절매를 진입 가격으로 옮깁니다. 선택 사항인 오

KT Coppock Curve는 평활화된 모멘텀 값을 시장 방향을 보기 쉬운 형태로 보여 줍니다. 가격 차트 아래의 별도 창에 표시되며, 제로 라인이 가장 중요한 기준이 됩니다. 곡선의 작은 변화마다 반응하는 대신 모멘텀이 상승 쪽에 있는지 하락 쪽에 있는지를 빠르게 확인할 수 있습니다. 이 곡선은 장기와 단기의 변화율을 결합한 뒤 결과를 평활화합니다. 따라서 빠른 오실레이터에서 자주 나타나는 노이즈를 어느 정도 줄이면서 더 큰 모멘텀 변화를 추적하는 데 유용합니다. 먼저 위치를 보고 그다음 교차를 확인하세요 곡선이 제로 위에 있으면 양의 모멘텀이 우세합니다. 제로 아래에 있으면 음의 모멘텀이 우세합니다. 곡선이 제로 라인의 한쪽에 계속 머무르면 캔들 하나마다 관점을 바꾸지 않고 현재의 방향 압력에 맞춰 거래하는 데 도움이 됩니다. 제로 라인을 위로 돌파하면 위쪽 화살표가 표시되고, 아래로 돌파하면 아래쪽 화살표가 표시됩니다. 정확한 교차 지점을 눈으로 판단하지 않아도 새로운 모멘텀

지표는 여러 쌍의 스프레드를 동시에 모니터링하는 스프레드 스크리너를 제공하며 캔들 타이머 카운트다운은 현재 막대가 닫히고 새로운 막대가 형성되기까지 남은 시간을 표시합니다.
기간 한정 제공: 당사의 모든 프리미엄 지표는 단 50$에 제공됩니다. MQL5 블로그에 액세스하면 프리미엄 지표에 대한 모든 세부 정보를 찾을 수 있습니다. 여기를 클릭하세요.
주요 특징들 동시에 확산되는 다중 쌍을 모니터링합니다. 현지 시간이 아닌 서버 시간을 추적합니다. 구성 가능한 텍스트 색상 및 글꼴 크기 CPU 사용량을 줄이기 위해 최적화 개인화 된 쌍 목록.
연락하다 질문이 있거나 도움이 필요하면 비공개 메시지를 통해 저에게 연락하십시오.
경고 경고 모든 지표와 도구는 공식 Metatrader Store( MQL5 Market )를 통해서만 사용할 수 있습니다.
작가 SAYADI ACHREF, 핀테크 소프트웨어 엔지니어이자 Finansya의 설립자
FREE

Expert Advisor는 여러 상품을 거래하여 추세 반전을 감지하도록 설계되었습니다.
여기에 사용된 알고리즘은 시장의 모든 주요 기호에서 신경망을 기반으로 추세를 정확하게 감지하고 진입 및 퇴장 신호를 생성합니다.
Expert Advisor는 공격적인 관리와 거래 방식을 가지고 있어 단기간에 큰 수익을 얻을 수 있습니다.
설정은 $ 1000의 최소 보증금을 위해 설계되었습니다.. $ 선호 금액 2500
거래 기간은 M15 / H1 / H4 / D1입니다.
• 최소 보증금 1000 $(거래 쌍당)
• 최소한의 미끄러짐을 가진 브로커.
• 모든 유형의 계정
• 레버리지 1: 100 이상
• 설정 및 사용이 매우 간편함
Expert Advisor는 여러 상품을 거래하여 추세 반전을 감지하도록 설계되었습니다.
여기에 사용된 알고리즘은 시장의 모든 주요 기호에서 신경망을 기반으로 추세를 정확하게 감지하고 진입 및 퇴장 신호를 생성합니다.
Expert Ad
FREE
이중 라인 신호, 제로 레벨 시스템, 멀티 타임프레임 지원, 사용자 지정 시각적 신호 및 고도로 구성 가능한 알림 시스템을 갖춘 고급 상대 활력 지수(RVI) 지표.
프리랜서 프로그래밍 서비스, 업데이트 및 기타 TrueTL 제품은 제 MQL5 프로필 에서 이용 가능합니다.
피드백과 리뷰는 매우 감사히 받겠습니다!
상대 활력 지수(RVI)란? 상대 활력 지수(RVI)는 John Ehlers가 개발한 모멘텀 오실레이터로, 거래 범위로 정규화하여 시가 대비 종가의 상대적 관계를 비교함으로써 최근 가격 움직임의 확신도를 측정합니다. 기본 원리는 강세 시장에서는 종가가 시가보다 높아지는 경향이 있고, 약세 시장에서는 반대가 성립한다는 것입니다. RVI는 제로 라인 주위를 진동합니다 — 양수 값은 강세 모멘텀을, 음수 값은 약세 모멘텀을 나타냅니다. 지표는 두 개의 라인으로 구성됩니다: 메인 라인(RVI 값)과 시그널 라인(메인 라인의 4봉 대칭 가중 이동 평균). 두 라인 간의 교차는
FREE
MetaTrader 마켓은 과거 데이터를 이용한 테스트 및 최적화를 위해 무료 데모 거래 로봇을 다운로드할 수 있는 유일한 스토어입니다.
어플리케이션의 개요와 다른 고객의 리뷰를 읽어보시고 터미널에 바로 다운로드하신 다음 구매 전 트레이딩 로봇을 테스트해보시기 바랍니다. 오직 MetaTrader 마켓에서만 무료로 애플리케이션을 테스트할 수 있습니다.
