 MetaTrader 5
 Experts
 지표
 라이브러리
 유틸리티
 위젯
 규칙
MetaTrader 4용 새 Expert Advisor 및 지표 - 197
 트레이딩 로봇은 자동으로 시장거래를 수행하는 반면 지표는 가격을 더 잘 분석하고 가격 행동을 예측할 수 있게 해줍니다.
이러한 어플리케이션을 사용하면 MetaTrader 4에서 더 많은 기회를 포착하는 동시에 보다 정보에 입각한 방식으로 거래를 수행할 수 있습니다.

The Vortex Indicator was first presented by Douglas Siepman and Etienne Botes in January 2010 edition of Technical Analysis of Stocks & Commodities. Despite its based on a complex implosion phenomenon, the vortex is quite simple to interpret. A bullish signal is generated when +VI line cross above the -VI line and vice versa. The indicator is mostly used as a confirmation for trend trading strategies. The Vortex was inspired by the work of Viktor Schauberger, who studied the flow of water in tur

Time frame: M1
Leverage : Higher the better
Spread: Lower the better
Account type : All types
(EA may enter hedge positions, if you want to disable this feature deactivate either Buy, or Sell from the setting)
Please please do not take unnecessary risks. (Trading is risky, and there are no guarantees for winning)
We wish you successful trading. (Trading is risky, and there are no guarantees for winning
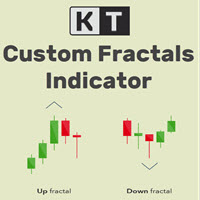
KT Custom Fractals is a personal implementation of the Fractal indicator first introduced by Bill Williams. With KT Custom Fractals you can choose a custom number of bars to allow to the left and right side of the fractal. For example, you can display the fractals that have "three" successive bars with the highest high in the middle and one lower high on both sides , or you can display the fractals that have "Eleven" consecutive bars with the lowest low in the middle and five higher lows on bot

KT Fractal Channel Breakout draws a continuous channel by connecting the successive Up and Down fractals. It provides alerts and also plots the Up and Down arrows representing the bullish and bearish breakout of the fractal channel.
Features
If you use Bill Williams fractals in your technical analysis, you must also include it in your trading arsenal. It can be very effective and useful for stop-loss trailing. A new market trend often emerges after a fractal channel breakout in a new direction.

Some disadvantages of Rollover Scalper: Currently the markets aren't that favorable for night scalping because of the fundamentals, so the next few months the EA might show 0% or even negative return. However, it happened in the past too and it was still profitable over all ~20 years. It's a scalper, so you'll need a broker with low spread and good execution time, preferably an ECN broker. ICMarkets would be a good choice. It's susceptible to slippage (which can't be backtested or limited on ECN

Make your Passive Income DREAM a Reality !! Let our intelligent EA(Expert Advisor) take care of your portfolio 24/7. You no longer need to watch your portfolio all day waiting to the trading moment the EA will do it for you. Let CODENoah Earth be your ANSWER to every life-style you desire. Designed for Technical and Algorithmic Trading The HIGH intelligent EA: CODENoah Earth , that will only trade when there a chance of profit and cut loss immediately when you balance is lost to a certain point

1. Стрелочный индикатор. 2. Для анализа использует несколько скользящих средних на разных таймфреймах и соотносит их с важными уровнями цены. 3. Не перерисовывает стрелку, т.к. использует для расчета фиксированное количество исторических данных. 4. Пример работы индикатора приведен на скриншотах. 5. Показывает отличные результаты на всех валютных парах на таймфрейме от H 1 и выше. 6. Не требует оптимизации.

Day Trader Master 는 데이 트레이더를 위한 완벽한 거래 시스템입니다. 시스템은 두 개의 지표로 구성됩니다. 하나의 지표는 매수 및 매도를 위한 화살표 신호입니다. 얻을 수 있는 화살표 표시기입니다. 2차 지표를 무료로 드립니다. 두 번째 지표는 이러한 화살표와 함께 사용하도록 특별히 설계된 추세 지표입니다. 표시기는 반복하지 않고 늦지 않습니다! 이 시스템을 사용하는 것은 매우 간단합니다. 2색 선으로 표시되는 현재 추세 방향의 화살표 신호를 따라가기만 하면 됩니다. 파란색은 구매 추세입니다. 빨간색은 판매 추세입니다. 파란색 화살표는 매수 신호입니다. 빨간색 화살표는 매도 신호입니다. 추세선의 색상과 일치하려면 화살표의 색상과 신호의 방향이 필요합니다. 화살표 표시기는 주로 시간 간격 M5 및 M15에서 일중 거래를 위해 만들어졌습니다. 그러나 기술적으로 시스템은 다른 시간 간격으로 사용할 수 있습니다. 표시기에는 PUSH 메시지 기능이 있는 팝업 경고가 장착되어 있

Market Trend Catcher indicator analyzes the duration of trend movements and, with a certain development of the current trend, offers market entry points in the form of arrows with recommended profit targets. The indicator is very easy to use and does not require a lot of information to understand how it works. It has a minimum of settings and is transparent in understanding the principle of its operation, fully displaying the information on the basis of which it makes decisions on recommending e

KT Coppock Curve는 평활화된 모멘텀 값을 시장 방향을 보기 쉬운 형태로 보여 줍니다. 가격 차트 아래의 별도 창에 표시되며, 제로 라인이 가장 중요한 기준이 됩니다. 곡선의 작은 변화마다 반응하는 대신 모멘텀이 상승 쪽에 있는지 하락 쪽에 있는지를 빠르게 확인할 수 있습니다. 이 곡선은 장기와 단기의 변화율을 결합한 뒤 결과를 평활화합니다. 따라서 빠른 오실레이터에서 자주 나타나는 노이즈를 어느 정도 줄이면서 더 큰 모멘텀 변화를 추적하는 데 유용합니다. 먼저 위치를 보고 그다음 교차를 확인하세요 곡선이 제로 위에 있으면 양의 모멘텀이 우세합니다. 제로 아래에 있으면 음의 모멘텀이 우세합니다. 곡선이 제로 라인의 한쪽에 계속 머무르면 캔들 하나마다 관점을 바꾸지 않고 현재의 방향 압력에 맞춰 거래하는 데 도움이 됩니다. 제로 라인을 위로 돌파하면 위쪽 화살표가 표시되고, 아래로 돌파하면 아래쪽 화살표가 표시됩니다. 정확한 교차 지점을 눈으로 판단하지 않아도 새로운 모멘텀

Expert Advisor는 여러 상품을 거래하여 추세 반전을 감지하도록 설계되었습니다.
여기에 사용된 알고리즘은 시장의 모든 주요 기호에서 신경망을 기반으로 추세를 정확하게 감지하고 진입 및 퇴장 신호를 생성합니다.
Expert Advisor는 공격적인 관리와 거래 방식을 가지고 있어 단기간에 큰 수익을 얻을 수 있습니다.
설정은 $ 1000의 최소 보증금을 위해 설계되었습니다.. $ 선호 금액 2500
거래 기간은 M15 / H1 / H4 / D1입니다.
• 최소 보증금 1000 $(거래 쌍당)
• 최소한의 미끄러짐을 가진 브로커.
• 모든 유형의 계정
• 레버리지 1: 100 이상
• 설정 및 사용이 매우 간편함
Expert Advisor는 여러 상품을 거래하여 추세 반전을 감지하도록 설계되었습니다.
여기에 사용된 알고리즘은 시장의 모든 주요 기호에서 신경망을 기반으로 추세를 정확하게 감지하고 진입 및 퇴장 신호를 생성합니다.
Expert Ad
FREE

Advisor 뉴스 거래의 경우 Advisor는 설정된 시간에 뉴스 이전에 보류 주문을 배치합니다!!! 임계값은 현재 가격과의 거리입니다. 보류가 실행되면 시장 주문이 열리고 반대쪽 보류는 두 배로 증가합니다. 단 3주기만 증가합니다! 테이크와 스톱은 테이크 오더가 스톱 오더의 마이너스를 커버하는 방식으로 계산되며 결과적으로 총계 + !!!를 얻게 됩니다.
상황의 1개 모델, 첫 번째 로트는 0.01입니다(예: 판매). 예를 들어 테이크와 같이 한 방향으로 무반동 움직임이 있는 경우 +를 얻습니다. 상황의 모델 2: 첫 번째 매도 주문이 0.01 개시되고 가격이 롤백되어 캐치됩니다(두 번째 구매 중지 지연). 증가된 로트가 개시됩니다. 0.02 구매 가격이 테이크에 도달하고 여전히 총계를 얻습니다. 상황의 세 번째 모델, 첫 번째 주문이 개설되어 0.01 매도하고 가격이 롤백되어 포착됩니다(2차 구매 중지 지연). 0.02의 증가된 로트가 개설되고 가격이 다시 반전되
FREE

지표는 여러 쌍의 스프레드를 동시에 모니터링하는 스프레드 스크리너를 제공하며 캔들 타이머 카운트다운은 현재 막대가 닫히고 새로운 막대가 형성되기까지 남은 시간을 표시합니다.
기간 한정 제공: 당사의 모든 프리미엄 지표는 단 50$에 제공됩니다. MQL5 블로그에 액세스하면 프리미엄 지표에 대한 모든 세부 정보를 찾을 수 있습니다. 여기를 클릭하세요.
주요 특징들 동시에 확산되는 다중 쌍을 모니터링합니다. 현지 시간이 아닌 서버 시간을 추적합니다. 구성 가능한 텍스트 색상 및 글꼴 크기 CPU 사용량을 줄이기 위해 최적화 개인화 된 쌍 목록.
연락하다 질문이 있거나 도움이 필요하면 비공개 메시지를 통해 저에게 연락하십시오.
경고 경고 모든 지표와 도구는 공식 Metatrader Store( MQL5 Market )를 통해서만 사용할 수 있습니다.
작가 SAYADI ACHREF, 핀테크 소프트웨어 엔지니어이자 Finansya의 설립자
FREE
이중 라인 신호, 제로 레벨 시스템, 멀티 타임프레임 지원, 사용자 지정 시각적 신호 및 고도로 구성 가능한 알림 시스템을 갖춘 고급 상대 활력 지수(RVI) 지표.
프리랜서 프로그래밍 서비스, 업데이트 및 기타 TrueTL 제품은 제 MQL5 프로필 에서 이용 가능합니다.
피드백과 리뷰는 매우 감사히 받겠습니다!
상대 활력 지수(RVI)란? 상대 활력 지수(RVI)는 John Ehlers가 개발한 모멘텀 오실레이터로, 거래 범위로 정규화하여 시가 대비 종가의 상대적 관계를 비교함으로써 최근 가격 움직임의 확신도를 측정합니다. 기본 원리는 강세 시장에서는 종가가 시가보다 높아지는 경향이 있고, 약세 시장에서는 반대가 성립한다는 것입니다. RVI는 제로 라인 주위를 진동합니다 — 양수 값은 강세 모멘텀을, 음수 값은 약세 모멘텀을 나타냅니다. 지표는 두 개의 라인으로 구성됩니다: 메인 라인(RVI 값)과 시그널 라인(메인 라인의 4봉 대칭 가중 이동 평균). 두 라인 간의 교차는
FREE

Traders Toolbox Overwatch - 실행 중인 모든 Traders Toolbox 에 대한 모니터링 유틸리티입니다.
모든 Traders Toolbox Running 차트에 대한 간단한 차트 전환 유틸리티이자 시장 감시입니다.
특징:
1. 사용자 정의 가능한 버튼 색상, 행 및 열.
2. 세 가지 신호 유형(보유 - 황색 / 매도 - 적색 / 매수 - 녹색)
3. Traders Toolbox 의 새 인스턴스 또는 종료된 인스턴스에 따라 버튼 목록을 동적으로 업데이트합니다.
4. 단일 클릭 버튼은 관련 차트를 전경으로 가져옵니다.
5. 매수 및 매도 신호는 Traders Toolbox 차트 신호와 일치하는 백분율로 신호 강도를 표시합니다.
참고: 유틸리티는 Traders Toolbox / Traders Toolbox Lite 와 함께만 사용할 수 있으며 독립적으로 작동할 수 없습니다

지금 어느 외환 세션에서 거래하고 있는지, 그리고 각 세션이 몇 pips 움직였는지 MetaTrader 4 차트에서 바로 확인하세요. KT Forex Sessions MT4는 도쿄, 런던, 뉴욕 세션을 색깔 박스로 그리고, 각 세션의 크기를 pips로 해당 박스 위에 적어 주는 세션 지표입니다. 지표가 브로커의 GMT 오프셋을 스스로 읽고, 각 세션은 해당 도시의 현지 시간과 서머타임을 따릅니다. 박스는 일 년 내내 올바른 위치에 있으며, 설정할 것이 없습니다. 차트에서 보이는 것 모든 박스 위의 pips: 거래하는 모든 통화쌍에서 조용한 세션과 활발한 세션을 한눈에 구별할 수 있습니다. 시간대 환산이 필요 없음: 찾아볼 GMT 오프셋도 없고, 봄과 가을에 시계가 바뀔 때 바꿀 것도 없습니다. 겹치는 시간은 별도의 박스로: 런던과 뉴욕이 동시에 열려 있는 시간에는 별도의 보라색 박스가 있습니다. 열려 있는 세션은 실시간으로 커짐: 세션이 끝날 때까지 박스가 새로운 고점과 저점을 따라
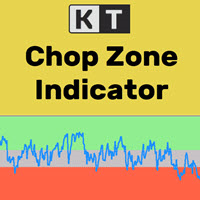
금융 시장은 약 30%의 시간 동안에만 뚜렷한 추세를 형성하고, 나머지 70%의 시간 동안은 횡보 구간에서 움직이는 것이 잘 알려진 사실입니다. 그러나 대부분의 초보 트레이더는 시장이 현재 추세 중인지, 아니면 박스권(횡보) 상태인지 판단하기 어렵습니다. KT Chop Zone은 이러한 문제를 해결해줍니다. 시장의 상태를 시각적으로 세 가지 구역으로 나누어 표시합니다: 하락 구간, 상승 구간, 그리고 Chop Zone (횡보 구간)입니다.
기능
횡보장에서의 거래를 피함으로써 즉시 거래 품질을 향상시킬 수 있습니다. 출구 신호로도 사용할 수 있습니다. 예를 들어, 매수 포지션이 Chop Zone에 진입하면 포지션을 정리할 수 있습니다. 전문가용 자동매매(EA)와 완벽하게 호환됩니다. EA에 쉽게 추가하여 전략을 개선할 수 있습니다. 모든 MetaTrader 알림 기능이 포함되어 있습니다.
입력 파라미터 메인 기간: 오실레이터에 사용하는 정수 값입니다. 권장 값은 10에서 30 사
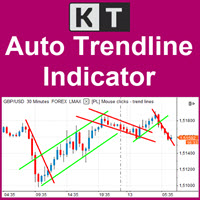
중요한 추세선을 차트에서 자동으로 업데이트 KT Auto Trendline은 최근 ZigZag 스윙 포인트를 바탕으로 상단과 하단 추세선을 자동으로 만들고 현재 차트의 미래 방향으로 두 선을 연장합니다. 같은 선을 반복해서 직접 그리지 않아도 형성 중인 돌파, 반응, 가격 방향 변화를 명확한 구조로 살펴볼 수 있습니다. 가까운 구조와 더 넓은 스윙을 함께 확인 첫 번째 추세선 세트는 기본으로 활성화되며 반응성이 높은 ZigZag 설정을 사용합니다. 더 넓은 시야가 필요하면 두 번째 세트를 켜서 별도의 민감도를 가진 상단 및 하단 추세선 한 쌍을 추가할 수 있습니다. 한 차트에서 가까운 가격 구조와 더 큰 시장 스윙을 비교하기 좋습니다. 각 추세선 세트의 반응 방식 조절 Show First Trendline: 기본 상단 및 하단 연장 추세선을 표시하거나 숨깁니다. Depth, Deviation, Back Step: 첫 번째 ZigZag 세트가 스윙 포인트를 찾는 방식을 조절합니다. S

ROC는 현재 가격이 이전 기간에 비해 얼마나 빠르게 변했는지를 측정합니다. 따라서 가격이 새로운 스윙 고점이나 저점을 만들었지만 그 움직임을 뒷받침하는 모멘텀이 따라오지 않을 때 특히 유용합니다. KT ROC Divergence는 이런 불일치를 자동으로 찾아 가격 차트와 ROC 창에 서로 대응하는 선을 표시합니다. 고정된 범위 안에서 움직이는 오실레이터와 달리 ROC는 시장의 속도에 따라 값의 폭이 커지거나 작아집니다. 서로 다른 종목의 절대 수치를 비교할 필요는 없습니다. 중요한 정보는 가격 스윙과 오실레이터 스윙 사이의 관계입니다. 트레이더의 언어로 보는 네 가지 패턴 일반 상승 다이버전스: 가격은 더 낮은 저점을 만들지만 ROC는 더 높은 저점을 만듭니다. 가격이 더 내려갔더라도 매도 모멘텀이 약해지고 있을 수 있습니다. 일반 하락 다이버전스: 가격은 더 높은 고점을 만들지만 ROC는 더 낮은 고점을 만듭니다. 가격이 여전히 오르는 동안 매수 모멘텀이 약해지고 있을 수 있습니

Professional forex robot scalper. The robot opens within one day from 1 to 5 trading orders. Each order is insured by StopLoss and TakeProfit. After opening an order, the robot accompanies it with the help of TrailingStop (StopLoss is constantly tightened following the price to reduce the risk of loss and bring the trade into profit). Each open order is constantly analyzed using a special virtual order management module. This module, with the arrival of each new tick, constantly analyzes open o

An equity protection EA for MetaTrader that enforces your loss limits and profit target for you: when your account reaches a rule you set, it closes your trades on every symbol, before one bad day turns into a lost account. It suits prop firm challenges and personal accounts alike. Attach it to one chart, answer a few questions in the on-chart setup wizard, and it watches your whole account in the background while you trade by hand or with other EAs. What it protects Daily loss limit: a percenta

Transition Angle is an arrow indicator for identifying potential entry points. I like it, first of all, because it has a simple mechanism of work, adaptation to all time periods and trading tactics. Suitable for trading on low timeframes because it ignores sudden price spikes or corrections in price action by reducing market noise around the average price. Works on all currency pairs and on all timeframes. Ready trading system. Take Profit is bigger than Stop Loss! Works on all currency pairs an

The Request indicator shows periods of steady market movement. The indicator shows favorable moments for entering the market. The intelligent algorithm of the indicator determines the trend, filters out market noise and generates trend movement signals. You can use the indicator as the main one to determine the trend. The indicator can work both for entry points and as a filter. Uses two options for settings. The indicator uses color signaling: red - when changing from descending to ascending, a

Forex indicator Storm Genezzis is a real trading strategy with which you can achieve the desired results. As soon as the Storm Genezzis indicator is installed, the main indicators at the price of the traded pair will immediately begin to be recalculated, based on the postulates of technical analysis. In addition, when potential entry points are detected, visual indicators in the form of arrows are shown in the terminal, which is convenient because it allows you to be aware of when it is profita

If you do not yet have your own trading strategy, you can use our ready-made trading strategy in the form of this indicator. The Bullfighting indicator tracks the market trend, ignoring sharp market fluctuations and noise around the average price, filters out market noise and generates entry and exit levels. The indicator shows potential market reversal points. Works on all currency pairs and on all timeframes. Simple, visual and efficient trend detection. It will help in finding entry points in

The main use of the Predominant indicator is to generate buy and sell signals. The indicator tracks the market trend, ignoring sharp market fluctuations and noises around the average price. I like it, first of all, because it has a simple mechanism of work, adaptation to all time periods and trading tactics. Created on the basis of a regression channel with filters. We display the signals of the Predominant indicator on the chart of the price function using a mathematical approach.
You can tra
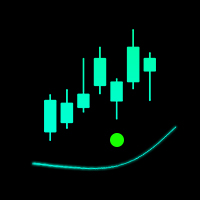
The indicator is designed for fast scalping. The principle of operation of the indicator is based on the direction of the Moving Average.
The period and sensitivity of the Moving Average can be adjusted for yourself in the indicator settings. I recommend watching my advisor - Night Zen EA
Subscribe to my telegram channel, link in my profile contacts. Advantages of the indicator: The free version is full, there are no additional purchases The arrows are not redrawn, the signal comes after co
FREE

The Analytical cover trend indicator is a revolutionary trend trading and filtering solution with all the important features of a trend tool built into one tool! The Analytical cover indicator is good for any trader, suitable for any trader for both forex and binary options. You don’t need to configure anything, everything is perfected by time and experience, it works great during a flat and in a trend.
The Analytical cover trend indicator is a tool for technical analysis of financial markets
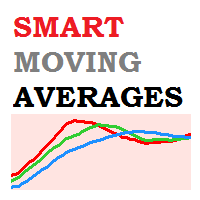
Smart Moving Averages Indicator Smart Moving Averages is an exclusive indicator for Metatrader platform.
Instead of calculating moving averages for the selected chart time frame, the Smart Moving Averages indicator gives you the opportunity to calculate moving averages independently from the chart time frame.
For instance you can display a 200 days moving average in a H1 chart.
Inputs of the indicator are:
Timeframe : timeframe to be used for the calculation of the moving average Period : m

The indicator shows the current situation on 16 indicators and 10 strategies.
Its values are formed based on the evaluation of the specified criteria for each strategy separately.
As a result, we can observe on the chart the strength of all the indicators included in it, as well as additional logic. Advantages: Signals do not redraw their values. The arrow is drawn after confirmation. All types of alerts. Shows weak zones based on the evaluation results. The passing value of the score is dete
FREE

OBOS indicator OBOS Indicator is an exclusive indicator to spot entries based on price action.
The OBOS Indicator is both effective and user friendly.
Indicator uses simple color codes and levels to indicate Overbought and Oversold conditions. No more headache.
The OBOS Indicator will only gives you indication when there are possible entries. Means you only get useful information.
Inputs of the indicator are:
MaxBars : number of bars to display in your chart Smoothing period : number of ba

Volume profile indicator that tells you which levels price is likely to reach today. Daily profiles with POC, VAH and VAL, naked POCs and a drag box for any range, and every level labelled with how often price reached a level at that distance on your own chart. What you see on the chart A profile for every day on M1 to H1 charts, with the value area in a stronger colour. Yesterday's POC, VAH and VAL across today, each with its odds for today, or "reached" once price gets there. Naked POCs: earli
Buy Sell Signal Low TF gives buy/sell signals and alerts with up and down arrow at potential reversal of a pullback or a trend continuation pattern in low timeframe. This is an indicator which gives signals based on trend => It works best in trend market with the principle is to ride on the trend not trade against the trend.
The components of Buy Sell Signal Low TF: - The trend is determined by SMMA 13 , SMMA 21 and SMMA 35 ( can be changed manually to suit your preference). - The signal is b
FREE

The Quality trend indicator expresses the ratio of the strength of a trend or the speed of its growth (fall) to the degree of its noisiness or a certain norm of amplitudes of chaotic fluctuations of a growing (falling) price. The position of the indicator line above zero shows an increasing trend, below zero - a falling trend, the fluctuation of the indicator line near zero shows a flat. If the indicator line begins to fluctuate rapidly around zero and approach it, then this indica

Superdog Pro is a fully automated trading robot on mainly EURUSD. Its minimum deposit required is only 500 USD. It utilises a dynamic grid system that prioritises to avoid large floating drawdowns. With its priority on minimizing drawdowns, it closes trades when it detects potential danger in the market. Unlike most of the other grid/martingale strategies which have to wait til the market rebounces to an extent that results in profitable trades, Superdog Pro's dynamic innovative TP/SL mechanism

Trend Direction Up Down indicator Trend Direction Up Down is part of a series of indicators used to characterize market conditions.
Almost any strategy only works under certain market conditions.
Therefore it is important to be able to characterize market conditions at any time: trend direction, trend strength, volatility.
Trend Direction Up Down is an indicator to be used to characterize trend direction (medium term trend):
trending up trending down ranging Trend Direction Up Down is based

Market Momentum Alerter Market Momentum Alerter will inform you about danger to operate in the market.
Imagine you see a very nice setup (Forex, Stocks, Indices) and you decide to place your trade...
And you finally lose your trade and don't understand what happened.
This can happen due to big operations in the market carried out by banks and big institutions.
These operations are invisible for most people.
Now with the Market Momentum Alerter you will be able to detect those operations...
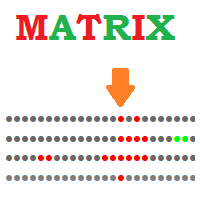
Matrix Indicator Matrix Indicator is a simple but effective indicator.
Matrix indicator displays usual oscillators indicators in a user friendly color coded indicator.
This makes it easy to identify when all indicators are aligned and spot high probability entries.
Inputs of indicator are:
Indicator: RSI, Stochastic, CCI, Bollinger Bands Param1/Param2/Param3: usual settings for the indicator ValueMin: Oversold level for oscillator ValueMax: Overbought level for oscillator The indicator can

Signals are not redrawn! All signals are formed on the current bar. The Cci Rsi Arrows MTF indicator is based on two indicators CCI and RSI. Represents entry signals in the form of arrows.
All signals in the MTF mode correspond to the signals of the period specified in the MTF. It is maximally simplified in use both for trading exclusively with one indicator, and for using the indicator as part of your trading systems. The peculiarity of the indicator is that the timeframe of the indicator ca

Professional robot Move reliably , which implements the classic MACD trading strategy. The signal from the intersection of the signal line with the main MACD line. When the signal line crosses the main line from top to bottom, it will be a buy signal, if the signal line crosses the main line from bottom to top, it will be a sell signal. In other cases, the absence of a signal will be recorded. Also, the signal can be inverted. The principle of operation is very simple and reliable. Gives a sm
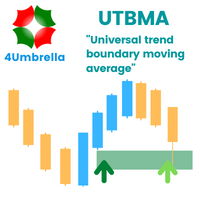
Indicator MT4 : UTBMA (Universal trend boundary moving average)
Objective: To track price trends and price reversals.
How to set up Indicator UTBMA : 1. The standard value is SMA 20 and SMA 50, you can set it as you like. 2. UTBx 14 is Universal Trend Boundary Index, standard value 14. 3. UTBx Method is a method for calculating the standard value is Exponential.
Meaning of symbols in indicators : 1. The line of the green group means the trend is up. 2. The line of the red group represents a d
The indicator is a trading system for AUDUSD or NZDUSD currency pairs.
The indicator was developed for time periods: M15, M30.
At the same time, it is possible to use it on other tools and time periods after testing.
"Kangaroo Forex" helps to determine the direction of the transaction, shows entry points and has an alert system.
When the price moves in the direction of the transaction, the maximum length of the movement in points is displayed.
The indicator does not redraw, all actions occur a
Trend Direction ADX indicator for MT4 Trend Direction ADX is part of a series of indicators used to characterize market conditions.
Almost any strategy only work under certain market conditions.
Therefore it is important to be able to characterize market conditions at any time: trend direction, trend strength, volatility, etc..
Trend Direction ADX is an indicator to be used to characterize trend direction:
trending up trending down ranging Trend Direction ADX is based on ADX standard indicator

Trend Strength MA indicator Trend Strength MA is a part of a series of indicators used to characterize market conditions.
Almost any strategy only works under certain market conditions.
Therefore, it is important to be able to characterize market conditions at any time: trend direction, trend strength, volatility, etc.
Trend Strength MA is an indicator to be used to characterize trend strength:
Up extremely strong Up very strong Up strong No trend Down strong Down very strong Down extremely stro

Ichimoku Master EA is a fully automated Expert Advisor for trading according to Ichimoku Kinko Hyo Strategy. The signals used to start trading are very well filtered, and then a special algorithm makes sure to stay in the trend as long as possible.
Ichimoku Master EA Settings
Features
Martingale, Grid, Averaging or other dangerous techniques are not used Trend following strategy Limitation of distance between same direction orders Hard and Virtual Take Profit and Stop Loss levels Basket TP

Ofir Dashboard is the first level of the Ofir trading solutions. We are building the first full trading application from Telegram. The Dashboard is focused on giving you the best information about your account, positions, risk,... when you are away from keyboard. Everything is accessible from Telegram. More info in my Blog Enjoy!
Ofir Notify, our very successful application for sending Notifications to Telegram (chat, channels, groups) is included in Ofir Dashboard.

Hi traders, I'm glad to bring to you the market analysis tool called "Infinity Trend Indicator". The main goal of this indicator is to help you figure-out the beginning of a new trend and the end of the trend current trend. NOTE: THIS INDICATOR DOESN'T REPAINT!! How to use this Indicator 1. Based on the Infinity trend indicator only We look to buy when the yellow line is pointing or curving up after a strong bearish move We look to sell when the yellow line is pointing or curving downward aft
A simple and effective trend indicator. It will be a good assistant when trading. A minimum of understandable settings. Put it on a chart and set it up Good to combine with other indicators. I will post another trend indicator soon. The combination of these two indicators gives good results. Works on all timeframes. Suitable for any couple. Experiment, adjust, observe. Filter by higher timeframes.
FREE

IMP
The Panel presents a number of indicators in abbreviated form: 2 oscillators, 2 trend and 1 volume indicator. Location - upper left corner.
Indicators values and colors can be customized by the user. Combined with other market analysis, can greatly improve trading results. This Indicator is a suitable tool for beginners and professional traders as one.
Metta Trader 4 Indicator Version _1.0
FREE
Note: The price is subject to increase at any time from now! Hi Traders, I would like to introduce to you my new indicator called the Infinity Oscillator Indicator. This indicator is designed for both newbies and professional traders.
Parameters The inputs that can be changed by the user are colors of the lines only so as to not disturb the original trading strategy this indicator uses. The indicator will not provide buy and sell arrow signals but will help traders in market analysis approach
This powerful tool helps you to easily access Fibonacci tools at different times and in different markets. This tool has the ability to send signals based on Fibonacci as well as setting alarms to be aware of broken Fibonacci levels. Among the capabilities of this tool are the following:
Identifies market trends Fibonacci auto design If Fibonacci levels are broken, it sends a message Send Fibonacci signal
Manuals: After selecting the target market, run the tool In the input settings according
FREE

Reborn — A Trend Robot With Strategies Built In
Reborn is a trend-following trading robot built on the Investment Castle Indicator, with several ready-made strategies inside so you can match it to your style — from straightforward stop-loss and take-profit to kill-and-switch direction changes with recovery.
What it does for you Multiple built-in strategies: choose the approach that fits your market and risk appetite. Trend-driven entries: powered by the Investment Castle Indicator. Smart recov
FREE
This tool helps you to analyze the market more easily without spending much time and with the help of this tool, by collecting the best technical analysis indicators and simple design and signal extraction tools from the available indicators. Necessary indicators are added to the tool and at the appropriate time, it issues a buy and sell signal to the trader.
FREE

This tool helps you to control the situation at other times and include them in your trades when analyzing the market This tool scans the market and reports the movement of the market at different times With the help of this tool, you can prevent many wrong analyzes With the help of this tool, you can have an overview of the market in the shortest time and save your time
FREE

促销活动进行中,现在购买相当于优惠折扣100% 1、原理介绍 FXEA trendArbitrage 是一个完全自动化交易(外汇交易机器人),主要产品一篮子交叉货币兑交易。该策略基于货币价值回归水平为依据,不使用滞后指标,毫秒级别运算处理每个有利可图 入口点,周期性历史数据采用高通分布统计算法,以此为逻辑。每个订单具备固定(隐藏)止赢损,特殊行情会自动启用动态分段算法来获取最大的利润(在之前发布的金盒EA8.3版本的基础上改版而来,现沿用趋势加套利策略算法实现策略组核心)。发挥其最大的优势,支持最低额100美金运行,在固定lot实现趋势加套利模式上能与人工和自动交易结合,可实现账户多元化模式交易和日内交易。
购买EA后,一定要私信给我,我会加你到私人群,并很乐意向您阐述交易细节。 我准备帮助每个买家安装和配置EA系统。 如果您以前从未使用过 EA,我将展示并教您如何使用它。 加入MQL频道 您可以使用MT4从单个图表运行(比如EURUSD D1 时间范围); 此 EA 对点差、滑点或任何其他经纪商相关变量不敏感; 仅使用推荐的配对;
2、EA参数设置

This tool eliminates the need for anything. With the help of this tool, you can save hours of your time. By installing this tool, you have a complete and comprehensive view of the market. Just enable the tool so that the artificial intelligence designed inside the tool starts scanning the market and measuring the market power and volume of buyers and sellers. Powerful trend detection This tool allows you to analyze all market time periods in the shortest time without any care. This tool automat

Представляю вам индюка скальпера, а также хорошо отрабатывает на бинарных опционах, дополнительно добавлена функция уведомления, где своевременно вы сможете открыть ордера в любом месте, главное чтоб был интернет, но, чтобы данная функция работала установите индюка на желаемые котировки и все это на сервер VPN. В данном индикаторе для дополнительной фильтрации сигнала используется индикатор RSI, период можно изменить в настройках, для поиска входов в открытие сделки, установите индикатор на та

What are Fibonacci Numbers and Lines? Fibonacci numbers are used to create technical indicators using a mathematical sequence developed by the Italian mathematician, commonly referred to as "Fibonacci," in the 13th century. The sequence of numbers, starting with zero and one, is created by adding the previous two numbers. For example, the early part of the sequence is 0, 1, 1, 2, 3, 5, 8, 13, 21, 34, 55, 89,144, 233, 377, and so on.
The Fibonacci sequence is significant because of the so-calle

KT Advance Ichimoku plot the arrows and provide alerts for the four trading strategies based on Ichimoku Kinko Hyo indicator. The generated signals can be filtered by other Ichimoku elements.
Four Strategies based on the Ichimoku Kinko Hyo
1.Tenkan-Kijun Cross Buy Arrow: When Tenkan-Sen cross above the Kijun-Sen. Sell Arrow: When Tenkan-Sen cross below the Kijun-Sen. 2.Kumo Cloud Breakout Buy Arrow: When price close above the Kumo cloud. Sell Arrow: When price close below the Kumo cloud. 3.C

Nice EA is a scalping strategy that uses pending orders to catch quick movements in the market. This strategy is typically a breakout trader and is more active in volatile markets. Pairs: USDCHF GBPUSD USDCAD
Others... Settings Comment The Trade Comment. Magic
1 = Magical Trading Market Slippage
The slippage in each order request. Tick Filter
A value of 2 means the pending orders are only adjusted every 2nd tick, higher values enable higher trading frequency and lower values allow better qua

KT Risk Reward shows the risk-reward ratio by comparing the distance between the stop-loss/take-profit level to the entry-level. The risk-reward ratio, also known as the R/R ratio, is a measure that compares the potential trade profit with loss and depicts as a ratio. It assesses the reward (take-profit) of a trade by comparing the risk (stop loss) involved in it. The relationship between the risk-reward values yields another value that determines if it is worth taking a trade or not.
Features
"Four eyed turkey" это индикатор на основе RSI,Stochastic,MACD и Envelopes определяющий точки входа на таймфреймах М5, М15, М30, Н1. В отдельном окне индикаторы указывают возможные точки входа, параметры можете определить самостоятельно в настройках. Для RSI и Stochastic - зоны перекупленности и зона перепроданности. Для MACD - сигнальная линия и гистограмма выше 0 это BUY, для SELL противоположно . Для Envelopes - открытие свечи выше верхней линии это BUY, открытие свечи ниже нижней линии это
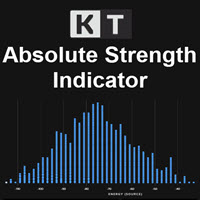
KT Absolute Strength measures and plots the absolute strength of the instrument's price action in a histogram form. It combines the moving average and histogram for a meaningful illustration. It supports two modes for the histogram calculation, i.e., it can be calculated using RSI and Stochastic both. However, for more dynamic analysis, RSI mode is always preferred.
Buy Entry
When the Absolute Strength histogram turns green and also it's higher than the previous red column.
Sell Entry
When th
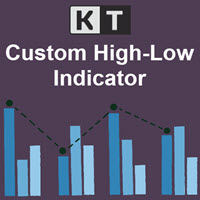
KT Custom High Low shows the most recent highs/lows by fetching the data points from multi-timeframes and then projecting them on a single chart. If two or more highs/lows are found at the same price, they are merged into a single level to declutter the charts.
Features
It is built with a sorting algorithm that declutters the charts by merging the duplicate values into a single value. Get Highs/Lows from multiple timeframes on a single chart without any fuss. Provide alerts when the current pri
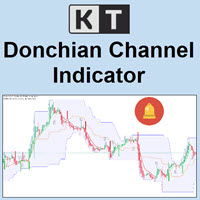
KT Donchian Channel is an advanced version of the famous Donchian channel first developed by Richard Donchian. It consists of three bands based on the moving average of last high and low prices. Upper Band: Highest price over last n period. Lower Band: Lowest price over last n period. Middle Band: The average of upper and lower band (Upper Band + Lower Band) / 2. Where n is 20 or a custom period value is chosen by the trader.
Features
A straightforward implementation of the Donchian channel ble
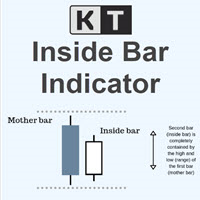
KT Inside Bar plots the famous inside bar pattern in which the bar carries a lower high and higher low compared to the previous bar. The last bar is also known as the mother bar. On smaller time-frames, the inside bar sometimes appears similar to a triangle pattern.
Features
Also plots entry, stop-loss, and take-profit levels with the inside bar pattern. No complex inputs and settings. Erase unwanted levels when the price reaches the entry line in either direction. All Metatrader alerts include
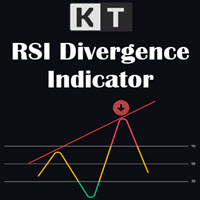
KT RSI Divergence shows the regular and hidden divergences built between the price and Relative Strength Index (RSI) oscillator. Divergence can depict the upcoming price reversal, but manually spotting the divergence between price and oscillator is not an easy task.
Features
Ability to choose the alerts only for the divergences that occur within an overbought/oversold level. Unsymmetrical divergences are discarded for better accuracy and lesser clutter. Support trading strategies for trend reve

我很高兴欢迎您来到我的产品页面 面板初次加载会服从后台设置,面板控制交易管理凌驾于后台之上。请注意交易方向的管理,正确的交易方向是交易市场生存的根本,这点很重要。 Ea交易有2种策略Sto,MA和用户在面板打开的执行订单,同时也支持移动端下单(下单基础请服从后台自行设置手数)、移动端预下单功能。 Sto策略单量密度大,是激进策略;MA策略较缓和。
此EA可全自动化交易,设置偏向于辅助手控交易。 ============Basic settings============= Magic EA 交易品种(trading variety) 点差(Spreads) 点差系数(Spread coefficient) =============conditions for execution==== 交易模式(Choosing strategy) 打开新系列订单(Open new series) //是否允许,否的话会停止打开新阶段订单。关闭状态适合运行预交易功能,也就是控制运行,一阶段一结。。 开多(Trade Sell) //处于关闭状态会停止一切开Sell方向单子。 开
FREE

This EA is sold only on MQL5 Concept of EA: EA is a fully auto you can see its performance here: https://www.mql5.com/en/signals/1606762 this is scalping hedge ea plus money management trade strategy based on price action pattern when price move in certain pattern ea will execute a trade and hedge it if needed ea preferably work with one pip spread , 4digits, leverage 1.400 or higher recommended you can choose to use money management or not by change it to true or false when mm are false y

The indicator is extremely versatile and can be used successfully on all time frames! This indicator is 100% NON repainting! It will never recalculate or back paint! The Signal indicator will give you the BUY & SELL suggestions which you can use if you prefer.
================================================== Disclaimer: Please remember that past performance does not guarantee future results. Please practice on a demo account first to get familiar with the indicator's operation and settings
MetaTrader 마켓은 MetaTrader 플랫폼용 애플리케이션을 구입할 수 있는 편리하고 안전한 환경을 제공합니다. Strategy Tester의 테스트를 위해 터미널에서 Expert Advisor 및 인디케이터의 무료 데모 버전을 다운로드하십시오.
MQL5.community 결제 시스템을 이용해 성능을 모니터링하고 원하는 제품에 대해 결제할 수 있도록 다양한 모드로 애플리케이션을 테스트할 수 있습니다.
