당사 팬 페이지에 가입하십시오

DROP LEVEL LINES (WITH LEVEL VALUE AND AUTOMATIC COLOR CHANGING) - MetaTrader 4용 스크립트
- 조회수:
- 25088
- 평가:
- 게시됨:
- 업데이트됨:
-
 이 코드를 기반으로 한 로봇이나 지표가 필요하신가요? 프리랜스로 주문하세요
프리랜스로 이동
이 코드를 기반으로 한 로봇이나 지표가 필요하신가요? 프리랜스로 주문하세요
프리랜스로 이동
NEW REVISION 2010-12-17:
*********************
DROP_LEVEL_LINE_Rev2.mq4: DROP_LEVEL_LINES.mq4 has been revised. The last revision Rev1 was displaying all prices with 4 digits. In this new revision (Rev2) the number of digits displayed is adjusted to the Market. (Example: With Rev1: EURUSD = 1.3452 USDJPY = 83.8200 DJ30 = 11332.0000 With new Rev2: EURUSD = 1.3452 USDJPY = 83.82 DJ30 = 11332).
*********************
NEW REVISION:
*********************
DROP_LEVEL_LINE_Rev1.mq4: DROP_LEVEL_LINES.mq4 has been revised. With the new revision the script will work also when MT4 is not connected to server. The old version could only work when the platform was connected to server.
*********************
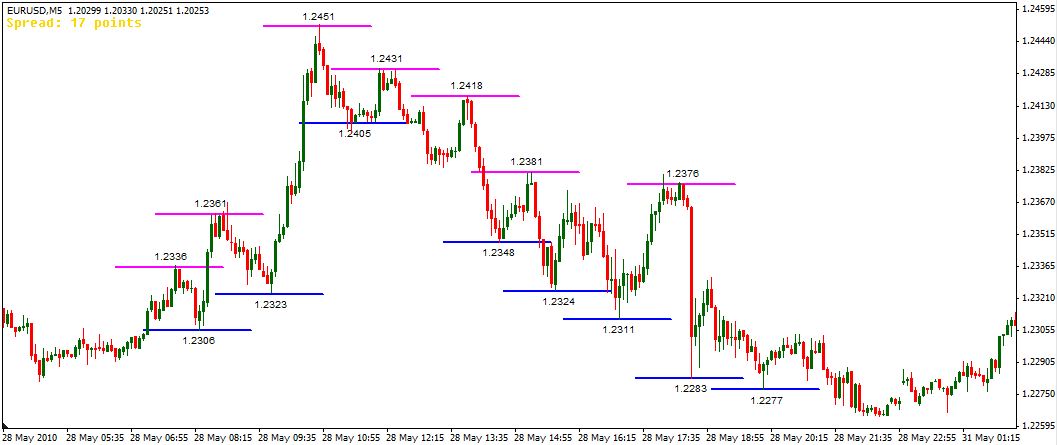
This is the new release of my previous script for horizontal segment lines (level lines).
http://codebase.mql4.com/en/code/9708 --> Previous code
What this script can do:
- This new script will draw horizontal lines like a segment (short line).
- It will show a text with the value (price) of the level line inserted above or below the line.
- It will recognize when the line it’s a bottom or top line changing automatically the color of the line and the position of the text (below a bottom line or above a top line).
These properties can be modified by editing the code:
- You can modify the color for bottom or top lines
- You can modify the width of the lines
- You can modify the length of the segment line
- You can modify the line type: segment (short line) or Ray (long full line)
- You can choose if you want to insert the level value as a text or not
- You can modify the distance of the text from the line
- You can modify the font size of the text
- You can modify the color of the text
Graph illustration:
 Higher timeframe candles on your chart
This indicator allows you to draw candles of an higher timeframe on your chart. Example: Draw H1 candles on your M1 chart.
 Progressive Grid Positionning System (Entry and Exit)
This systems allows you to progressively enter and exit the market. You define the amount you want to risk (%) and it calculates automatically the different levels of entering and exiting the market according to the amount of levels you have defined.
Trinity-Impulse
Zero values characterizes the Flat Trend. V-shaped pulse indicates the entrance to the opposite direction. U-shaped ilpuls - entry in the same direction.
ORDER MANAGEMENT FOR EA DEVELOPMENT - LAST VERSION
THIS IS THE LAST VERSION for EA DEVELOPMENT