거래 로봇을 무료로 다운로드 하는 법을 시청해보세요
당사를 Telegram에서 찾아주십시오!
당사 팬 페이지에 가입하십시오
당사 팬 페이지에 가입하십시오
스크립트가 마음에 드시나요? MetaTrader 5 터미널에서 시도해보십시오
피벗 포인트는 항상 거래에 매우 유용하며, 하루 동안 시장이 어디로 향하고 있는지 알 수 있는 간단한 방법입니다.
이 인디케이터는 처음 세 가지 지지선과 저항선도 제공합니다.
제가 사용한 공식은 다음과 같습니다:
Resistance 3 = High + 2*(Pivot - Low)
Resistance 2 = Pivot + (R1 - S1)
Resistance 1 = 2 * Pivot - Low
Pivot Point = ( High + Close + Low )/3
Support 1 = 2 * Pivot - High
Support 2 = Pivot - (R1 - S1)
Support 3 = Low - 2*(High - Pivot)
전일 막대의 데이터를 사용합니다.

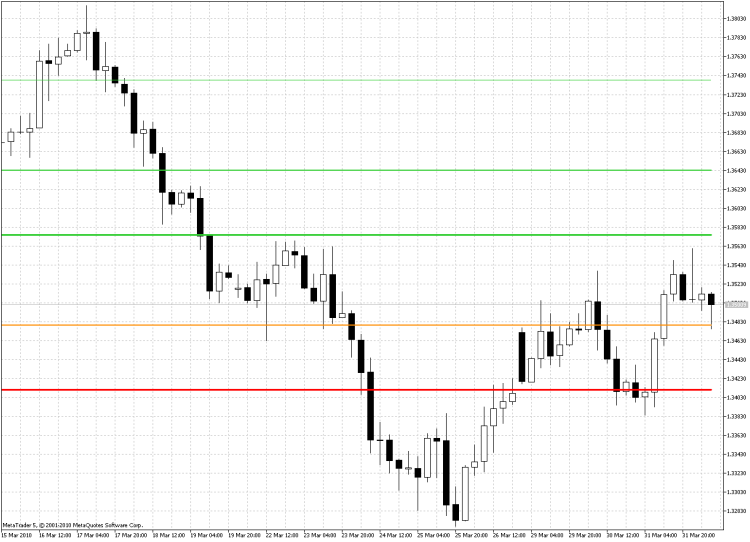
주황색 선은 당일의 피벗 포인트, 빨간색 선은 지지선, 녹색 선은 저항선입니다.
MetaQuotes Ltd에서 영어로 번역함.
원본 코드: https://www.mql5.com/en/code/95
 AdoSuite v 1.0
ODBC 및 OLE DB 인터페이스를 통해 데이터베이스로 작업하기 위한 클래스 집합입니다.
 FVG based Momentum Detection
입력한 "window_size"의 FVG를 평가하여 모멘텀 또는 추세 강도를 감지하는 지표입니다.
 컬러 포물선 2
포물선 테마의 연속입니다. 이제 가속도 계수에 따라 색상이 달라집니다.
 Trend Zigzag (on ma cross)
이동 평균 크로스오버의 교차점을 연결하는 정적 지그재그입니다.