당사 팬 페이지에 가입하십시오
- 조회수:
- 12970
- 평가:
- 게시됨:
- 업데이트됨:
-
이 코드를 기반으로 한 로봇이나 지표가 필요하신가요? 프리랜스로 주문하세요 프리랜스로 이동
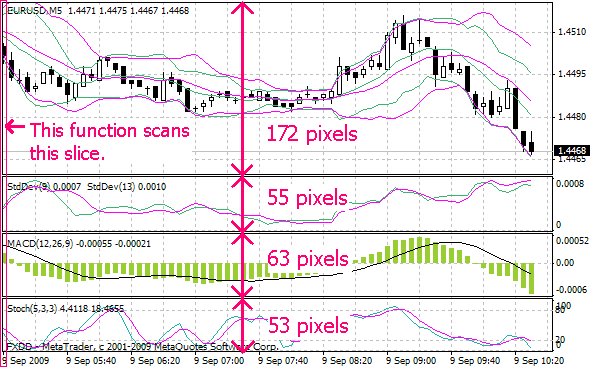
This function calculates the height in pixel of each pane in a window.
FOR WHAT:
With the use of the built-in functions "WindowPriceMin/Max()" together, you can calculate appropriate spacing/margin to text/arrow objects (OBJ_TEXT/OBJ_ARROW), whatever size the window is. See the EXAMPLE section below.
SYNOPSIS:
#import "GetPaneHeights.ex4"
    int GetPaneHeights(int &height[]);
#import
height[i] = the height in pixel of pane "i"
i = 0: main chart
i = 1: indicator #1
i = 2: indicator #2
...
(in top-to-bottom order)
The size of "height[]" must be large enough to contain all panes.
This function returns the number of panes. If it fails, the return value is zero.
To the window image below, you will get a return value of 4, and height[0] = 172, height[1] = 55, height[2] = 63, height[3] = 53.
NOTE:
This function scans the device context (DC) of a window, so if (the leftmost piece of) the window is covered by another window, then this function will fail.

EXAMPLE:
#import "GetPaneHeights.ex4"
    int GetPaneHeights(int &height[]);
#import

int         i, panes, height[10];
double      spacing;
string      sign;

panes = GetPaneHeights(height);
for (i = 0; i < panes; i++)
    Print("height[", i, "] = ", height[i], " pixels");

// Analyzing the chart... Hmm... it's time to sell.

if (panes == 0) {
    Alert("WARNING: cannot get the pane height!");
    height[0] = 500;
}
sign = "sell sign";
spacing = 5 * (WindowPriceMax(0) - WindowPriceMin(0)) / height[0];
ObjectCreate(sign, OBJ_ARROW, 0, Time[0], High[0] + spacing);
ObjectSet(sign, OBJPROP_ARROWCODE, ...);
ObjectSet(sign, OBJPROP_COLOR, ...);

// The sell sign will be located 5 pixels above the highest price
// of the latest bar, whatever size the window is.
 HistoryTraning (NEW VERSION)
The adviser allows you to try manual trading on the historical date (NEW VERSION / BUGS CORRECTED / NEW FUNCTIONS ADDED)
 VIDYA indicator
Variable Index Dynamic Average indicator
 Horizontal Grid Lines on Chart
The GRID10 indicator will draw a grid on a chart using grid lines positioned and separated at a convenient power of ten. The grid is constructed appropriate to the range of the symbol being plotted on the chart.
 iVeryCoolSpectrometr
Цветной анализатор спектра
