 MetaTrader 5
 Experts
 지표
 스크립트
 라이브러리
 보관함
거래 로봇을 무료로 다운로드 하는 법을 시청해보세요
당사를 Telegram에서 찾아주십시오!
당사 팬 페이지에 가입하십시오
당사 팬 페이지에 가입하십시오
스크립트가 마음에 드시나요? MetaTrader 5 터미널에서 시도해보십시오

- 조회수:
- 25
- 게시됨:
-
 이 코드를 기반으로 한 로봇이나 지표가 필요하신가요? 프리랜스로 주문하세요
프리랜스로 이동


Multi-Timeframe Trend Dashboard
Multi-Timeframe Trend Dashboard is a MetaTrader 5 chart indicator. It reads a simple EMA trend on several timeframes and shows the result in a corner panel. The EMA of the chart timeframe can also be plotted as a line. The indicator does not place, modify or close orders.
What it shows
For each enabled timeframe the panel prints:
The timeframe name (M15, H1, H4, D1, W1, and an optional sixth slot).
The state: UP, DOWN or FLAT.
The distance from the last close to the EMA, in price units of the symbol and in ATR.
How many bars the current state has lasted, up to a scan limit.
A summary line counts how many timeframes are up, down or flat, and marks the picture as “Aligned UP”, “Aligned DOWN” or “Mixed”.
If you attach the indicator on a weekend, the panel uses the last available bar of each timeframe, not a live quote.
How the state is decided
The rule is the same on every timeframe and uses only closed and current bars of that timeframe:
Compute an EMA of the close, with the period given in the inputs (default 50).
Measure the slope of that EMA over a short lookback (default 5 bars).
Measure ATR on the same timeframe (default 14) to judge whether the slope is meaningful.
UP: the close is above the EMA, and the EMA has risen by more than N × ATR (default N = 0.08).
DOWN: the close is below the EMA, and the EMA has fallen by more than N × ATR.
FLAT: any other case, including a close on the opposite side of a sloping EMA, or a slope that is smaller than the threshold.
This is a compact description of the local trend, not a trade signal and not a forecast.
Inputs
Timeframes
Six optional slots. By default the first five are M15, H1, H4, D1 and W1. A duplicate timeframe is ignored.
Trend rule
EMA period, slope lookback, ATR period, flat threshold in ATR units, and the maximum number of bars scanned for the “held” count.
Display
Plot the chart-timeframe EMA, show or hide the panel, panel corner, offsets, font size and colours.
Requirements
Platform: MetaTrader 5.
Works on any symbol that has enough bars on the chosen timeframes.
No DLL calls, no WebRequest and no internet connection.
Objects are removed when the indicator is removed from the chart.
About the author
Author of Golden Sniper XAU: https://www.mql5.com/en/market/product/207995
Author of the free indicator Swing Structure ATR: https://www.mql5.com/en/market/product/208384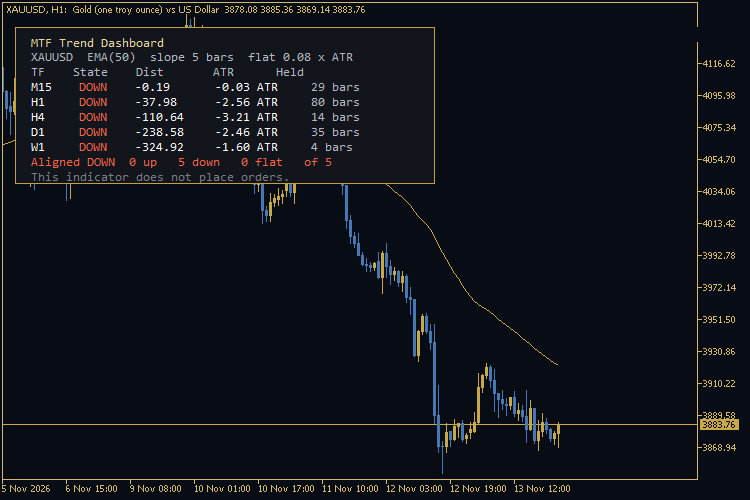
 Support/Resistance and Fair Value Gap Zones
Draws support and resistance levels from confirmed swing highs and lows, and the fair value gaps (3-candle gaps) that price has not filled yet. Rule-based, merges nearby levels by ATR, removes a gap as soon as price trades back through it.
 Golden Cross Trend Filter (50/200 SMA on daily closes)
Classic 50/200-day Golden Cross trend filter: long while the fast SMA of daily closes is above the slow SMA, flat (or optionally short) otherwise. One decision per completed D1 bar, sizing by % of balance or fixed lot.
News Event Marker
Marks built-in economic calendar events on the chart with time lines, optional windows, labels, a panel and alerts.
MACD Signals
Indicator edition for new platform.