 MetaTrader 5
 Experts
 지표
 스크립트
 라이브러리
 보관함
거래 로봇을 무료로 다운로드 하는 법을 시청해보세요
당사를 Twitter에서 찾아주십시오!
당사 팬 페이지에 가입하십시오
당사 팬 페이지에 가입하십시오
스크립트가 마음에 드시나요? MetaTrader 5 터미널에서 시도해보십시오

Equity Drawdown Monitor - MetaTrader 5용 지표
Gabriele Volpato

Eudora Lab은 Eudora 엑스퍼트 어드바이저를 만듭니다.
종목당 하나의 EA, 실제 틱으로 검증하고 정확한 백테스트 방법을 공개하므로 구매 전에 직접 수치를 재현할 수 있습니다.
모든 메시지에 직접 답변합니다.
Website: https://eudora-ea.com/
종목당 하나의 EA, 실제 틱으로 검증하고 정확한 백테스트 방법을 공개하므로 구매 전에 직접 수치를 재현할 수 있습니다.
모든 메시지에 직접 답변합니다.
Website: https://eudora-ea.com/
- 조회수:
- 181
- 평가:
- 게시됨:
- 업데이트됨:
-
 이 코드를 기반으로 한 로봇이나 지표가 필요하신가요? 프리랜스로 주문하세요
프리랜스로 이동


Most panels show the balance. This one shows what the account is going through right now: how far the equity is from its peak, how deep it has been, what was closed today, this week and this month, and which Expert Advisor is carrying the open result.
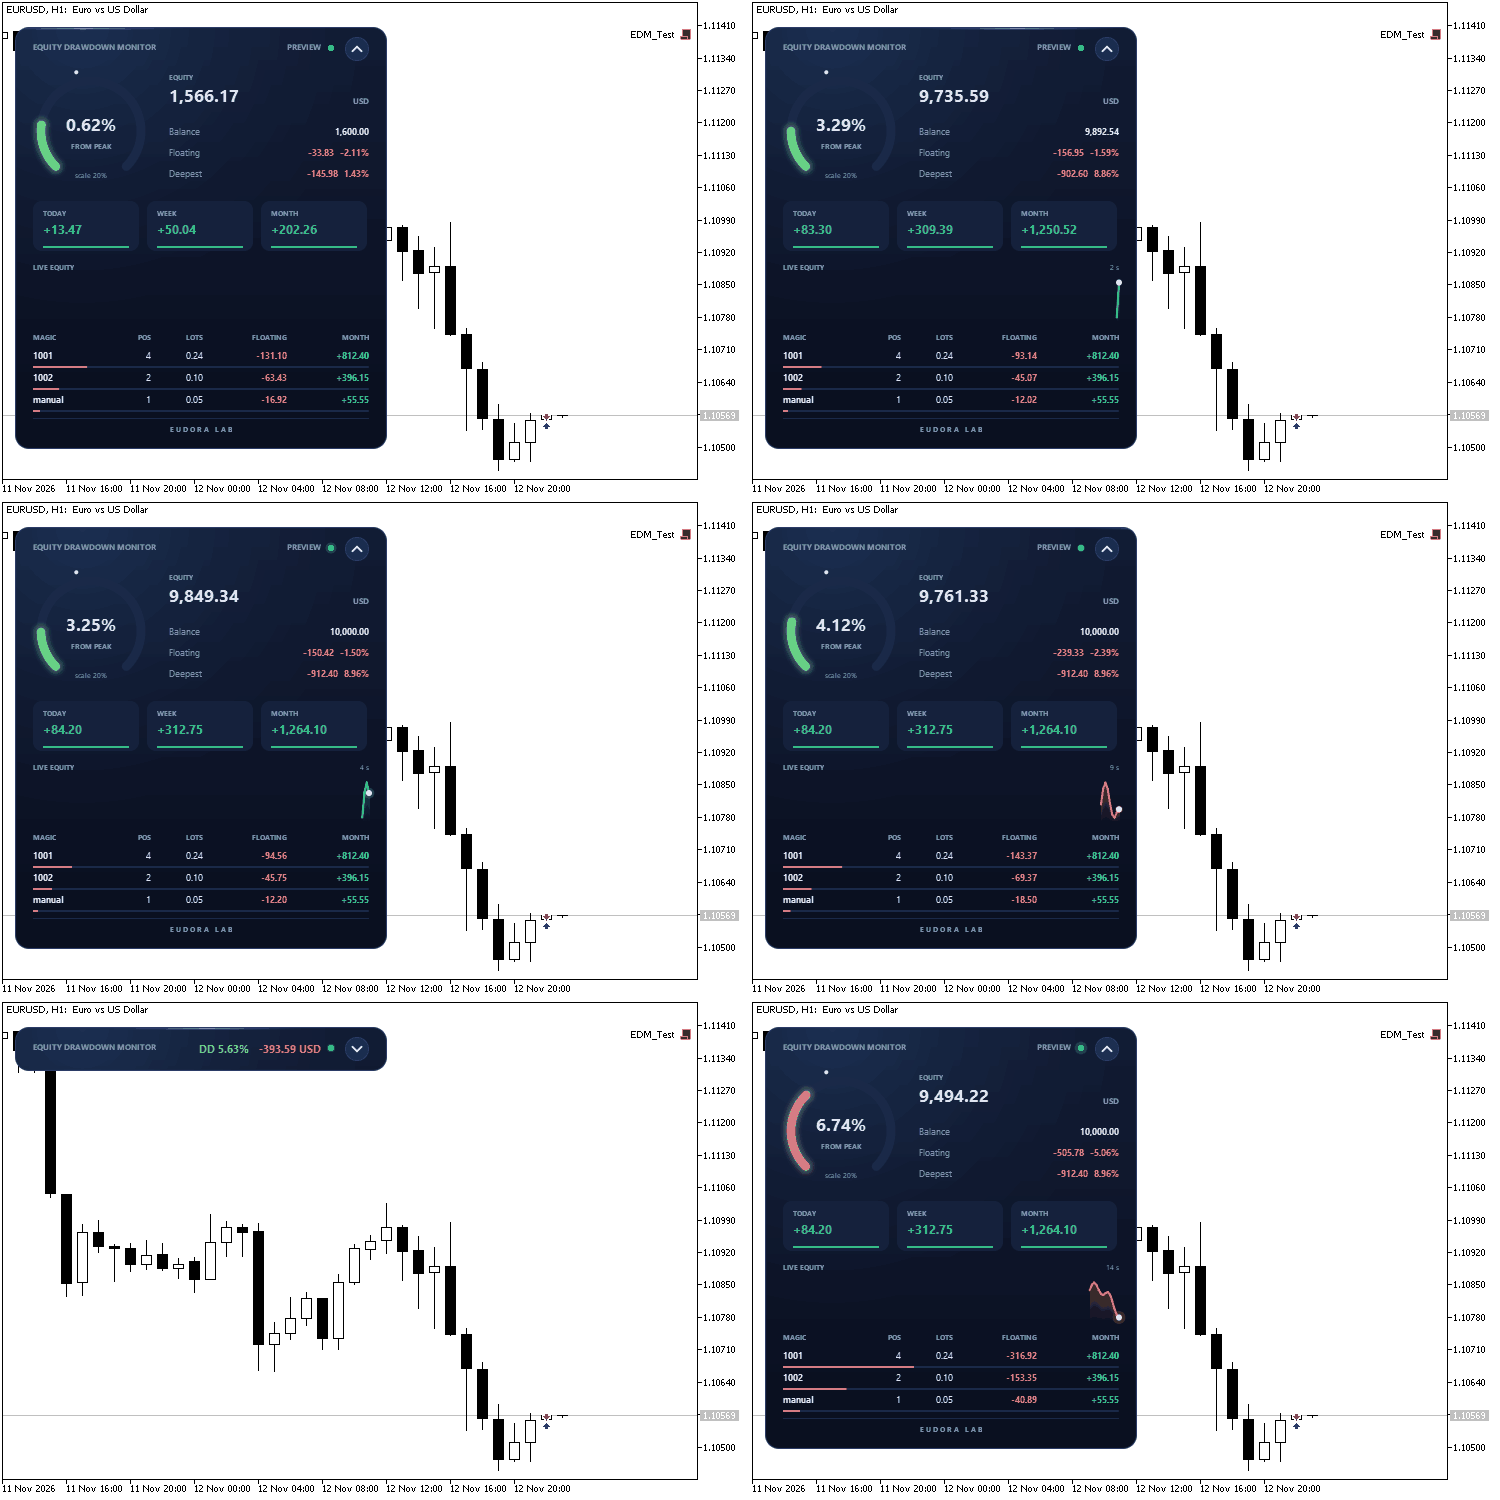
The panel at work in preview mode, with sample data: opening, live figures, collapse and expand
The panel is drawn on a canvas with antialiased shapes and smooth transitions. The gauge sweeps to its value, the figures count up and down as the account moves, and the equity line updates every second. A button in the header folds the panel into a slim bar that keeps the drawdown and the floating result in view, and the panel can be dragged anywhere on the chart by its header. The indicator is read-only: it reads account data and draws the panel, all inside the terminal. The code is a single file and uses only the standard Canvas library.
What the panel shows
- Gauge: the drawdown from the equity peak, as a percentage. The arc turns from green to amber to red as it fills. The small white dot on the rim marks the deepest drawdown recorded so far.
- Account: equity, balance, the floating result in money and as a signed percentage of the balance, and the deepest drawdown from peak.
- Closed result: today, this week (from Monday) and this month, in server time. Swap, commission, fee and the charges booked by the broker are included.
- Live equity: the equity of the last two and a half minutes, one sample per second.
- One line per magic number: open positions, total lots, floating result and closed result of the month, with the heaviest line first. Manual trades are listed as "manual". The bar under each line shows its weight against the others.
How the peak works
The peak starts from the equity at the moment the indicator is first attached, and it rises every time the equity makes a new high. It is stored in the global variables of the terminal, one set per account and server, so it survives restarts and timeframe changes. Bonus credit is left out of the calculation.
Deposits and withdrawals are recognised from the deal history and rescale the peak, so the drawdown percentage is the same before and after the transfer: a withdrawal is counted as a transfer and the drawdown figure stays clean.
Inputs
- Distance from the left edge / top edge: starting position of the panel, in pixels. After that the panel remembers where it was dragged.
- Panel size, percent: scales the whole panel; it also follows the DPI of the screen.
- Lines in the magic number table: how many magic numbers are listed (default 6).
- Accent color: the color of the light on the panel.
- Start collapsed: opens the panel as a bar the first time.
- Full scale of the gauge, %: 0 lets the gauge choose a round scale above the deepest drawdown seen.
- Alert when drawdown from peak reaches, %: 0 turns the alert off. One alert per account, also with several charts open.
- Restart the peak from the current equity: set to true once, then back to false.
- Preview with sample data: shows the panel at work before the first trade. The animation above was recorded in this mode.
Version 1.01
- Collapse button and drag by the header, with the position remembered per account.
- Drawdown computed without bonus credit; floating result read from the account profit, with a signed percentage.
- Deposits and withdrawals tracked by deal ticket, also over the weekend, keeping the drawdown percentage unchanged.
- Deepest drawdown kept both in percent and in money; state saved at least once an hour.
- Table sorted by weight; closed result includes broker charges.
Works on any symbol and timeframe, on hedging and netting accounts.
Correlation Matrix Dashboard
Live rolling-correlation heatmap across your watchlist — spot hidden overlapping exposure before you stack three “different” trades that are secretly one trade.
 Common Folder Copier - copy positions between MT5 terminals on the same PC
Local MT5-to-MT5 trade copier through the Common files folder. One EA in Master or Slave mode: lot multiplier or fixed lot, symbol prefix/suffix, reverse, SL/TP and partial close sync.
Trade Pad
An animated one-click trading panel for the chart symbol: buy and sell with live prices, lot stepper, close all, close profit, close loss and breakeven, with confirmations, a practice mode and a collapsible, draggable panel.
Session Clock
An animated 24-hour dial of the Sydney, Tokyo, London and New York sessions with automatic daylight saving time, a countdown to the close of the current candle, and live spread and day range. The panel collapses into a bar and can be dragged on the chart.