 MetaTrader 5
 Experts
 지표
 스크립트
 라이브러리
 보관함
당사 팬 페이지에 가입하십시오

Mouse Scroll Zoom in Zoom Out - MetaTrader 5용 지표

- 조회수:
- 131
- 평가:
- 게시됨:
-
 이 코드를 기반으로 한 로봇이나 지표가 필요하신가요? 프리랜스로 주문하세요
프리랜스로 이동

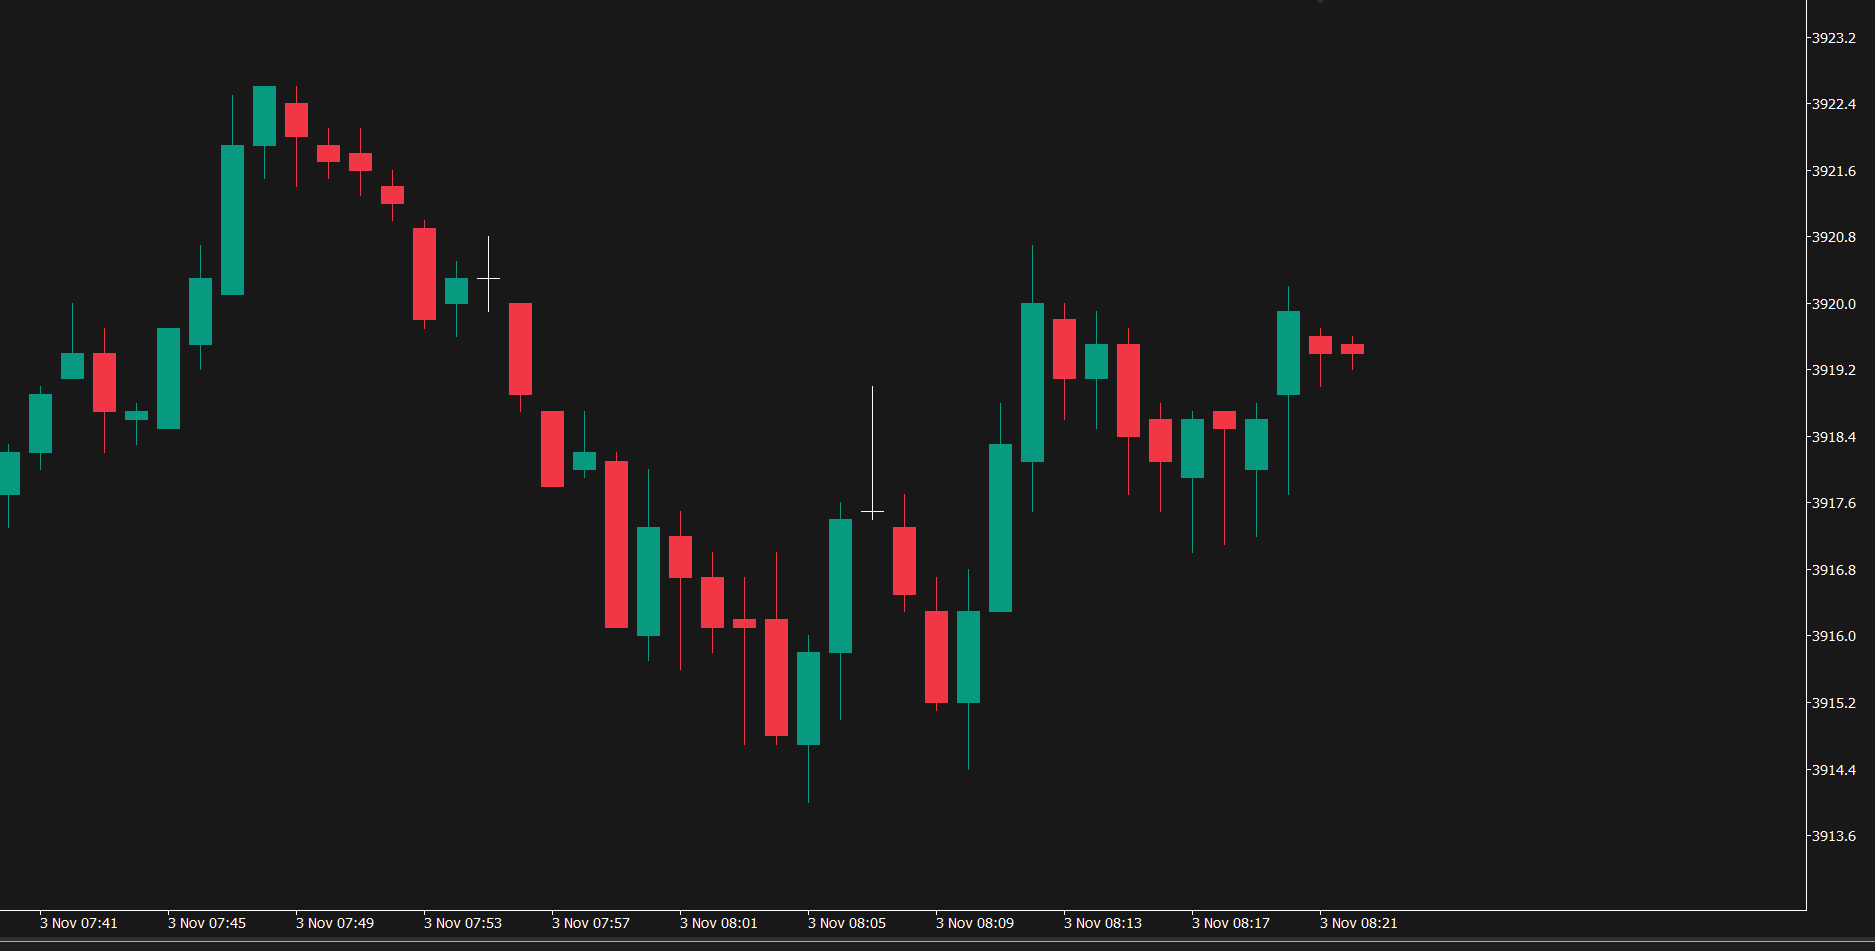
This indicator runs on Onchartevent only. User can use Mouse scroll to zoom in / zoom out chart
Simple and minimal code.
Trend Regime Indicator
Trending up, trending down or ranging: a verdict for every bar, and how long it has held. Each stretch of one regime is boxed on the price chart, ADX columns below show how strong it is, and a one-line panel gives the regime, its age and the ADX. Values for Expert Advisors and an alert on closed bars.
 After-Exit Analyzer - what price did after you closed: stopped-out trades that later hit TP, profit left after exits
Reads your closed positions and the M1 bars after each exit. Shows how many stopped-out trades later reached their take profit, how far take-profit trades kept running and how much move was left after manual or EA exits. Summary panel, per-position log table and CSV.
Prop Firm Guard Panel
Prop Firm Guard Panel is an on-chart panel for prop firm challenges and funded accounts. It shows in real time the daily loss used and the room left, the max loss room and equity floor, and the progress toward the profit target. The start-of-day balance is rebuilt from today's closed deals, so the values stay correct after a restart. Colors change from green to orange to red as limits get closer, with optional popup and push alerts. Auto, dark or light theme. Display only: it never opens, modifies or closes trades.
Opening Range Breakout with Statistics Dashboard
Draws the daily opening range and its breakout levels, with a dashboard showing how the range resolved over your lookback: broken up, down, both ways or not at all, and how often a breakout hit its target before the opposite side.