 MetaTrader 5
 Experts
 지표
 스크립트
 라이브러리
 보관함
당사 팬 페이지에 가입하십시오

Cointegration: ADF, Engle-Granger and Johansen tests with a pair scanner - MetaTrader 5용 라이브러리

제가 제공하는 작업:
고객의 전략, TradingView 스크립트 또는 문서화된 규칙을 깔끔한 MT5 Expert Advisor로 구현
기존 EA 수정 및 문제 해결: % 기준 리스크 포지션 사이징, 트레일링 스톱, 세션 및 시간 필터, 스프레드 필터, 멀티 심볼 포트폴리오, 드로다운 보호 기능
- 조회수:
- 94
- 게시됨:
- 업데이트됨:
-
 이 코드를 기반으로 한 로봇이나 지표가 필요하신가요? 프리랜스로 주문하세요
프리랜스로 이동

Cointegration.mqh tests whether price series share a long-run relation, the condition behind pairs and spread trading. It has the augmented Dickey-Fuller unit root test, the Engle-Granger test for two to six series, and the Johansen trace and maximum eigenvalue tests, with p-values and critical values, plus the spread, its half-life of mean reversion and its z-score. No DLL.
Usage
#include <Cointegration\Cointegration.mqh>

vector a, b;                                   // log prices of two symbols on the same bars
// ... fill a and b ...
matrix x(a.Size(), 1);
x.Col(b, 0);
SEngleGrangerResult eg;
vector coef;                                   // hedge ratio, then the constant
if(CCointegration::EngleGranger(a, x, eg, coef) && eg.pvalue < 0.05)
  {
   vector spread = CCointegration::Spread(a, x, coef);
   double half = CCointegration::HalfLife(spread);   // periods
   double z = CCointegration::ZScore(spread, 60);
  }

SAdfResult adf;
CCointegration::Adf(a, adf, COINT_TREND_CONSTANT, COINT_LAGS_AIC);   // adf.stat, adf.pvalue, adf.lags

matrix prices(a.Size(), 2);
prices.Col(a, 0);
prices.Col(b, 1);
CJohansenResult jo;
CCointegration::Johansen(prices, 0, 1, jo);    // constant, 1 lagged difference
int rank = jo.Rank();                          // number of relations by the trace test at 95%
What is in it
- Adf: no constant, constant, linear trend or quadratic trend; the number of lags is fixed or chosen by AIC, BIC or the t-statistic of the last lag, with the default maximum of statsmodels (12 (n/100)^(1/4)). The lag search uses a single QR factorization for every lag length.
- EngleGranger: least squares of the first series on the others and the trend, then ADF without constant on the residuals, with the p-values and critical values for cointegration (they depend on the number of series).
- Johansen: no deterministic term, constant or linear trend, any number of lagged differences; eigenvalues, cointegrating vectors (normalized so that v' Skk v = 1, or with the first element 1 by Vector()), trace and maximum eigenvalue statistics, critical values at 90%, 95% and 99% for up to 12 series, and the rank. The eigenproblem is solved as a symmetric one after a Cholesky factorization.
- MacKinnonP and MacKinnonCrit: approximate p-values (MacKinnon 1994) and finite-sample critical values (MacKinnon 2010), usable for any Dickey-Fuller type statistic.
- Ols: least squares by Householder QR with t-statistics.
Example
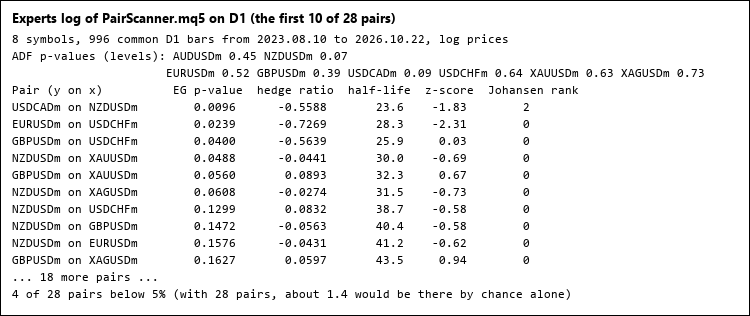
The script PairScanner.mq5 takes a list of symbols (the broker suffix is found by itself), keeps the bars they all have, prints the ADF p-value of each one, then tests every pair in both directions and prints them sorted by Engle-Granger p-value, with the hedge ratio, the half-life, the z-score of the spread and the Johansen rank (picture 1). It also says how many pairs would pass at 5% by chance: with 28 pairs, about 1.4. The spread of the best pair can be written to a CSV file (picture 2).
A Johansen rank of 2 for a pair means that both series look stationary on their own (here NZDUSD and USDCAD have ADF p-values of 0.07 and 0.09), not that the pair has two relations.
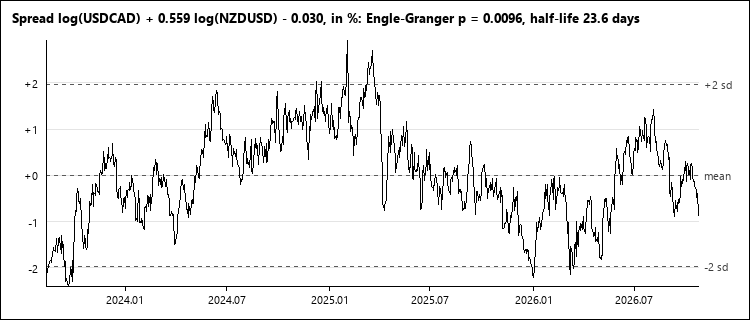
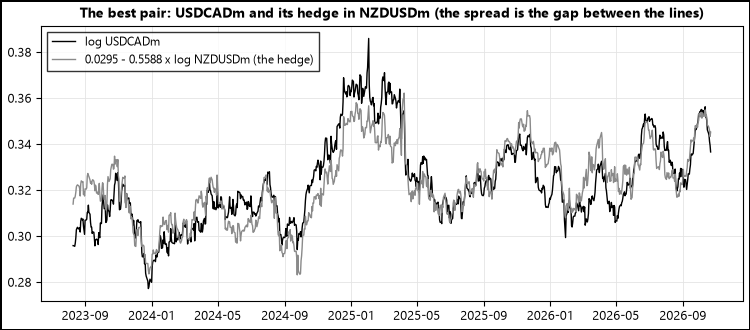
Picture 3: the log price of USDCADm and the hedge leg, 0.0295 - 0.5588 x log NZDUSDm. Each line wanders on its own, but they wander together: the gap between them is the spread of picture 2, which comes back to zero with a half-life of about 24 days.
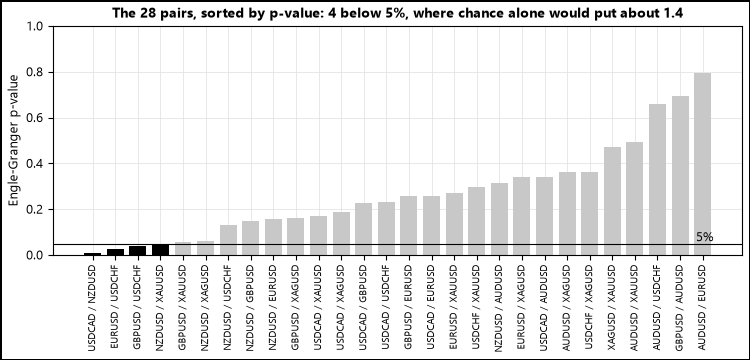
Picture 4: the Engle-Granger p-values of the 28 pairs, sorted. Four are below 5%, where about 1.4 would be by chance alone, and the pairs share symbols, so the 28 tests are not independent either. Use the scanner to make a short list to check on other data, not as a proof.
Checked
Against statsmodels 0.15 (adfuller, coint, coint_johansen, mackinnonp, mackinnoncrit) on six data sets: three simulated systems with 0, 1 and 2 cointegrating relations, two stationary series, gold and silver, and USDJPY and GBPJPY on H4:
- 240 ADF tests (4 trends x 4 lag rules): the same lags and number of observations, statistics within 1e-11, critical values identical;
- 72 Engle-Granger tests: statistics within 1e-11, coefficients within 6e-11;
- 72 Johansen tests (3 deterministic terms x 4 lags): eigenvalues, statistics and vectors within 1e-9, the same ranks;
- with a quadratic trend, the regression of statsmodels uses t^2 up to 9 million and is badly conditioned: its statistics differ by up to 5e-8. Cointegration.mqh scales the trend inside, and matches an exact well-conditioned computation within 1e-12.
On the pair of picture 2, the p-value, hedge ratio, half-life and z-score are the same as those of statsmodels on the same prices. An ADF test of 2 000 values takes about 1.5 ms, a Johansen test 0.5 ms.
Files
Cointegration.mqh and CointegrationTables.mqh go to MQL5\Include\Cointegration, PairScanner.mq5 to MQL5\Scripts\Cointegration.
Kalman: exact diffuse Kalman filter, local level and time-varying hedge ratio
Kalman filter and smoother with an exact diffuse start, missing values and maximum likelihood: local level, local linear trend and a regression whose hedge ratio drifts.
RegimeHMM: market regimes with a hidden Markov model
Gaussian hidden Markov model fitted by Baum-Welch: regime probabilities without look-ahead, most likely path, expected durations and regime forecasts.
 Basket Pair Closer
Position manager for MT5 that closes the best winner together with the worst loser when their combined result reaches your minimum. Basket take profit and stop loss in money, magic filter, simple panel. Works with grid, martingale and manual trades. Open source code.
DataSnooping: SPA test, Reality Check, StepM and model confidence set
Is the best of many strategies really better than the benchmark? Hansen's SPA test, White's Reality Check, Romano-Wolf StepM and the model confidence set.