 MetaTrader 5
 Experts
 지표
지표
 스크립트
스크립트
 라이브러리
라이브러리
 보관함
보관함
당사 팬 페이지에 가입하십시오

Market Activity from Quote Waits - MetaTrader 5용 지표

Gmail: ayanminhasshayar@gmail.com
- 조회수:
- 49
- 게시됨:
-
 이 코드를 기반으로 한 로봇이나 지표가 필요하신가요? 프리랜스로 주문하세요
프리랜스로 이동
이 코드를 기반으로 한 로봇이나 지표가 필요하신가요? 프리랜스로 주문하세요
프리랜스로 이동

Overview
Every MetaTrader 5 chart carries a measure of market activity for free: tick volume, the number of quote updates that arrived during a bar. It answers its own question exactly, but it is a poor answer to the question traders usually ask of it: is the market unusually busy right now?
Three things get in the way. The first is the clock. On EURUSD the average wait between quotes in the quietest half hour of the day is about forty-seven times longer than in the busiest, and the pattern repeats every day, so most of what a tick volume histogram shows is the time of day. A tall bar at the London open usually means only that it is the London open. The second is timing: a bar's count is complete only when the bar closes, so mid-bar it is a partial number that cannot be compared with the finished bars beside it. The third is resolution: twenty quotes spread evenly over a minute and twenty quotes in a three-second burst produce the same bar.
This indicator answers the question directly. It works on the time between consecutive quotes rather than counts per bar, divides out the normal rhythm of the trading day, and models what remains with the autoregressive conditional duration (ACD) model of Engle and Russell. The result is a single number, updated on every quote, that reads 1 when the market is exactly as busy as it normally is at this hour, 2 when quotes are arriving twice as fast as usual, and 0.5 when they are arriving half as fast.

From quotes to events: the waits between quote changes, a burst, two ticks in one millisecond folded into one event, and a closed market that starts a new session.
How It Works
Quotes become events. On a retail feed a tick is a change in the quote, not a trade. Ticks stamped in the same millisecond as the previous one are folded into a single event, since a wait of zero is one burst delivered as several records rather than a very short wait. Any wait longer than five minutes (by default) is a closed market (a weekend, a daily index break, a holiday), so the next event starts a new session and the model restarts from its long-run level instead of learning that the next quote is days away.
The daily rhythm is divided out. A time-of-day profile is learned as the average wait in thirty-minute bins. Each wait is filed under the time it started, the only time known when the forecast is made, and the profile is read back by interpolating between bin centers, so the adjustment never jumps at a bin boundary. The profile is then scaled so that adjusted waits average exactly one, which is what lets 1 mean "normal".
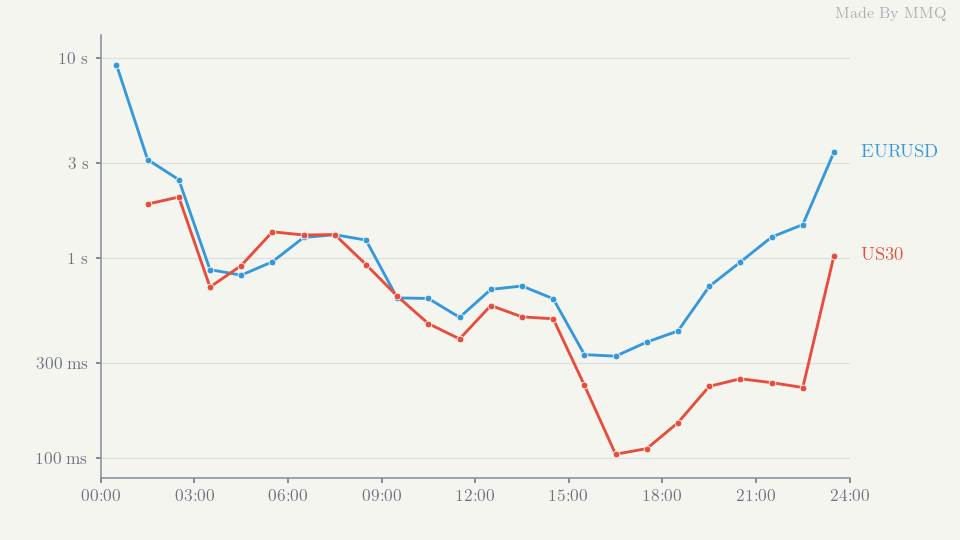
The normal wait between quote changes at each time of day, EURUSD and US30, on a logarithmic scale. This shape repeats every day and carries no information about today.
The clustering that remains is modelled. Even after the rhythm is removed, a busy stretch is followed by more busy stretches. The ACD model keeps one running number, psi, the expected adjusted wait until the next quote, and nudges it toward every wait that ends:
psi_i = omega + alpha * x_(i-1) + beta * psi_(i-1)
Readers who know GARCH(1,1) will recognise the recursion, with waits in place of squared returns. The sum alpha + beta is the persistence, and it is easiest to read as a half-life: on EURUSD a persistence of 0.9975 halves a burst's pull after 277 events, a little over three minutes at the average pace. Omega is pinned so that the long-run expected wait equals one, so the gauge reads exactly 1 whenever psi sits at its long-run level.

The expected wait through a burst of quotes: each short wait pulls it down, and afterwards it decays back toward normal, halving the gap every half-life.
Three readings come out of the live state, each updated in constant time with no window and no stored history:
- Activity ratio: the long-run mean divided by psi. This is the gauge.
- Expected wait: psi with the time-of-day rhythm put back in, in milliseconds, for the next quote.
- Silence ratio: the time since the last quote divided by the expected wait. Psi only moves when a quote arrives, so this is what says, between quotes, that the next one is overdue.
Reading the Chart
The indicator draws in a subwindow. The main line is the logarithm, base 2, of the activity ratio, so doubling and halving are equal distances from normal. It is grey around normal, orange-red at twice the normal pace or more, and blue at half or less, with labelled levels at each threshold. The dotted line is raw tick volume against its average over the rhythm period, on the same logarithmic scale. It is there as a contrast, to show what the gauge removes.
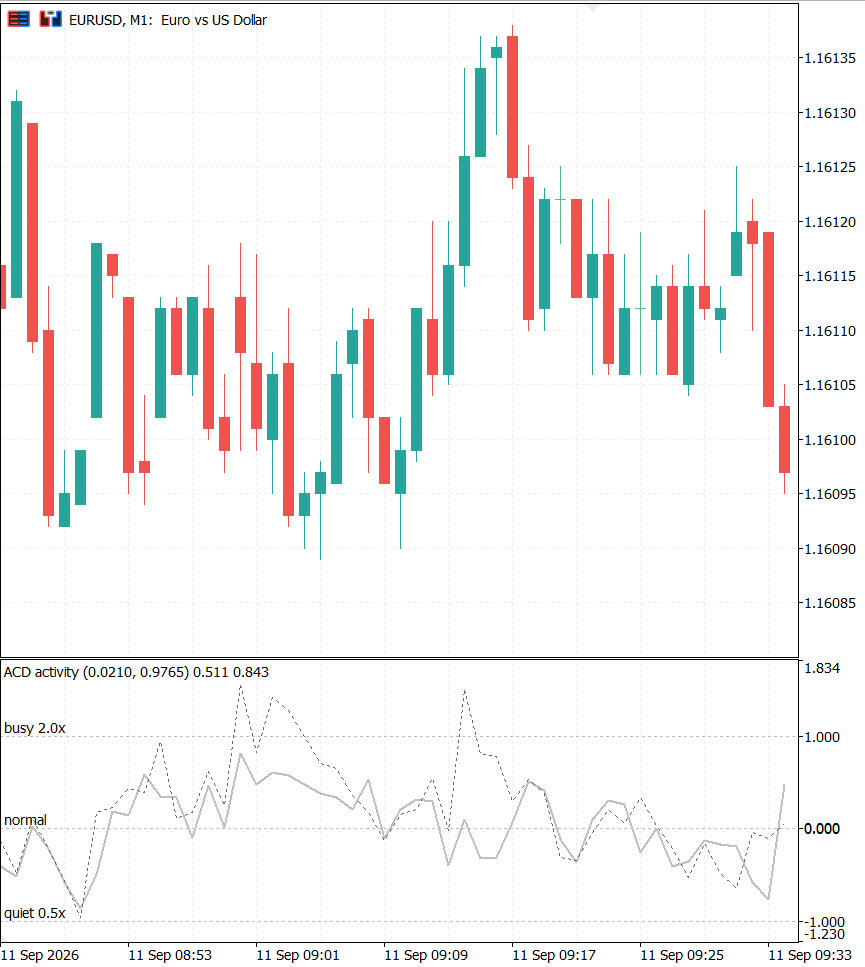
EURUSD M1 through the London open: tick volume climbs with the session while the activity ratio stays near normal, because that increase is exactly what is normal for the hour.
Over the three trading days plotted above, the hour of the day explains 72.8% of the variation in the tick volume line but only 29.7% of the variation in the activity line. When quotes suddenly arrive far faster than usual for the hour, the activity line turns orange-red within seconds, while the bar is still forming and its tick volume is still a partial count.
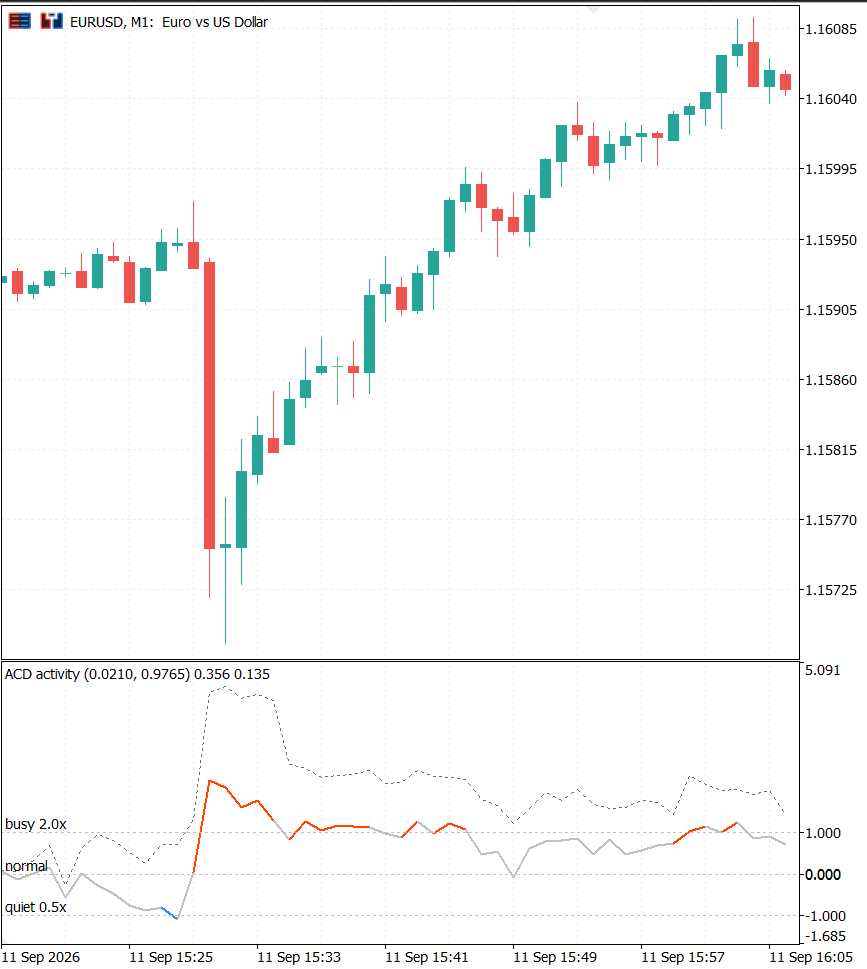
A genuine burst: the activity ratio rises into the busy zone within seconds, before the bar has closed.
The indicator does no model fitting on the chart. On load it learns only the rhythm, from the seven trading days before the plotted range, warms the state through them, and then replays the last three trading days. Nothing drawn has therefore been adjusted by a profile that saw it.
Recommended Setup
| Setting | Recommended value | Notes |
|---|---|---|
| Symbol | EURUSD (shipped parameters) | The default alpha and beta are a EURUSD fit. Any symbol whose feed is a real market works once its own parameters are fitted, as shown below. |
| Timeframe | M1 to M15 | The gauge is computed per quote, so the timeframe only decides how often a value is written to the plot. Short timeframes show bursts as they happen. |
| Tick history | Ten trading days | The rhythm period and the plotted days are read from tick history at load. If the terminal has not downloaded it yet, the indicator prints a message and draws once the ticks arrive. |
| Recalibration | About monthly | And whenever you change symbol or broker. If the persistence moves noticeably between fits, the older parameters are stale. |
For reference, these are the Weibull fits on thirty days of quotes ending 14 September 2026. They describe one broker's feed, so treat them as starting points and refit on your own account.
| Symbol | Alpha | Beta | Persistence | Half-life, events |
|---|---|---|---|---|
| EURUSD | 0.0210 | 0.9765 | 0.99750 | 277 |
| GBPUSD | 0.0376 | 0.9586 | 0.99625 | 184 |
| USDJPY | 0.0443 | 0.9518 | 0.99615 | 180 |
| XAUUSD | 0.0357 | 0.9584 | 0.99402 | 116 |
| US30 | 0.0228 | 0.9764 | 0.99920 | 870 |
| SPX500 | 0.0200 | 0.9788 | 0.99885 | 604 |
What the Evidence Shows
Activity is only interesting if it says something about what comes next. The question tested was narrow: does knowing how busy the market is improve a forecast of the volatility of the next one to fifteen minutes? Because volatility clusters, anything correlated with recent volatility will appear to help, so every comparison was made against a baseline that already used recent volatility, with each regression fitted on the first 70% of thirty days and scored on the rest.
- At the bar close, the activity measures tie. Adding any activity measure to recent bar volatility improved a fifteen-minute forecast by three to eight points of R-squared on five of six symbols. Closed-bar tick volume, a live rolling count and the ACD gauge stayed within about a point of each other, because a finished bar holds the complete count.
- Inside the bar, live measures pull ahead. Mid-bar, the ACD gauge beat closed-bar tick volume on all six symbols at five- and one-minute horizons, by 1.0 to 8.8 points.
- Fresh prices carry most of that gain. Live realised volatility alone beat the gauge alone on every symbol. Much of what a live activity measure offers is simply that it is up to date.
- Activity still adds something prices do not. With live volatility already in the forecast, adding the gauge improved it on all six symbols at both horizons.
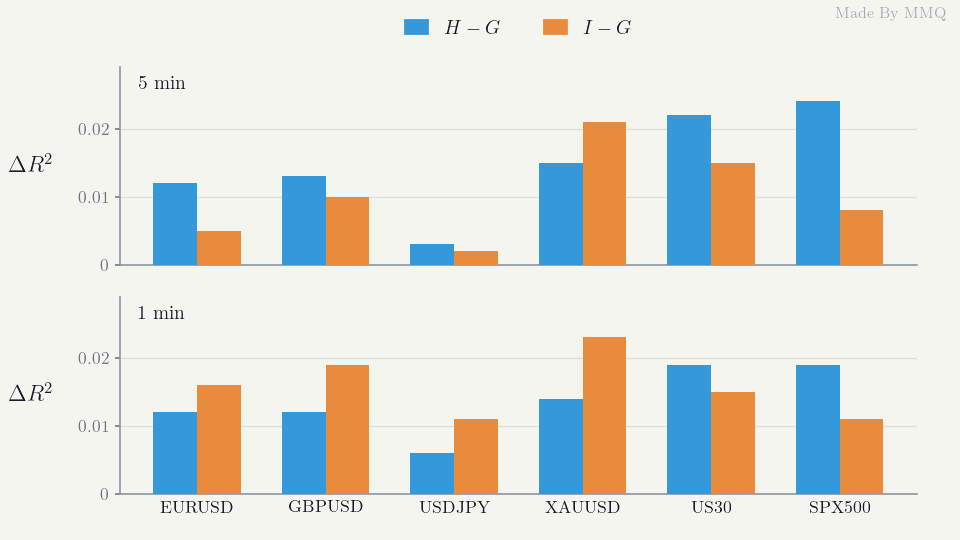
What each activity measure adds to the mid-bar forecast once live volatility is known, for each symbol and horizon.
| Symbol | ACD gauge, 5 min | Rolling counts, 5 min | ACD gauge, 1 min | Rolling counts, 1 min |
|---|---|---|---|---|
| EURUSD | +0.012 | +0.005 | +0.012 | +0.016 |
| GBPUSD | +0.013 | +0.010 | +0.012 | +0.019 |
| USDJPY | +0.003 | +0.002 | +0.006 | +0.011 |
| XAUUSD | +0.015 | +0.021 | +0.014 | +0.023 |
| US30 | +0.022 | +0.015 | +0.019 | +0.015 |
| SPX500 | +0.024 | +0.008 | +0.019 | +0.011 |
The gains in test R-squared are small: a fraction of a point on USDJPY, one to one and a half points on the other currency pairs and gold, and around two points on the indices. The ACD gauge is strongest at five minutes and on the indices; at one minute on currencies and gold, rhythm-adjusted rolling counts did as well or better. What the gauge offers over a count is that it needs no counting window to be chosen, and its memory is fitted from the data rather than set by hand.
Input Parameters
| Parameter | Default | Description |
|---|---|---|
| InpAlpha | 0.020987 | Weight on the wait that just ended. The default is the EURUSD fit. |
| InpBeta | 0.976518 | Weight on the previous expectation. Alpha and beta must be non-negative with a sum below one, or the indicator refuses the inputs. |
| InpGapSec | 300 | A wait longer than this, in seconds, is treated as a closed market: the bar is left blank and the model restarts at normal. |
| InpRhythmDays | 7 | Trading days before the plotted range used to learn the time-of-day profile and warm the state. |
| InpBinMinutes | 30 | Width of each time-of-day bin. It must divide the day evenly. |
| InpPlotDays | 3 | Trading days plotted, today included. |
| InpBusy | 2.0 | Activity ratio at or above which the line is coloured busy. Must be above 1. |
| InpQuiet | 0.5 | Activity ratio at or below which the line is coloured quiet. Must be between 0 and 1. |
| InpShowVolume | true | Also draw raw tick volume against its average, as the dotted contrast line. |
Reading the Gauge from an Expert Advisor
The buffer layout is fixed in AcdTypes.mqh as ENUM_ACD_BUFFER, so an EA can rely on it through iCustom:
| Buffer | Contents |
|---|---|
| 0, ACD_BUF_ACTIVITY | Log base 2 of the activity ratio, the plotted line. |
| 1, ACD_BUF_COLOR | Colour index: 0 normal, 1 busy, 2 quiet. |
| 2, ACD_BUF_VOLUME | Log base 2 of tick volume against its average. |
| 3, ACD_BUF_RATIO | The activity ratio itself. This is the buffer an EA would normally read. |
| 4, ACD_BUF_EXPECTED | Forming bar only: the expected wait for the next quote, in milliseconds. |
#include <ACD\AcdTypes.mqh>

//--- the input groups take a slot each: "" passes the first one
int h=iCustom(_Symbol,PERIOD_M1,"ACD\\ACD_Activity","",0.020987,0.976518);

double r[1];
if(CopyBuffer(h,ACD_BUF_RATIO,1,1,r)==1 && r[0]!=EMPTY_VALUE && r[0]>=2.0)
   Print("the last closed bar ended at twice the normal pace or more");
A ready-made silence ratio is not published, because timer events are not delivered to an indicator created through iCustom, so a value refreshed between quotes would never reach the EA. Instead the EA can compute it: note GetTickCount64 each time a new tick arrives and, in its own timer, divide the milliseconds elapsed since then by buffer 4. A result well above 1 says the next quote is overdue.
A natural use is execution rather than direction: holding back a new order while the market runs at several times its normal pace, when spreads and slippage are often at their worst. Spreads were not measured in the tests above, so treat that as something to test on your own account.
Fitting Your Own Symbol
A month of quotes takes tens of seconds to fit, and an indicator runs on the chart's own thread, so fitting is done separately, in a script of your own. The library does the whole job in a few calls. CAcdEvents loads the ticks one day at a time and builds the event series, and CAcdModel fits the rhythm and the recursion on the first 70% of the events and scores them on the rest:
#include <ACD\AcdModel.mqh>

void OnStart()
  {
//--- thirty days of quotes on this symbol
   CAcdEvents ev;
   const datetime to=TimeCurrent();
   if(!ev.Load(_Symbol,to-30*86400,to))
      return;

//--- rhythm and recursion fitted on the first 70%, scored on the rest
   CAcdModel model;
   SAcdFit   fit;
   if(!model.SetEvents(ev) || !model.Calibrate(ACD_DIST_WEIBULL,fit))
      return;
   PrintFormat("alpha %.6f  beta %.6f  clustering gain on the test range %+.3f",
               fit.params.alpha,fit.params.beta,fit.ll_test-fit.base_ll_test);
  }
Paste the printed alpha and beta into the indicator's inputs. The gain is the improvement in log-likelihood per event over a rhythm-only model with no clustering at all; it should be positive on the held-out range, or the clustering the fit found is not real for that symbol. The Weibull shape the fit also reports is not needed live, because it enters the likelihood but not the expected wait.
The live state is a class too. CAcdState takes the fitted parameters and a fitted profile, and from then on each quote costs one update. An EA can therefore run the gauge itself, without the indicator:
#include <ACD\AcdState.mqh>

CAcdState state;

//--- once: the parameters and the rhythm from the fit above
state.Init(fit.params,model.Diurnal(),300);

//--- on every new tick
if(state.OnEvent((long)tick.time_msc))
   PrintFormat("activity %.2f, next quote expected in %.0f ms",
               state.ActivityRatio(),state.ExpectedWaitMs());
The time-of-day profile can also be built on its own with CAcdDiurnal, as the indicator does, by calling Setup, FitWaits and UnitMeanWaits over any range of events.
Limitations
- These are quotes from one broker, not trades. Quote changes reflect the broker's aggregation and filtering as well as the market. Parameters fitted on one feed do not transfer to another.
- Some feeds are not a market. On the author's account BTCUSD quotes arrived on a timer, nearly every wait close to a quarter of a second. Before fitting, check the coefficient of variation of the waits: random arrivals give 1, EURUSD gave 3.1, and below about 0.7 the feed is timer-driven. A clustering model fitted to a timer only describes the timer.
- The line does not fall during a sudden silence. The expectation only moves when a quote arrives, so when a burst ends abruptly, the line holds its last busy value until the next quote. The silence ratio covers that case, and an EA has to compute it itself, as described above.
- The Weibull fits the waits only approximately. Real waits have heavier tails than a Weibull allows, and a little structure remains at lags of one and two events after the fit. Neither affects how the gauge is read, but a more flexible distribution could move alpha and beta slightly.
- The evidence covers thirty days. Which of the ACD gauge and the rolling counts adds more shifted with the horizon and the asset class, and may shift again in other conditions.
- It needs tick history. Ten trading days of ticks are requested at load. On a fresh terminal the first load waits for the download.
File Structure
One indicator and five headers. The headers are included as <ACD\...>, so they must sit in an ACD subfolder under Include. They have no dependencies beyond the standard library's Math\Stat\Math.mqh.
| File | Role | Description |
|---|---|---|
| Indicators\ACD\ACD_Activity.mq5 | The indicator | Learns the rhythm from the days before the plot, replays the plotted days quote by quote, and draws the activity ratio with the tick volume contrast. Publishes fixed buffers for Expert Advisors. |
| Include\ACD\AcdTypes.mqh | Shared types | Parameters, the fit report, the buffer map, the one-step update, persistence and half-life helpers, and the Weibull log-density. |
| Include\ACD\AcdEvents.mqh | Event series | CAcdEvents turns the tick stream into events: same-millisecond folding, session gaps and day-by-day loading. |
| Include\ACD\AcdDiurnal.mqh | Daily rhythm | CAcdDiurnal, the time-of-day profile with interpolation between bin centers and unit-mean scaling, pooled or per weekday. |
| Include\ACD\AcdModel.mqh | Fitting | CAcdModel, the maximum-likelihood fit by Nelder-Mead with exponential or Weibull surprises, the rhythm-only baseline and residual diagnostics. |
| Include\ACD\AcdState.mqh | Live state | CAcdState, the constant-time live update: activity ratio, surprise, expected wait and silence ratio. |
Research Basis
The model follows:
- Robert F. Engle and Jeffrey R. Russell, Autoregressive Conditional Duration: A New Model for Irregularly Spaced Transaction Data, Econometrica, 1998, available on JSTOR.
A companion article explains the feed checks, the rhythm and the model step by step, and reports the full volatility study across six symbols: Beyond Tick Volume: Measuring Market Activity from the Waits Between Quotes.
Extrapolator
Extrapolator fits a sum of sinusoidal harmonics to the recent price history and extends the fitted curve to the right of the last bar as a forecast.The forecast is a mathematical extrapolation of past cyclical behaviour, not a guarantee of future price movement. The last part of the line is redrawn while the current model bar is forming, and the fitted curve changes with each refit.
 87.8 Percent from 2021 to YTD at 8.5 Percent MaxDD. The Nikkei EA That Only Buys When Volume Is Quiet
A free, fully open JPN225 (Nikkei 225) EA for M15. Buys when price leans up, momentum isn't stretched and volume is quiet. Backtest 2022 to 2026: profit factor 1.68, +18.5% a year, passed 15 stress tests. Flat by 17:00.
Trend BOSS
The Trend BOSS Indicator identifies regimes such as trending, ranging or volatile using a Bag-of-SFA-Symbols (BOSS) classifier. Gate your strategies behind specific regimes or use the indicator to identify various market conditions.
 ATS Risk Library - lot size from the stop, daily loss, drawdown and exposure guards
A small include file for Expert Advisors and trade managers. It turns your risk rules into yes/no answers: how many lots does this stop allow, is the daily loss limit reached, is the maximum drawdown (static or trailing) reached, how much is at risk across all open positions, and are spread and session acceptable. The lot is never rounded up: if the broker minimum lot would risk more than allowed, the trade is skipped and the reason is returned. Limits survive a terminal restart. The library only measures: it sends no order. Includes a demo account guard (no trading by default) and a self-test with 78 checks.