 MetaTrader 5
 Experts
 지표
지표
 스크립트
스크립트
 라이브러리
라이브러리
 보관함
보관함
당사 팬 페이지에 가입하십시오

- 조회수:
- 128
- 평가:
- 게시됨:
-
 이 코드를 기반으로 한 로봇이나 지표가 필요하신가요? 프리랜스로 주문하세요
프리랜스로 이동
이 코드를 기반으로 한 로봇이나 지표가 필요하신가요? 프리랜스로 주문하세요
프리랜스로 이동

StopDistance shows, in a separate window, the range of every bar (High − Low) in symbol points, the moving average of that range and a suggested stop distance, which is the average multiplied by a factor. It answers one practical question before a trade is placed: how far does this symbol normally move within a single bar of the current timeframe, in the same unit the stop loss is entered in.
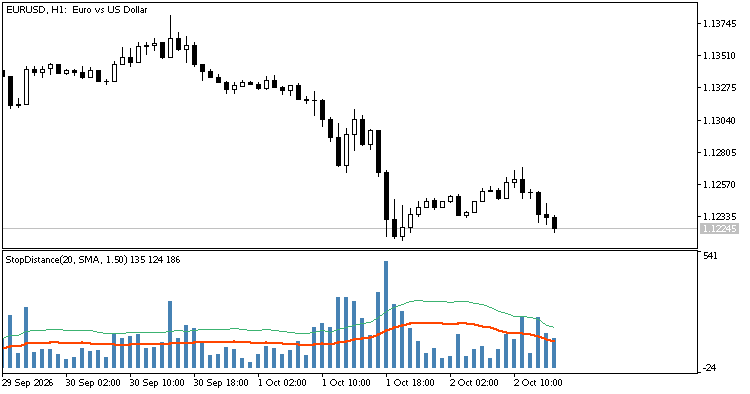
StopDistance(20, SMA, 1.50) on EURUSD H1: bar range (histogram), its average (red) and the suggested stop (green)
The idea
A stop loss placed closer than the typical bar range is taken out by ordinary market noise, before the trade idea has had time to work. Volatility is usually read from ATR, but ATR is displayed in price units, while a stop loss in the order dialog and in most Expert Advisors is set in points. StopDistance reports everything in points, so the number read from the indicator can be used as a stop distance without conversion.
The calculation is deliberately simple and easy to verify by hand: the range of a bar is (High − Low) / Point. Unlike ATR, gaps between bars are not included, so the value describes the movement inside a bar only. The indicator does not generate entry or exit signals; it is a measuring tool.
How to read it
- Blue histogram: the range of each bar in points.
- Red line: the average range over the last Period bars (SMA or EMA).
- Green dashed line: the suggested stop distance, equal to the average multiplied by the Stop factor.
A stop distance below the red line lies inside the range of an ordinary bar and is likely to be hit by noise alone. The green line is a starting point for the minimum distance, not a recommendation for a particular trade: the right factor depends on the timeframe and on how many bars the position is expected to stay open. The three current values are shown in the header of the indicator subwindow and in the Data Window.
Input parameters
| Parameter | Default | Description |
|---|---|---|
| Averaging period (InpPeriod) | 20 | Number of bars used for the average. Must be 1 or greater. |
| Averaging method (InpMethod) | Simple (SMA) | Simple (SMA) or Exponential (EMA). The EMA is seeded with the SMA of the first Period bars. |
| Stop factor (InpStopFactor) | 1.5 | Multiplier applied to the average to get the suggested stop line. Must be greater than 0. |
Using it from an Expert Advisor
The indicator has three buffers that can be read with iCustom and CopyBuffer: buffer 0 is the bar range, buffer 1 is the average and buffer 2 is the suggested stop. All of them are in points. The value of the forming bar changes until the bar closes, so decisions are better taken from the last closed bar (shift 1).
int g_handle=INVALID_HANDLE;
//+------------------------------------------------------------------+
//| Expert initialization function                                   |
//+------------------------------------------------------------------+
int OnInit()
  {
//--- period 20, SMA, stop factor 1.5
   g_handle=iCustom(_Symbol,_Period,"StopDistance",20,0,1.5);
   return(g_handle==INVALID_HANDLE ? INIT_FAILED : INIT_SUCCEEDED);
  }
//+------------------------------------------------------------------+
//| Expert tick function                                             |
//+------------------------------------------------------------------+
void OnTick()
  {
//--- suggested stop of the last closed bar, in points
   double stop[];
   if(CopyBuffer(g_handle,2,1,1,stop)==1)
      Print("Suggested stop, points: ",stop[0]);
  }
Notes
- All values are in symbol points, not pips. On a 5-digit EURUSD quote 150 points are 15 pips.
- The calculation is incremental: after the first pass only the forming bar is recalculated on each tick, so the indicator stays cheap on long histories.
- The average and the stop line start at bar Period − 1, the first bar with a full averaging window behind it.
- Works on any symbol and timeframe. Invalid input values are rejected at initialization with a message in the Experts log.
 Buffer Inspector Kb
Shows what every buffer of an indicator holds - arrows, a line or a colour index - and labels the arrows on the chart with their buffer numbers. Works with compiled indicators without source code.
 Session Range Boxes with Killzones, Breakout Alerts and Stats
Asian, London and New York session high/low boxes with ICT killzone shading, breakout alerts and average-range statistics panel.
ExportBars - bars to CSV that pandas reads without arguments
Exports bars to a CSV file that pandas.read_csv() loads without encoding, separator or date-format arguments: ISO 8601 timestamps, prices at the symbol's own digits, single-byte encoding. Two modes (last N bars or a date range) and a switchable separator for Excel.
Support and Resistance Channels Ranked by Strength
Support and resistance channels built from price pivots and ranked by strength: each pivot inside a channel and each bar that touched it adds to its score. The strongest channels run across the whole chart, colored by where price is, with break arrows, pivot marks, two averages and alerts.