 MetaTrader 5
 Experts
 지표
지표
 스크립트
스크립트
 라이브러리
라이브러리
 보관함
보관함
당사 팬 페이지에 가입하십시오

Arixis Market Regime Map - Trend, Range and Volatility Classifier - MetaTrader 5용 지표

I develop advanced tools for MetaTrader 5 focused on trading analytics, risk monitoring, execution analysis, and algorithmic trading.
- 조회수:
- 151
- 평가:
- 게시됨:
- 업데이트됨:
-
 이 코드를 기반으로 한 로봇이나 지표가 필요하신가요? 프리랜스로 주문하세요
프리랜스로 이동
이 코드를 기반으로 한 로봇이나 지표가 필요하신가요? 프리랜스로 주문하세요
프리랜스로 이동

Arixis Market Regime Map is a market-state classification indicator for MetaTrader 5 designed to answer a simple but important question:
What type of market am I trading right now?
Instead of generating Buy or Sell signals, the indicator analyzes price behavior and classifies the current market into four primary regimes:
- TREND UP
- TREND DOWN
- RANGE
- TRANSITION
The classification is based on a combination of quantitative measurements including price efficiency, normalized directional slope, volatility, market structure and agreement across multiple analysis horizons.
One of the core measurements is the Efficiency Ratio, which compares the net displacement of price with the total distance travelled during the same period. This helps distinguish directional movement from noisy or ranging price action.
Arixis Market Regime Map combines this information with directional and structural measurements to produce a transparent assessment of the current market regime.
Main features
- Automatic classification of Trend Up, Trend Down, Range and Transition
- Non-repainting / causal calculations based on information available at the evaluated bar
- Multi-horizon market analysis
- Price Efficiency measurement
- Normalized Direction Score
- Market Structure analysis
- Regime Strength measurement
- Historical regime visualization
- Hysteresis logic to reduce unnecessary regime switching
- Works with different symbols and timeframes
- Lightweight and designed for real-time use
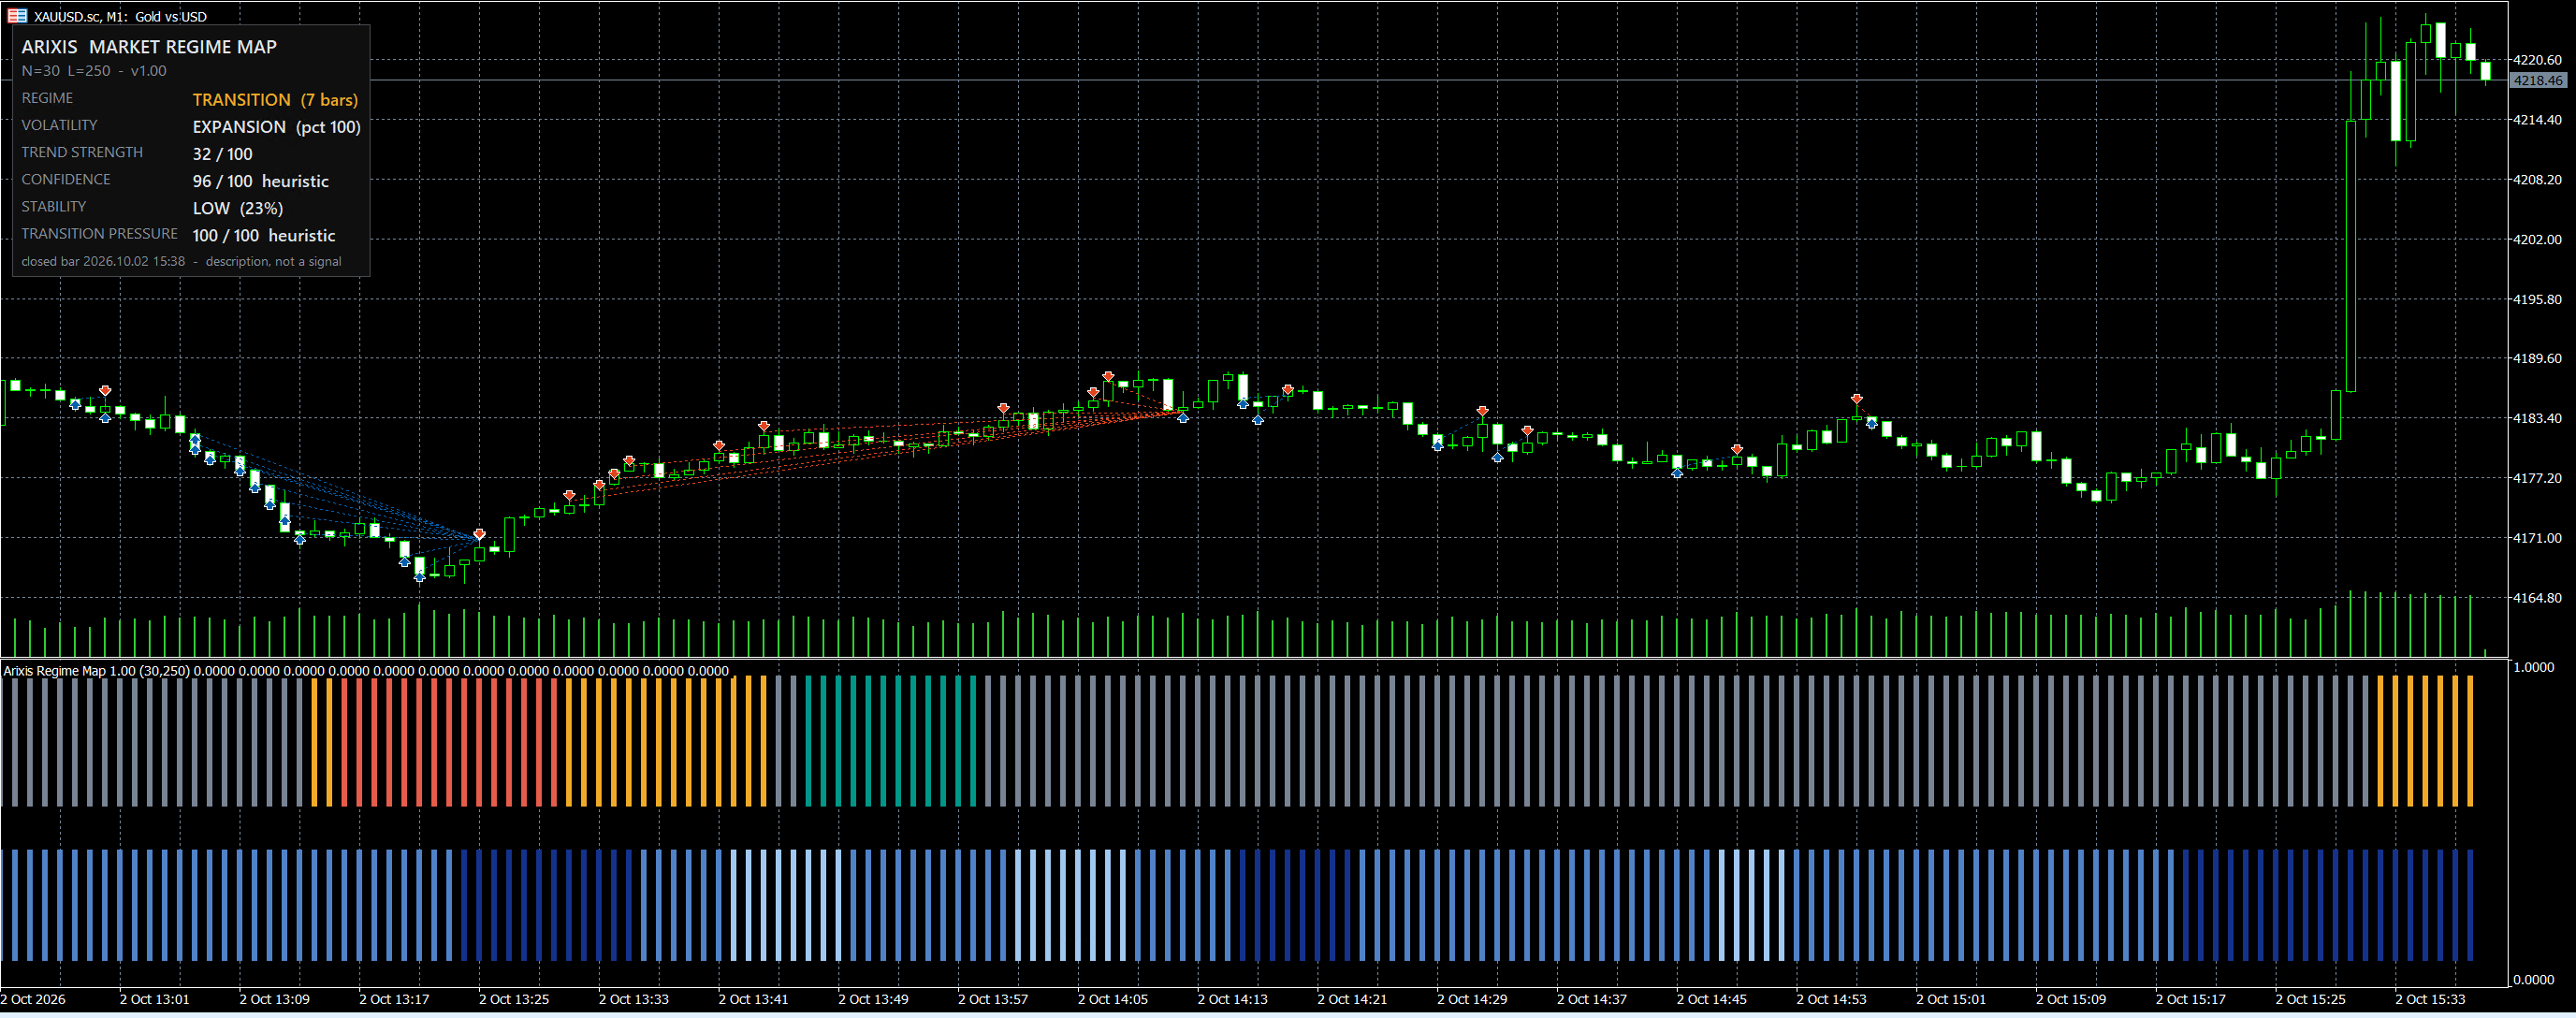
Regime Strength
The indicator also calculates a Regime Strength value representing how strongly the available quantitative evidence supports the detected market state.
Regime Strength is not a probability of future price movement and should not be interpreted as a prediction that price will rise or fall.
Designed for analysis, not prediction
Arixis Market Regime Map does not attempt to predict the next candle or guarantee future market direction.
Its purpose is to provide a structured and quantitative description of the current market environment.
This can be useful for:
- discretionary traders
- algorithmic traders
- Expert Advisor developers
- strategy research
- regime filtering
- identifying transitions between trending and ranging conditions
- understanding when the behavior of a strategy changes across different market environments
For example, a trend-following system may behave differently during a RANGE regime, while a mean-reversion strategy may react differently during strong directional expansion.
Transparent quantitative approach
The indicator is built around interpretable mathematical measurements rather than opaque Buy/Sell signals.
The objective is not to tell the trader what trade to take, but to provide a clearer representation of the market structure in which a trading decision or algorithm is operating.
Arixis Market Regime Map — Understand the market environment before evaluating the strategy.
 Edge or Luck: bootstrap test of your average trade
Resamples your closed trades 10,000 times to show whether your average trade is an edge or could still be luck: the 95% range of the average and the chance it is below zero.
Prop Firm Daily Loss Tracker - Daily Loss Limit Monitor
Shows the day's result against the daily and max loss limits of a prop firm account, with a warning alert, in a panel on the chart.
ICT Killzones and Session Pivots
ICT killzones for MetaTrader 5: Asia, London and New York sessions drawn in New York time with automatic daylight-saving conversion, session highs and lows carried forward until price takes them, previous day, week and month levels, opening prices and time markers. One file, no DLL.
 AN Guard Lite - Trade Journal and Report for any EA
Writes a CSV journal of every trade with the exit reason, and a report that shows how far each trade ran, in R. It never trades.