 MetaTrader 5
 Experts
 지표
지표
 스크립트
스크립트
 라이브러리
라이브러리
 보관함
보관함
당사 팬 페이지에 가입하십시오

- 조회수:
- 2094
- 평가:
- 게시됨:
- 업데이트됨:
-
 이 코드를 기반으로 한 로봇이나 지표가 필요하신가요? 프리랜스로 주문하세요
프리랜스로 이동
이 코드를 기반으로 한 로봇이나 지표가 필요하신가요? 프리랜스로 주문하세요
프리랜스로 이동

Market Structure Shift (CHoCH)
-
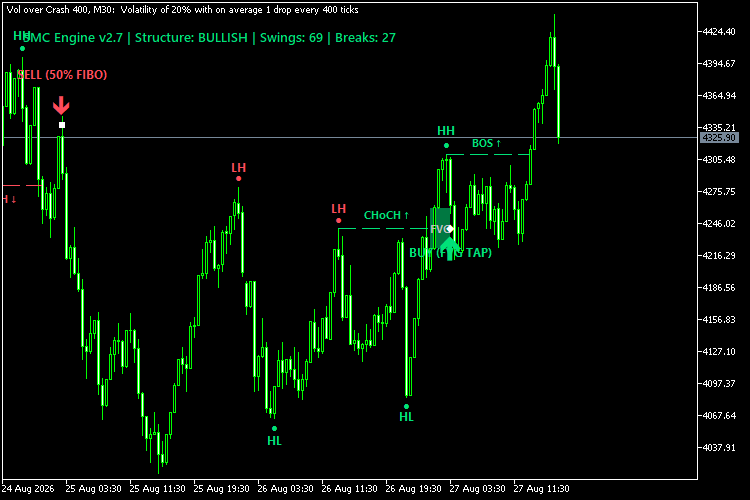
Bullish Setup (CHoCH ↑): Price breaks above the previous confirmed Lower High (LH), signaling a trend reversal from bearish to bullish.
-
Bearish Setup (CHoCH ↓): Price breaks below the previous confirmed Higher Low (HL), signaling a trend reversal from bullish to bearish.
2. Areas of Interest (AOI) Mapping
Once CHoCH confirms, two institutional entry zones are calculated:
-
Fibonacci Equilibrium
-
Bullish: Drawn from origin Swing Low
- Post-CHoCH Fair Value Gap (FVG):
-
-
-
Formed within the first 3 candles of the breakout impulse (institutional imbalance zone).
-
Trade Management (SL & TP)
-
Stop Loss (SL):
-
Buy: Placed below the origin swing low 0.0% 0.0% Fibo anchor).
-
Sell: Placed above the origin swing high (0.0%0.0% Fibo anchor).
-
-
Take Profit (TP):
-
TP1: Structural breakout high/low (100.0% 100.0% level).
-
TP2: Opposing major liquidity pool / next structural swing.
-
 Auto ZigZag Fibonacci Golden Zone Indicator For MT5
The Auto ZigZag Fibonacci Golden Zone indicator automatically detects the latest swing high and low, draws key Fibonacci retracement levels (50%, 61.8%, 78.6%), and highlights the Golden Zone between 61.8% and 78.6% as an optimal pullback entry area. The indicator includes a real-time dashboard, optional buy/sell signals, and full color customization. Works on all symbols and timeframes. Always test on a demo account before live trading.
Volume Profile Levels Indicator
Builds a horizontal volume histogram over a recent lookback window and marks the Point of Control and Value Area using the standard TPO/volume value-area expansion algorithm — not just POC ± a fixed offset. Refreshed once per new bar, drawn as a sidebar next to price.
Support Resistance zig zag based
Support Resistance zig zag based is a Price Action indicator designed to automatically and dynamically map Support, Resistance, and transition areas (Flip Zones) on the chart. It focuses purely on clear price structure mapping and highlighting key bounce areas (SBR & RBS). It also includes an interactive dashboard to monitor real-time market bias.
 RepaintTest - measure whether a drawing indicator repaints
Measures whether a drawing indicator repaints, instead of asserting that it does not. The invariant: once a bar has closed and been processed, no object drawn on it may ever change - not move, not recolour, not change its text, and not disappear. The script seeds a custom symbol with real history, attaches your indicator through a template, records every object, appends bars, forces a full recalculation, and compares object by object. Changes and disappearances are counted separately, because only a change means the claim is false. A run that compared nothing is reported as INCONCLUSIVE, never as a pass. Output is a CSV you can publish next to the number.