당사 팬 페이지에 가입하십시오

Candle Body Ratio - MetaTrader 5용 지표

Services:
• Custom Expert Advisors (EA) from scratch
• Trading bot development with risk management
- 조회수:
- 3132
- 평가:
- 게시됨:
-
 이 코드를 기반으로 한 로봇이나 지표가 필요하신가요? 프리랜스로 주문하세요
프리랜스로 이동
이 코드를 기반으로 한 로봇이나 지표가 필요하신가요? 프리랜스로 주문하세요
프리랜스로 이동
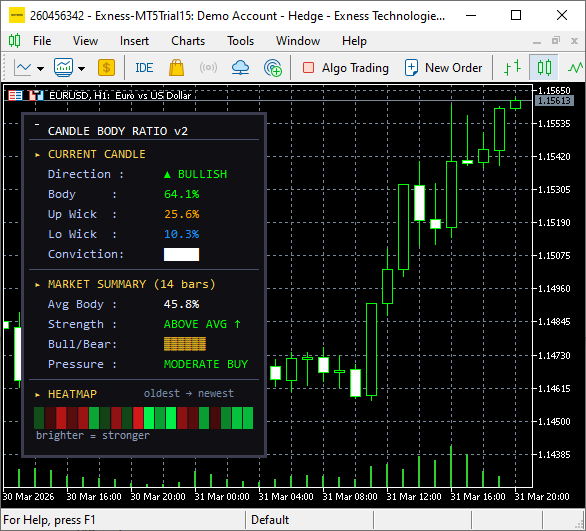
Candle Body Ratio v2: Strength Meter with Heatmap
This indicator measures the body-to-wick ratio of each candle and displays a floating dashboard directly on the chart. It tells you at a glance how strong or weak the current candle is, what the average body ratio looks like over a chosen lookback period, and whether bulls or bears have been dominant. A color-coded heatmap strip shows the last N candles ranked by body strength, where brighter color means stronger conviction.
The panel is divided into three sections. The first section shows the current candle with its body percentage, upper wick, lower wick, and a conviction rating. The second section shows a market summary over the lookback period including average body ratio, a bull vs bear dominance bar, and a pressure label. The third section is the heatmap strip showing recent candles colored from dark (weak) to bright (strong), with the oldest candle on the left and the newest on the right.
All visual elements are fully customizable through input parameters. You can adjust colors, thresholds, font size, panel position, and lookback period. An optional alert fires when the current candle meets the strong body threshold.
Input Parameters
| Parameter | Default | Description |
|---|---|---|
| InpPanelX | 20 | Horizontal position of the panel in pixels from the left edge of the chart. |
| InpPanelY | 30 | Vertical position of the panel in pixels from the top edge of the chart. |
| InpLookback | 14 | Number of past bars used to calculate average body ratio and bull/bear dominance count. |
| InpHeatmapBars | 20 | Number of recent candles shown in the heatmap strip. Each candle is represented as a colored block. |
| InpStrongBody | 0.70 | Body ratio at or above this value is classified as a strong candle. Triggers STRONG BUY or STRONG SELL label and optional alert. |
| InpWeakBody | 0.30 | Body ratio at or below this value is classified as weak or indecision. Wick ratios are then compared to determine buy or sell pressure. |
| InpBullColor | Lime | Color used for bullish candle labels and signals. |
| InpBearColor | Red | Color used for bearish candle labels and signals. |
| InpNeutralColor | Gray | Color used for indecision or neutral signal labels. |
| InpPanelBG | C'15,15,20' | Background fill color of the panel. |
| InpBorderColor | C'60,60,80' | Color of the outer border frame around the panel. |
| InpTextColor | White | Main text color used for values and labels on the panel. |
| InpDimColor | C'200,200,220' | Dimmed color used for secondary or less important label text. |
| InpFontSize | 9 | Base font size in points for all panel text. Section hints render one point smaller. |
| InpShowAlert | true | When enabled, fires a terminal alert on the first tick of any candle whose body ratio meets or exceeds InpStrongBody. |
| File name | Description |
|---|---|
| CandleBodyRatio.mq5 | Indicator source code for MetaTrader 5 |
ASQ Divergence Detector
ASQ Divergence Detector scans your chart for regular and hidden RSI divergences and marks them with color-coded, non-repaint arrows.
Institutional Cumulative Volume Delta (CVD)
An advanced order flow engine that approximates tick-by-tick aggressor data to calculate the true Cumulative Volume Delta, it exposes institutional absorption and divergence hidden within standard price candles.
 Portfolio Scorer — Multi-EA Correlation and Coverage Analyzer
Portfolio Scorer is a standalone MQL5 script that evaluates the quality of a multi-EA portfolio across three critical dimensions that most algo traders overlook. The script reads daily profit and loss data from CSV files (one per Expert Advisor), computes a full Pearson correlation matrix between every strategy pair, maps trading activity by UTC hour and weekday, detects asset class diversity, and produces a weighted composite score with a letter grade from A+ to F. How it works: The tool runs in four sequential stages. First, the Data Loader reads and validates CSV files containing daily returns for each EA in the portfolio. Second, the Correlation Engine calculates the complete NxN Pearson correlation matrix and flags pairs that exceed a configurable threshold. Third, the Coverage Analyzer maps which hours and weekdays have active trading and identifies blind spots. Fourth, the Scoring Function combines all three dimensions into a single composite score using adjustable weights.
ASQ Spread Logger
Real-time spread monitor with statistics panel, CSV logging & alerts