거래 로봇을 무료로 다운로드 하는 법을 시청해보세요
당사를 Twitter에서 찾아주십시오!
당사 팬 페이지에 가입하십시오
당사 팬 페이지에 가입하십시오
스크립트가 마음에 드시나요? MetaTrader 5 터미널에서 시도해보십시오
- 조회수:
- 10847
- 평가:
- 게시됨:
- 업데이트됨:
-
 이 코드를 기반으로 한 로봇이나 지표가 필요하신가요? 프리랜스로 주문하세요
프리랜스로 이동
이 코드를 기반으로 한 로봇이나 지표가 필요하신가요? 프리랜스로 주문하세요
프리랜스로 이동
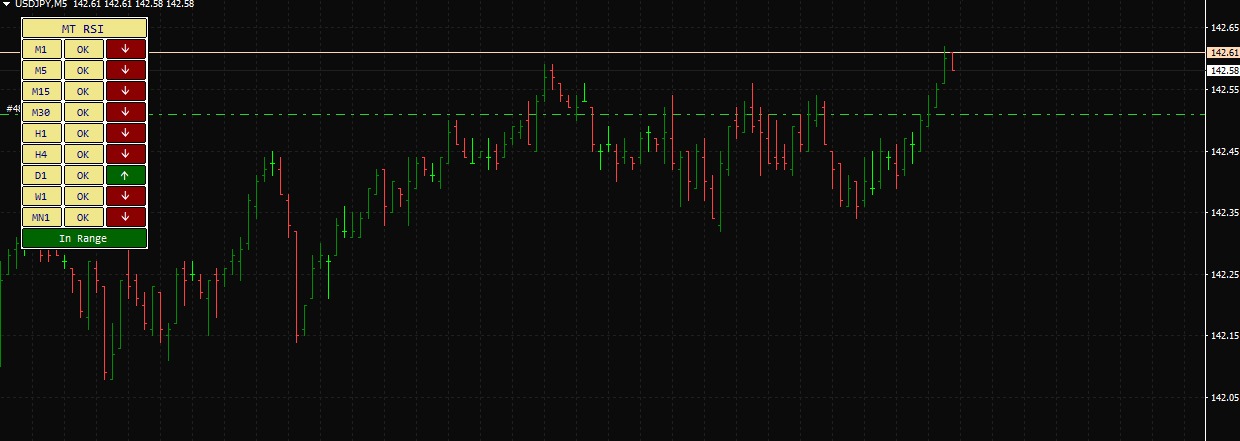
A powerful multi-timeframe RSI dashboard that visually displays the overbought, oversold, and neutral RSI status across 9 different timeframes — from M1 to MN1.
Key Features
-
RSI readings across M1 to MN1 in one view
-
Color-coded status: Overbought, Oversold, In Range
-
Works on any chart or symbol
 EA Stochastic Bollinger Bands Multi - Timeframe
This MQL4 code implements an Expert Advisor (EA) that trades based on the Stochastic Oscillator and Bollinger Bands indicators across multiple timeframes (M1, M5, and M15).
 Fair Value Gaps
Fair Value Gaps indicator or 'imbalance areas' where markets often move back to.
Range Breakout Indicator - Indicator Buffer Only
This indicator for Breakout Strategy. It doesn't print objects on the chart.
BBMA - Bollinger Band Moving Average
All indicators required by BBMA Strategy in a single indicator.