당사 팬 페이지에 가입하십시오
- 조회수:
- 6155
- 게시됨:
-
 이 코드를 기반으로 한 로봇이나 지표가 필요하신가요? 프리랜스로 주문하세요
프리랜스로 이동
이 코드를 기반으로 한 로봇이나 지표가 필요하신가요? 프리랜스로 주문하세요
프리랜스로 이동
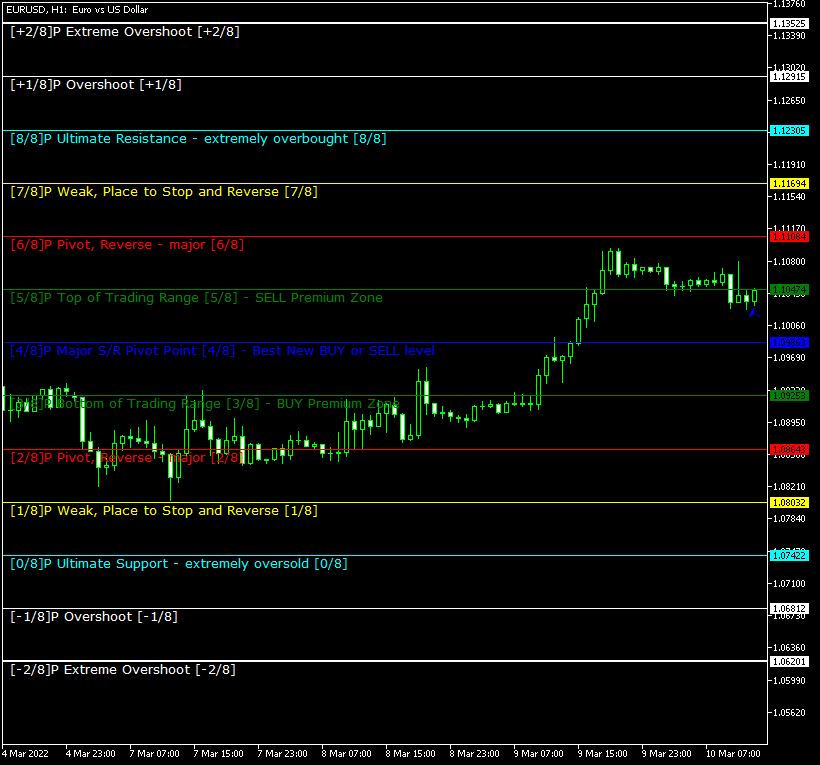
Murrey Math Line X MetaTrader indicator — a pivot line indicator that will definitely help every trader who knows how to trade with support, resistance, and pivot lines. It displays 8 primary lines (with 5 more additional ones) on the main chart, helping you to find the best points to sell, buy, and exit your positions. The indicator can issue alerts when a candle closes after breaking any of the pivot lines. You can download this indicator for MT4 and MT5 platform.
Input parameters
- Period (default = 64) — a period in bars or in other upper timeframe periods (set via the UpperTimeFrame input), on which the lines will be calculated. The lower the number the more up-to-date but less accurate calculations.
- UpperTimeframe (default = PERIOD_D1) — a basic period; if different from the current timeframe, the indicator will use Period × UpperTimeframe periods to calculate its lines. Otherwise, the indicator will use Period of the current chart bars to calculate its lines.
- StepBack (default = 0) — a shift back for calculating the lines (in the current bars or in the number of UpperTimeframe periods).
- LabelSide (default = Left) — the side of the screen to display the line labels. If you select Right, make sure, the chart is shifted to the left; otherwise, you won't be able to see the labels.
- [N]/8 Color — colors for the indicator lines.
- [N]/8 Width — the indicator lines' width.
- MarkColor (default = clrBlue) — the color for the last calculated bar's arrow.
- MarkNumber (default = 217) — the arrow code for the last calculated bar's arrow.
- FontFace (default = "Verdana") — the font face to use for display.
- FontSize (default = 10) — the font size to use for display.
- ObjectPrefix (default = "MML-") — prefix for chart objects for compatibility with other indicators.
- TriggerCandle (default = Previous) — the candle to issue alerts on: Previous — the most recently closed candle or Current — the yet unfinished candle.
- NativeAlerts (default = false) — if true, a native MetaTrader popup alert will be used when a signal appears. Not present in cTrader.
- EmailAlerts (default = false) — if true, an email message will be sent when a signal appears. Email should be properly configured in MetaTrader via Tools->Options->Email.
- NotificationAlerts (default = false) — if true, an email message will be sent when a signal appears. Notifications should be properly configured in MetaTrader via Tools->Options->Notifications.
 Moving Average Candlesticks MT4
Moving Average Candlesticks MetaTrader indicator — is a chart visualization of a standard moving average using the candlestick bars. It draws the candlesticks based on the moving average values calculated for Close, Open, Low, and High. It allows seeing a compact snapshot of the more detailed market information compared with the classic MA indicator. It works with any currency pair, timeframe, and MA mode. The indicator is available for MT4 and MT5.
Market Profile MT4
Market Profile MetaTrader indicator — is a classic Market Profile implementation that can show the price density over time, outlining the most important price levels, value area, and control value of a given trading session. This indicator can be attached to timeframes between M1 and D1 and will show the Market Profile for daily, weekly, monthly, or even intraday sessions. Lower timeframes offer higher precision. Higher timeframes are recommended for better visibility. It is also possible to use a free-draw rectangle session to create a custom market profile on any timeframe. Six different color schemes are available to draw the profile's blocks. Drawing profiles as a plain color histogram is also possible. Alternatively, you may choose to color the profile based on bullish/bearish bars. This indicator is based on bare price action and does not use any standard indicators. It is available for MetaTrader 4, MetaTrader 5
Gain/Loss Info MT4
Gain/Loss Info MetaTrader indicator — displays the gains and losses for all candles where the given threshold is surpassed. The values are calculated in points and percentage. The indicator can calculate gain/loss in two modes: plain candlestick Close and Open difference, and as difference between current Close and previous Close. You can set minimum change limits (for pips and percentage), change modes, and you can also control font color of the output numbers. The indicator is available for both MT4 and MT5.
Keltner Channel MT4
Keltner Channel (MetaTrader indicator) — is a classical technical analysis indicator developed by Chester W. Keltner in 1960. The indicator is somewhat similar to the Bollinger Bands and Envelopes. It uses three plot lines: the middle line is the 10-day simple moving average applied to the typical price ((high + low + close) / 3), the upper and the lower bands are produced by adding and subtracting the moving average of the daily price range (High and Low difference) from the middle line. This way, a volatility-based channel is built. In this version of the indicator you can modify all the parameters of the MA. The indicator is available both for MT4 and MT5 versions of the platform.