당사 팬 페이지에 가입하십시오

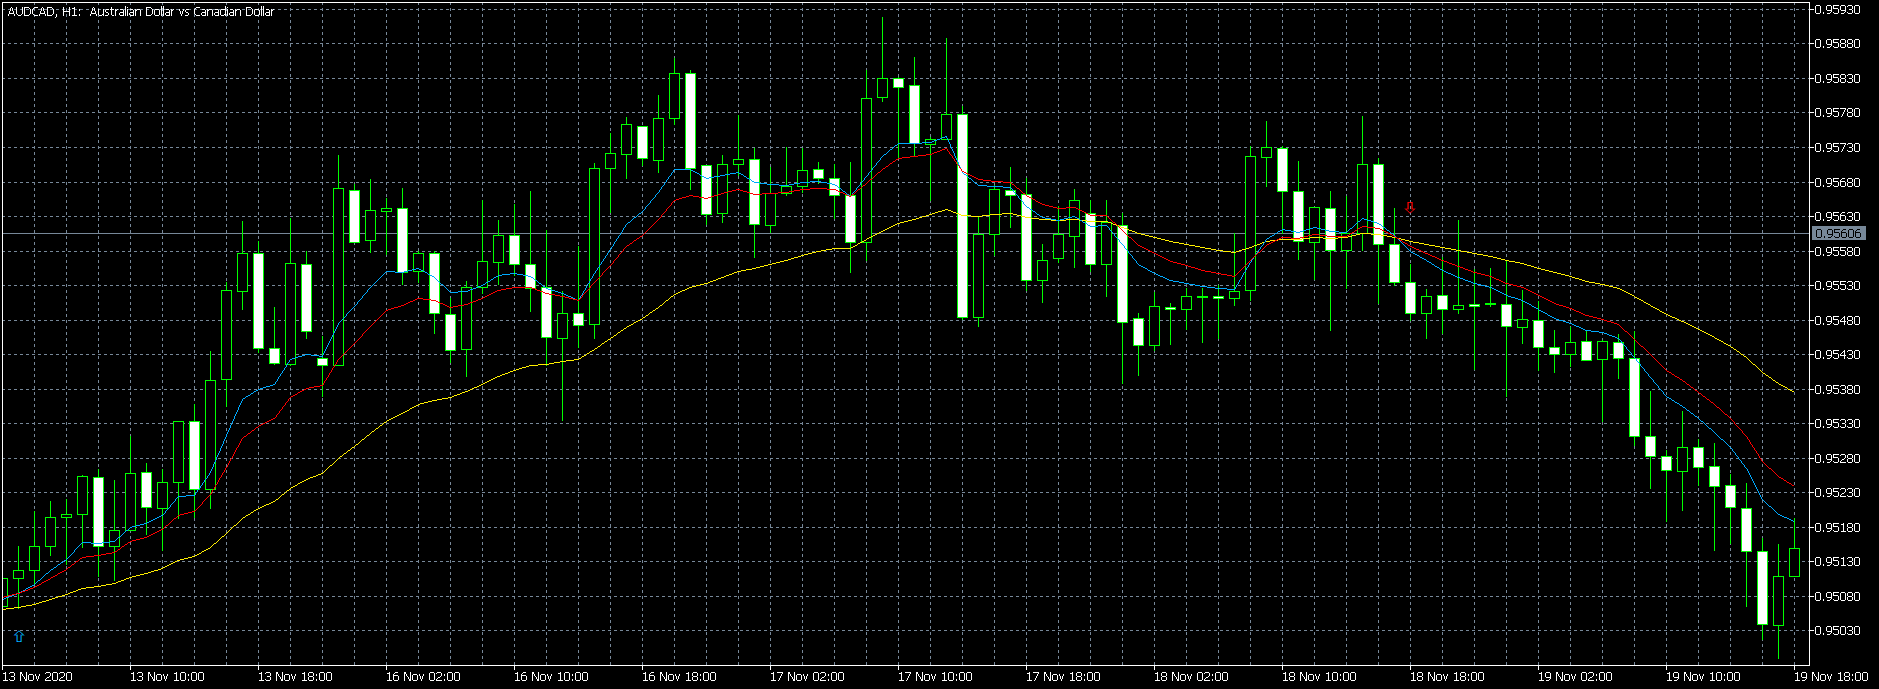
Swing trading 3 EMA Crossover MQL5 - MetaTrader 5용 지표

- 조회수:
- 27589
- 평가:
- 게시됨:
- 업데이트됨:
-
 이 코드를 기반으로 한 로봇이나 지표가 필요하신가요? 프리랜스로 주문하세요
프리랜스로 이동
이 코드를 기반으로 한 로봇이나 지표가 필요하신가요? 프리랜스로 주문하세요
프리랜스로 이동
There is no magic in moving averages but they can be used to form the basis of a simple trading strategy that works.
For some reason, Forex traders especially enjoy these types of strategies. You can develop many trading systems using averages but remember that complex trading strategies are not always best.
The Triple Moving Averages
As I mentioned, the 3 EMA’s will have different lengths and they will be:
- 55 period EMA
- 21 period EMA
- 9 period EMA
The 55 EMA will be considered the longer term trend direction indicator:
- When the 55 EMA is below both the 9 and 21, we will consider the trend to be up
- When the indicator is above both of the shorter term moving averages, we will consider the longer term trend to be down
The 21 EMA is considered a medium term trend indicator:
- We want to see the 21 below the 9 and above the 55 for an uptrend
- The 21 should be above the 9 and below the 55 for a down trend
The 9 period will be seen crossing over and under the 21 period more times than crossing the 55:
- The 9 EMA crossing over the 21 while already above the 55, is an uptrend and looking for a buy trade
- If it crosses below the 21 while already below the 55, that is a down trend and looking for a sell trade
Swing trading 3 EMA Crossover mql4 version: https://www.mql5.com/en/code/31999
PivotPointsLines _v1.1
Draws Pivot Points Level Lines for formula's Floor,Fibonacci,Camarilla,Woodie
Stoch RSI MT5
The Stochastic RSI indicator (Stoch RSI) is essentially an indicator of an indicator. It is used in technical analysis to provide a stochastic calculation to the RSI indicator. This means that it is a measure of RSI relative to its own high/low range over a user defined period of time. The Stochastic RSI is an oscillator that calculates a value between 0 and 1 which is then plotted as a line. This indicator is primarily used for identifying overbought and oversold conditions.
Reflex and Trendflex
Reflex and Trendflex was created by John Ehlers ("Stocks & Commodities Feb. 2020 (6-8)").
 strategy - behavioral design pattern
define a family of algorithms, encapsulate each one, and make them interchangeable. strategy lets the algorithm vary independently from clients that use it