당사 팬 페이지에 가입하십시오

- 조회수:
- 37057
- 평가:
- 게시됨:
- 업데이트됨:
-
 이 코드를 기반으로 한 로봇이나 지표가 필요하신가요? 프리랜스로 주문하세요
프리랜스로 이동
이 코드를 기반으로 한 로봇이나 지표가 필요하신가요? 프리랜스로 주문하세요
프리랜스로 이동
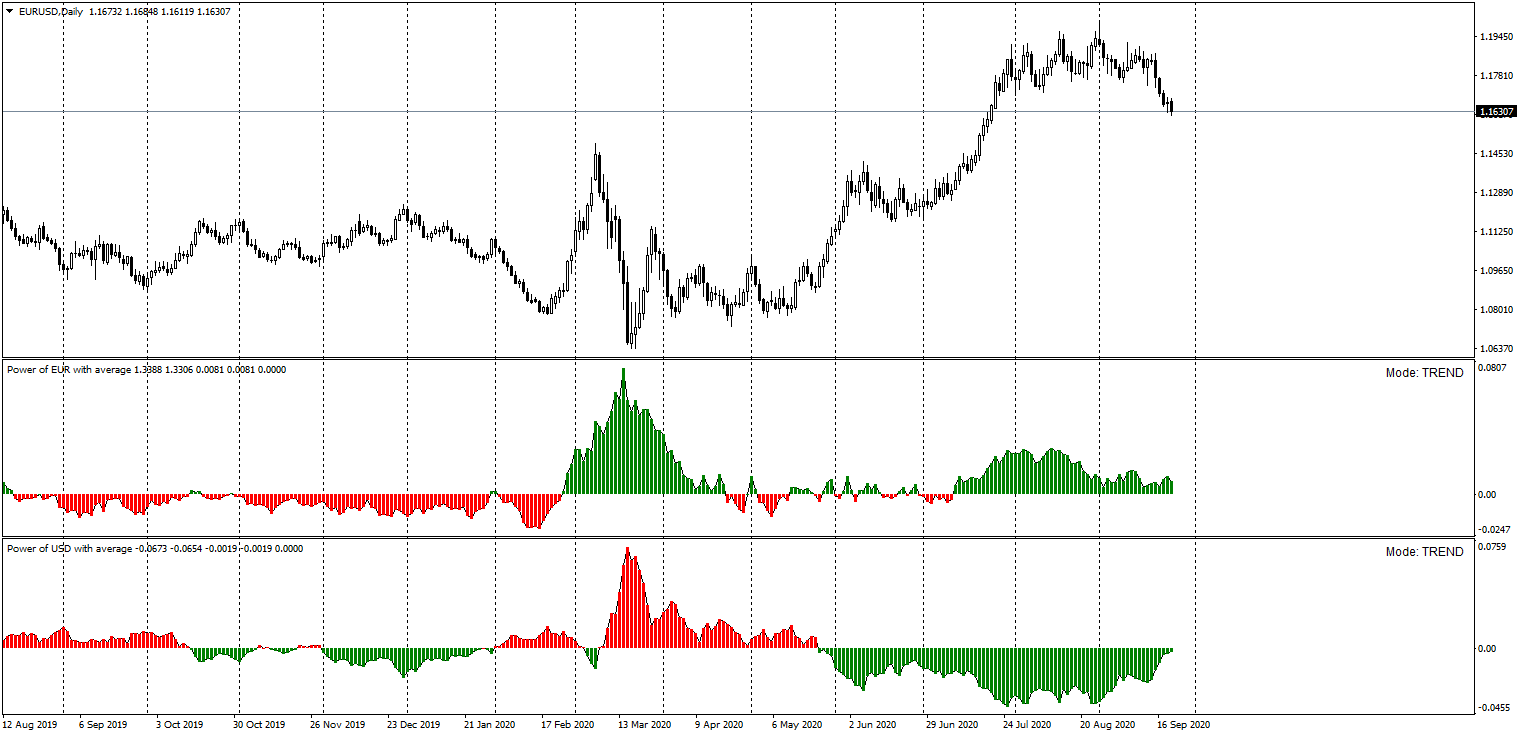
Power of XXX with average indicator description.
Version 229.201
The indicator is new version of previously published indicator showing relative actual strength of currency XXX.
Zero line (0.0) presents average with chosen period (AveragePeriod variable).
The indicator calculates its value of close prices of 7 pairs containing currency XXX.
Colored histogram was added to simplify interpretation of the market situation.
Now you have 2 mode options to choose:
-
TREND
-
COUNTER-TREND
The same color on BASE and QUOTE in equal mode means higher oportunity to trade in correct direction.
Instance 1 = BUY:
EUR USD.
You chose mode TREND for Power of EUR with average and for Power of USD with average.
Both indicators show GREEN color you should be prepared to BUY pair EUR USD.
Instance 2 = SELL:
EUR USD.
You chose mode TREND for Power of EUR with average and for Power of USD with average.
Both indicators show RED color you should be prepared to SELL pair EUR USD.
 Power of NZD with average
Power of NZD indicator shows actual strength of currency NZD calculated of 7 pairs that contain NZD. Indicator can be used for strategies based on mean reversion and/or correlation. Included pairs: EUR NZD, GBP NZD, AUD NZD, NZD USD, NZD CAD, NZD JPY, NZD CHF.
Power of JPY with average
Power of JPY indicator shows actual strength of currency JPY calculated of 7 pairs that contain JPY. Indicator can be used for strategies based on mean reversion and/or correlation. Included pairs: USD JPY, EUR JPY, GBP JPY, AUD JPY, CAD JPY, NZD JPY, CHF JPY.
StdScore v4.2
An oscillator that duplicates the chart of a selected asset in a separate window in three ways: line, bars and candles. This is essentially an indicator Bollinger bands, displayed in a separate window. In my opinion, it will be useful for beginners as a way to look at various technical signals from a different angle. This indicator helped me in an adviser for filtering unfavorable moments for trades.
 Order History Lines Drawer
Short description: This Script will draw a line from the open to the close for each order in you account history. please show all history in account history before using this script.