당사 팬 페이지에 가입하십시오

Price in polar coordinate system - MetaTrader 5용 지표

- 조회수:
- 14334
- 평가:
- 게시됨:
- 업데이트됨:
-
 이 코드를 기반으로 한 로봇이나 지표가 필요하신가요? 프리랜스로 주문하세요
프리랜스로 이동
이 코드를 기반으로 한 로봇이나 지표가 필요하신가요? 프리랜스로 주문하세요
프리랜스로 이동
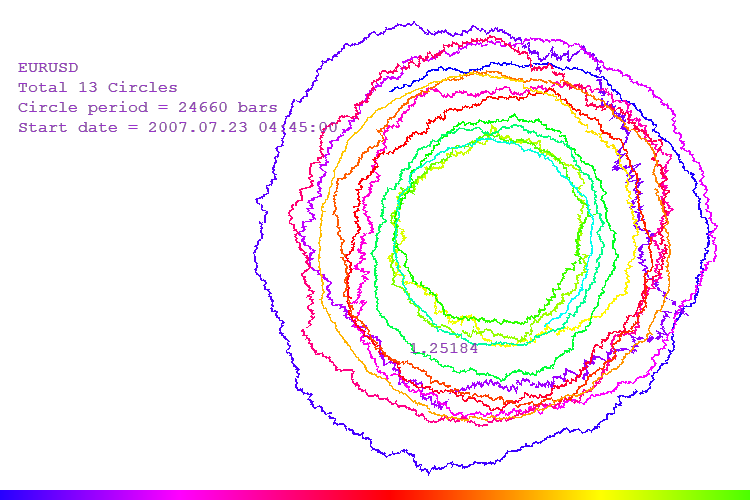
I want to remind you that for you to see the maximum data history on the screen, you need to set unlimited in the settings "Max bar in chart"(Tools ->Options->Charts).
The position of the mouse changes the parameters of the polar coordinate system:
- Changes in the start date of data output are set using the mouse position on the X axis (the maximum amount of data will be displayed when the mouse pointer is in the leftmost position)
- Changing the period of one loop is the position of the mouse pointer along the Y axis (the minimum period is the position at the very top)
Click on the left mouse button to commit the changes.
Pressing the "D" key toggles the chart between two modes:
- The size of the circle is formed from a fixed number of bars
- The size of the circle is a fixed time interval. If you use the minute chart, then one loop is a day (24 hours). 0 hours is the top, noon is the bottom.
 Cross
Cross
Simple code for Candle Cross above or below Conditions..
 Testinator for testing massive combinations of trade setups
Welcome to the Binary Testinator. The Purpose of this EA is for testing different Indicators to optimize a trade scenario. Everyone has an opinion on what is the best trade setup, and advice is never ending! Better if you test it out...
Pseudo-Indicator with Asynchronous Multi-Threaded Calculations Demo
This is an indicator w/o buffers which demonstrates parallel multi-threaded calculations in chart objects hosting worker expert adviser.
3D Spiral Quotes
Demonstration of Canvas's capabilities using 3D spiral quotes as an example.