당사 팬 페이지에 가입하십시오

- 조회수:
- 15822
- 평가:
- 게시됨:
- 업데이트됨:
-
 이 코드를 기반으로 한 로봇이나 지표가 필요하신가요? 프리랜스로 주문하세요
프리랜스로 이동
이 코드를 기반으로 한 로봇이나 지표가 필요하신가요? 프리랜스로 주문하세요
프리랜스로 이동
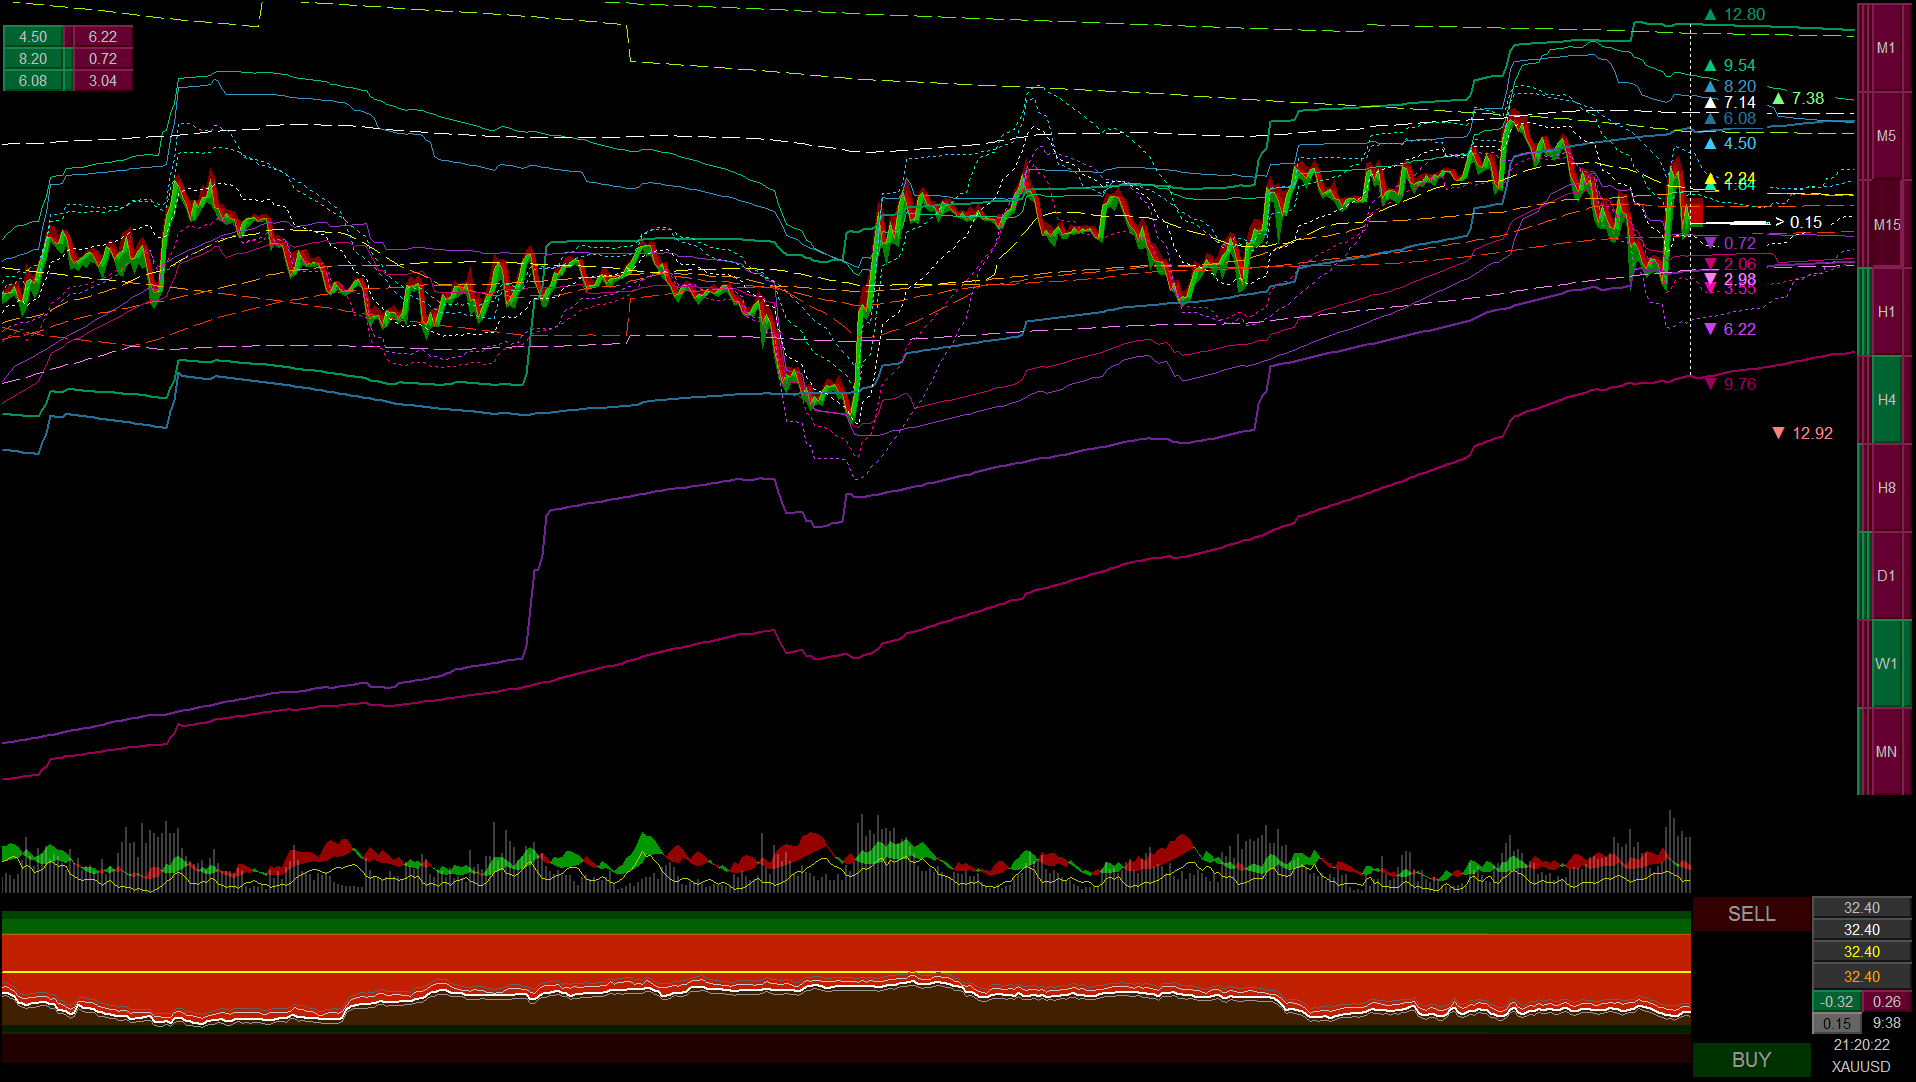
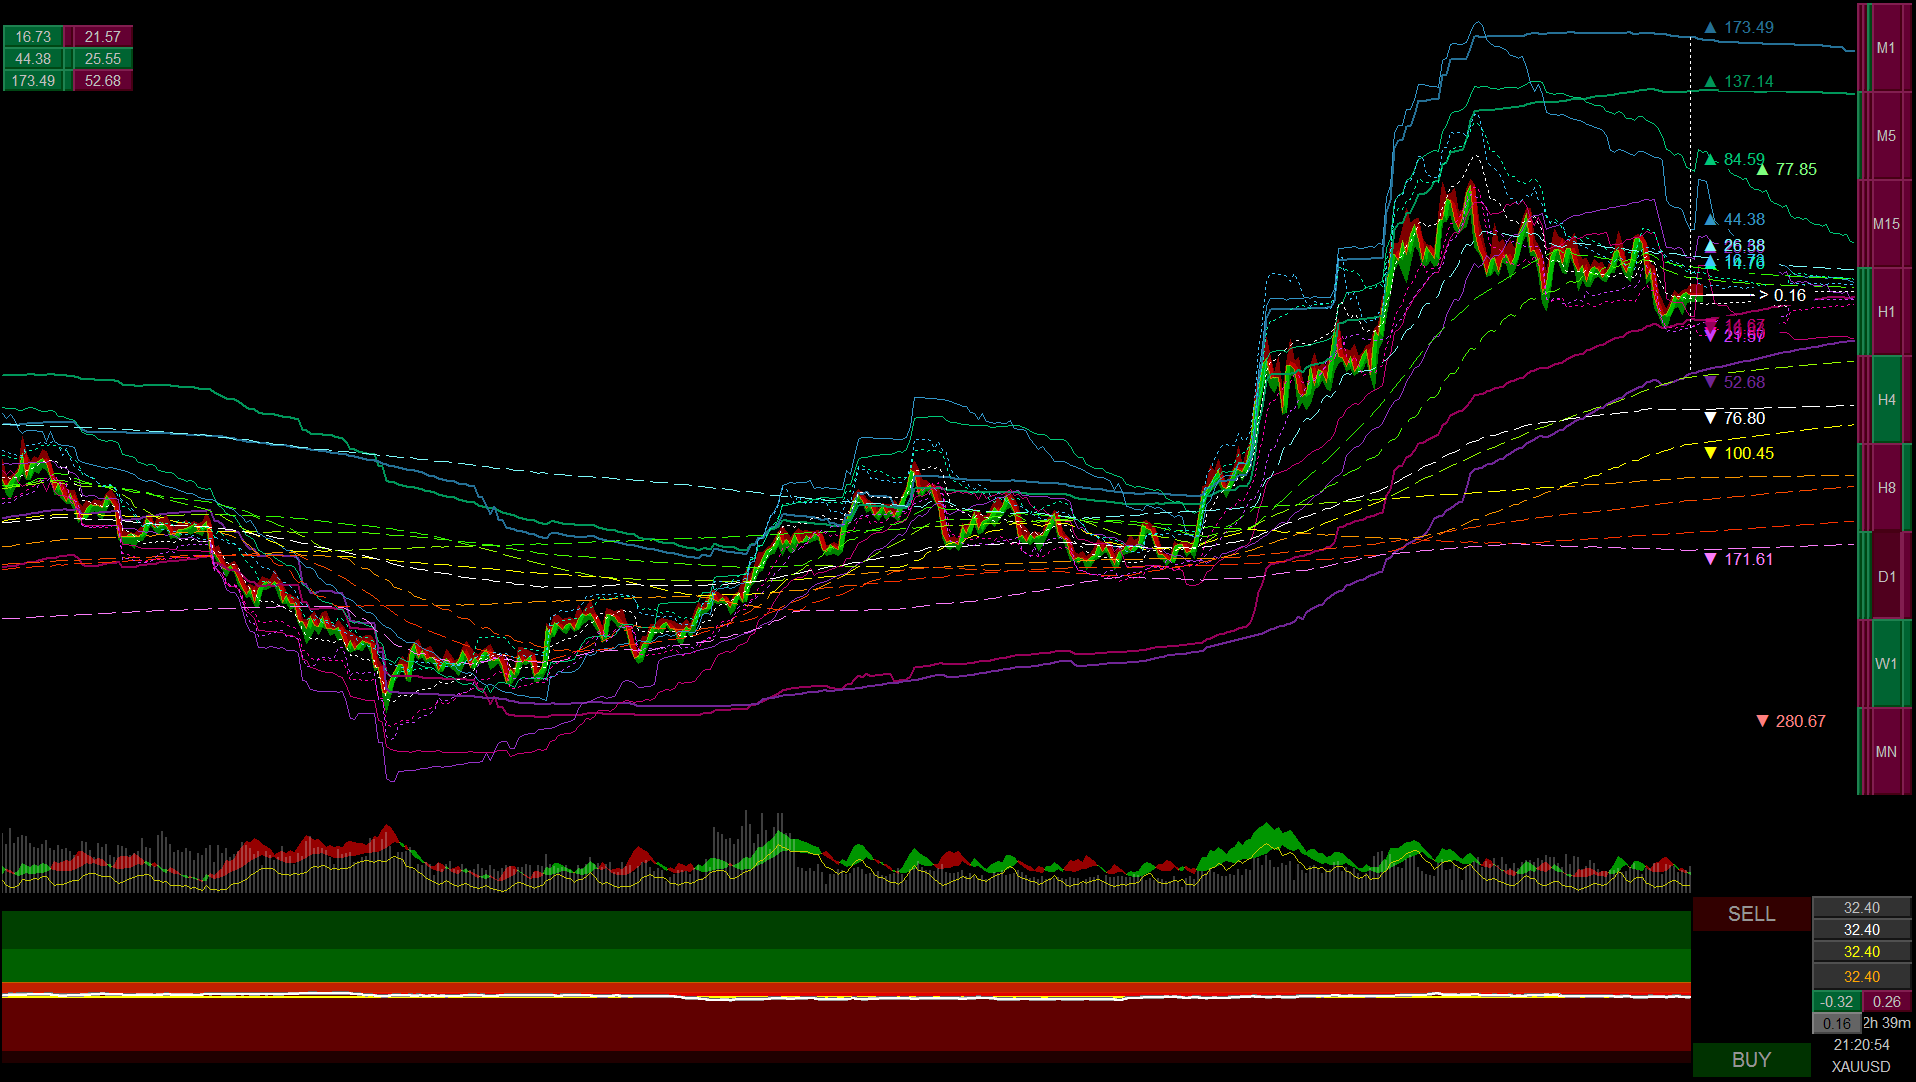
"NLD_Main" is a trend indicator, designed to identify the most relevant trends and trend reversals for the currently selected time-frame.
"NLD_Chart"
is a custom price indicator, which can be used as a replacement for candles or bars, to make price movements easier to visualize, especially
when the chart is zoomed out (to see more data).
"NLD_Volume" is a custom volume indicator, which calculates volumes relative to the time left in the candle (instead of absolute volumes).
"NLD_AXD" is a custom Average Directional Movement Index indicator, which uses a yellow line for momentum (up=speeding up, down=slowing down) and filled area for the average movement direction (green=moving up, red=moving down).
NLD_Trade" and "NLD_Expert" work together to provide an easy-to-use Trading Terminal, including:
* Symbol Name
(bottom right corner)
* Account information (Balance, Equity, Margin Limit, Free Margin in account currency)
* Cost
to open a new position (spread + commission in account currency)
* Swap costs (Buy and Sell side, in account currency)
* Server time and the time left until the end of
the current candle
* Tick-Chart, mainly used for Scalping, painting every Tick received for the Symbol, showing Bid and Ask prices (thick white lines),
Bid/Ask prices after paying commission (thin grey lines), Highs and Lows (red/green filling), and ... the most recent Pivot point (thick
yellow line)
* BUY and SELL buttons - used to place BUY/SELL orders for the Symbol).
* Floating Profit/Loss
value (in account currency) of open positions on the Symbol, separated into Total BUY (above the BUY button), Total SELL (below the SELL
button) and one of the following: "Total", "Only Profits", "Only Losses" or the "Best Position", depending on the "BUY/SELL Center" input
parameter (default = Best Position).
If you change the "Hedging Allowed" input parameter on "NLD_Expert" to FALSE (default=TRUE), when you click BUY or SELL buttons and
there is a position open in the opposite direction (SELL is open when you click BUY, or BUY is open when you click SELL) closes the best
performing position from the opposite direction (a position with the highest profit, lowest loss) instead of opening a new a position in
your trade direction. In other words, it closes one SELL position when you click BUY, or ... one BUY position when you click SELL. This avoids
paying double spread and commission for trades, closing your best performing positions at the current market price and allowing you to
reduce your exposure and cut your losses or bank partial profits.
"NLD_Main", "NLD_Trade" and "NLD_Expert" have "Forex Commission" and "Stock Commission" input parameters, which you should update to
reflect the Commissions charged by your Broker. These values are in your Account Currency and are set to "0.06" and "0.36" by default. For
Accounts where Broker commission is in the Spread, change these parameters to 0.
To configure a new MT5 chart for using "NELODI" as your Trading Terminal, add "NELODI" Indicators and the Expert Advisor to your
Chart(s), in the following order:
1. NLD_Chart (custom Price line) *optional
2. NLD_Main (Main indicator) *recommended
3. NLD_Volume (Volume
indicator) *recommended
4. NLD_ADX (Directional Movement indicator) *recommended (can be combined with the Volume indicator)
5. NLD_Trade
(Tick chart with Trade info & BUY/SELL buttons) *required
6. NLD_Expert (Required for Trading, "Allow Automated Trading" has to be checked) *required
For best chart
performance, reduce "Max bars in chart" to 15000, but do NOT go much lower than this, because the main "NELODI" chart requires >10000 bars
to calculate correctly.
When trading, take into account that ALL THE PRICE ACTIONS YOU SEE NOW have already happened in the past. Even if you have a very fast
connection to your Broker, there will ALWAYS be a delay between the time something happens on the Market and the time you see it happen.
Also, when you click a button to open or close a position, it will take time for your action to be sent to the Broker and Executed. These delays
accumulate and can result in a considerable difference between the prices you see before clicking a button and the prices you actually get
filled with (once your orders are executed by the Broker).
"NLD_Expert" was built to minimize the negative side-effect of delayed execution by using asynchronous calls and sending all your orders in
batches, but ... there is a limit for the number of orders that can be placed in a single batch, because of which a single Click to close all open
positions can result in multiple batches being sent to the Broker, during which time the price can move considerably against you before all
your orders have been executed. For the best performance when closing positions, keep the number of open positions as low as possible.
Now that you know the basics, you can start using "NELODI" with a *DEMO* account.
Because "NELODI" opens and closes
positions at the current market price and does NOT use "Pending Orders", "Take Profit" or "Stop Loss" positions, the results you get when
using "NELODI" on a DEMO account (under normal market conditions), should be comparable to the results you would get if you were trading on a
REAL account.
In other words, if your results are consistent over a longer period of time when trading with "NELODI" on a DEMO account, you should see
comparable results when trading on a REAL account, providing the market conditions remain the same.
On the other hand, if you keep making profits on a DEMO account, but keep making losses on a REAL account, then you should revise your
trading strategy, because ... you are either reading the charts wrong, or your strategy relies too much on luck.
All indicators included in this package are non-repainting, which means that the LEFT side of the chart does NOT change as new data
arrives. In other words, everything LEFT of the white vertical dotted line on the Main indicator, which is always drawn at the current time
and price, belongs to History and does NOT change with price movements in the future. This allows you to look at chart history and learn how the
Main indicator works. What does change, however, is the RIGHT side of the Main chart (everything from the current price line into the
future), which is calculated based on the current open price. Since the price usually moves up or down, the right part of the Main chart will be
re-calculated at the end of the candle and would therefor look quite differently if the price moved a lot since the last candle.
DISCLAIMER: THIS SOFTWARE IS PROVIDED BY THE COPYRIGHT HOLDERS AND CONTRIBUTORS "AS IS" AND ANY EXPRESS OR IMPLIED WARRANTIES, INCLUDING, BUT
NOT LIMITED TO, THE IMPLIED WARRANTIES OF MERCHANTABILITY AND FITNESS FOR A PARTICULAR PURPOSE ARE DISCLAIMED. IN NO EVENT SHALL THE
COPYRIGHT OWNER OR CONTRIBUTORS BE LIABLE FOR ANY DIRECT, INDIRECT, INCIDENTAL, SPECIAL, EXEMPLARY, OR CONSEQUENTIAL DAMAGES
(INCLUDING, BUT NOT LIMITED TO, PROCUREMENT OF SUBSTITUTE GOODS OR SERVICES; LOSS OF USE, DATA, OR PROFITS; OR BUSINESS INTERRUPTION)
HOWEVER CAUSED AND ON ANY THEORY OF LIABILITY, WHETHER IN CONTRACT, STRICT LIABILITY, OR TORT (INCLUDING NEGLIGENCE OR OTHERWISE) ARISING
IN ANY WAY OUT OF THE USE OF THIS SOFTWARE, EVEN IF ADVISED OF THE POSSIBILITY OF SUCH DAMAGE.
USE AT YOUR OWN RISK!
 Programming Patters - Builder (classic)
Separate the construction of a complex object from its representation so that the same construction process can create different representations.
Programming Patterns - Factory Method
Define an interface for creating an object, but let subclasses decide which class to instantiate. Lets a class defer instantiation to subclasses.
 NELODI Trend Painter
Trend indicator similar to Ichimoku Kinko Hyo, with a number of drawing options and calculation parameters.
NELODI Trend Waves for MT5
Monster Trend indicator that uses data from several time periods.