거래 로봇을 무료로 다운로드 하는 법을 시청해보세요
당사를 Twitter에서 찾아주십시오!
당사 팬 페이지에 가입하십시오
당사 팬 페이지에 가입하십시오
스크립트가 마음에 드시나요? MetaTrader 5 터미널에서 시도해보십시오

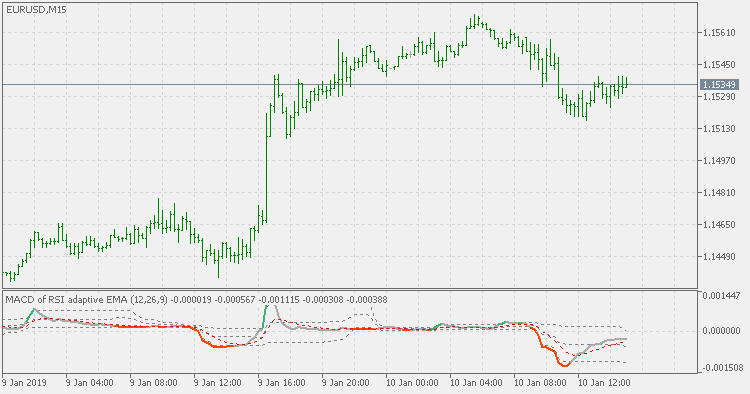
MACD of RSI adaptive EMA - with floating levels - MetaTrader 5용 지표

- 조회수:
- 15286
- 평가:
- 게시됨:
-
 이 코드를 기반으로 한 로봇이나 지표가 필요하신가요? 프리랜스로 주문하세요
프리랜스로 이동
이 코드를 기반으로 한 로봇이나 지표가 필요하신가요? 프리랜스로 주문하세요
프리랜스로 이동
Theory :
MACD is calculated, by original definition, as a difference of two EMAs : fast and slow EMA (Exponential Moving Average). This version is using RSI adaptive EMA for calculation and it is adding one thing that originally does not exist in the MACD (since it is an un-bound indicator) : a sort of over bought and over sold levels by using floating levels for that. You have a choice of 4 types of color changes for that :
- color change on macd slope change
- color change on macd to signal cross
- slope change on macd crossing on outer (OB/OS) crosses
- slope change on middle (floating zero) cross
Usage :
It can be used as any other MACD
RSI adaptive double smoothed EMA
RSI adaptive double smoothed EMA
Phase accumulation adaptive market mode - discontinues signal lines
Phase accumulation adaptive market mode - discontinues signal lines
TRIX (fast EMA)
TRIX (using fast EMA for calculation)
Double smoothed Wilders EMA
Double smoothed Wilders EMA