거래 로봇을 무료로 다운로드 하는 법을 시청해보세요
당사를 Facebook에서 찾아주십시오!
당사 팬 페이지에 가입하십시오
당사 팬 페이지에 가입하십시오
스크립트가 마음에 드시나요? MetaTrader 5 터미널에서 시도해보십시오

- 조회수:
- 12034
- 평가:
- 게시됨:
-
 이 코드를 기반으로 한 로봇이나 지표가 필요하신가요? 프리랜스로 주문하세요
프리랜스로 이동
이 코드를 기반으로 한 로봇이나 지표가 필요하신가요? 프리랜스로 주문하세요
프리랜스로 이동
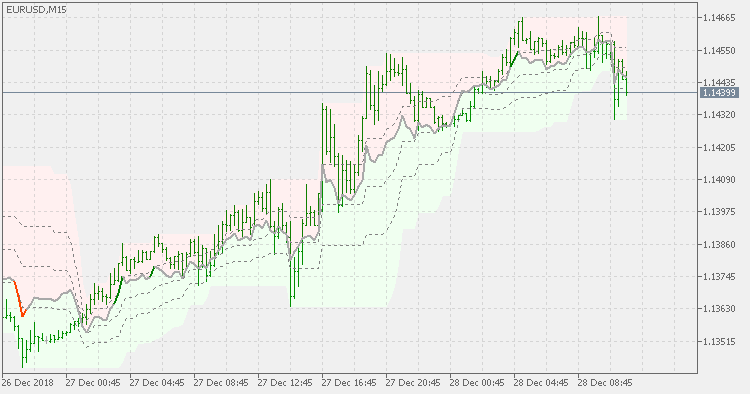
Theory :
In a lot of cases it would help if we can see some oscillator on directly on chart, instead of seeing it in a separate window. There is a few methods for doing that. One is using a highest high / lowest low channel. This version is doing that and is displaying RSI (Relative Strength Index) directly on chart
Usage :
As any other RSI is used. Some additional options are added (like 3 coloring modes) in order to help the usage of the indicator
 Price Percentage and Times on cursor crosshair
This indicator enhance the functionality of the standard crosshair of MetaTrader adding the difference in Percentage and the time span in a human readable form (not in bars, but in Hours, minutes, days, etc)
Adaptive efficiency ratio EMA
Adaptive efficiency ratio EMA