거래 로봇을 무료로 다운로드 하는 법을 시청해보세요
당사를 Telegram에서 찾아주십시오!
당사 팬 페이지에 가입하십시오
당사 팬 페이지에 가입하십시오
스크립트가 마음에 드시나요? MetaTrader 5 터미널에서 시도해보십시오
- 게시자:
- [삭제]
- 조회수:
- 106
- 평가:
- 게시됨:
-
이 코드를 기반으로 한 로봇이나 지표가 필요하신가요? 프리랜스로 주문하세요 프리랜스로 이동
빌드 344부터 특수 그래픽 객체(OBJ_EVENT) 를 이용한 경제 캘린더 뉴스의 클라이언트 단말 표시 기능이 추가되었습니다.
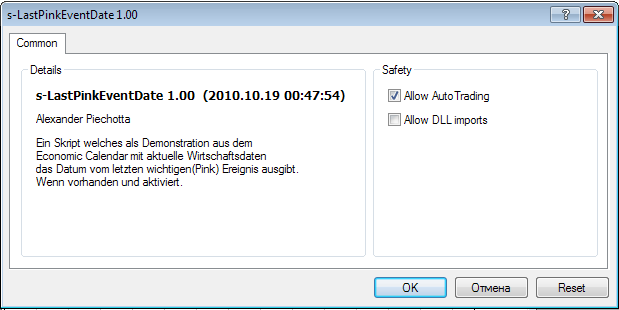
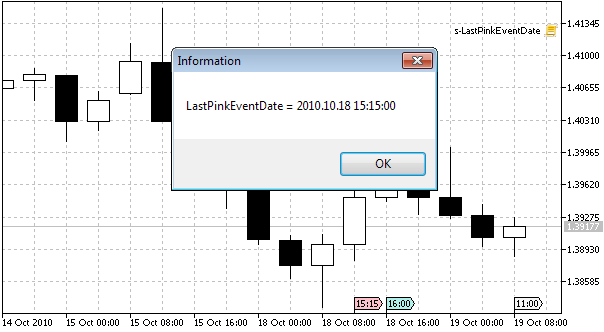
현재 경제 데이터가 포함된 경제 캘린더의 데모로 마지막 주요(핑크) 이벤트의 날짜를 출력하는 스크립트입니다.


datetime last_pink_event_date()함수를 사용합니다 .
//+------------------------------------------------------------------+
//| 이 함수는 마지막 이벤트의 날짜를 반환합니다.
분홍색으로 표시된 //|(경제 지표 | |
//|는 예상보다 작습니다).|
//+------------------------------------------------------------------+
datetime last_pink_event_date()
  {
   string  name="";
   int total=ObjectsTotal(0)-1;

   for(int i=total; i>=0; i --)
     {
      name=ObjectName(0,i);

      if(ObjectGetInteger(0,name,OBJPROP_TYPE,0)  !=  109) continue; // 개체 유형 - 이벤트
      if(ObjectGetInteger(0,name,OBJPROP_COLOR,0) != Pink) continue; // 개체 색상 - 분홍색

      datetime date=(datetime)StringSubstr(name,0,16); // 텍스트 문자열에서 이벤트 날짜를 강조 표시합니다.

      return(date); //날짜 반환
     }

   return(0);
  }
권장 사항:
- 주말에는 차트에 데이터 개체가 없습니다.
- 특수 그래픽 개체가 존재하고 활성화되어 있습니다.
MetaQuotes Ltd에서 영어로 번역함.
원본 코드: https://www.mql5.com/en/code/205
 2MA_RSI.
두 개의 MA 및 RSI에 대한 전문가 고문
 트레이더를 위한 고급 복리 계산기
트레이더를 위한 복리 이자 계산기. 매개변수를 기반으로 손실 위험과 거래당 최적의 위험을 계산합니다. 1년, 한 달, 만기 시점의 자본 규모를 예측합니다.
 ClearView - PricePointer, RoundNumberMarker, PeriodSeparator plus template
중요한 가격대와 연도/월/주/일/세션의 시작/끝에 지능형 마커를 추가하여 차트를 향상시킵니다. 가격이 중요한 가격대에 가까워질 때마다 색상이 바뀌는 가격 포인터(예: 과거 고점/저점)가 포함되어 있습니다.
 A 3 line script that tells you how many bars are on your chart
차트에 드래그하면 전문가 창에 해당 차트에 있는 막대 수가 마법처럼 인쇄되는 스크립트입니다.