당사 팬 페이지에 가입하십시오
- 게시자:
- 조회수:
- 76426
- 평가:
- 게시됨:
- 업데이트됨:
-
 이 코드를 기반으로 한 로봇이나 지표가 필요하신가요? 프리랜스로 주문하세요
프리랜스로 이동
이 코드를 기반으로 한 로봇이나 지표가 필요하신가요? 프리랜스로 주문하세요
프리랜스로 이동
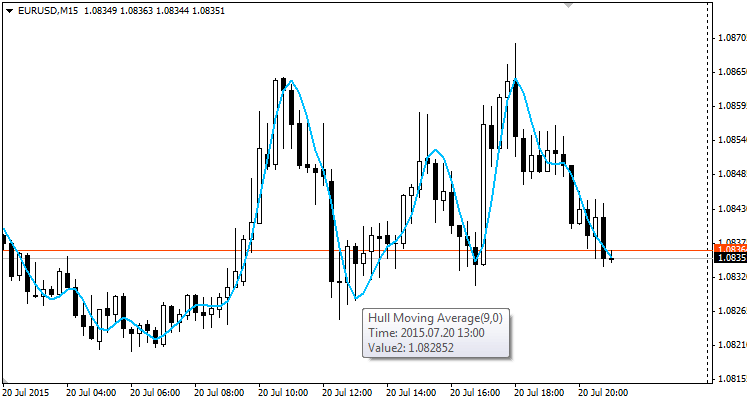
The Hull Moving Average (HMA), developed by Alan Hull, is an extremely fast and smooth Moving Average that almost eliminates lag altogether and manages to improve smoothing at the same time. For that, Alan wrote an equation for the calculation of this Moving Average like this:
LWMA[square root(period), (2*LWMA(period/2, price)-LWMA(period, price)]
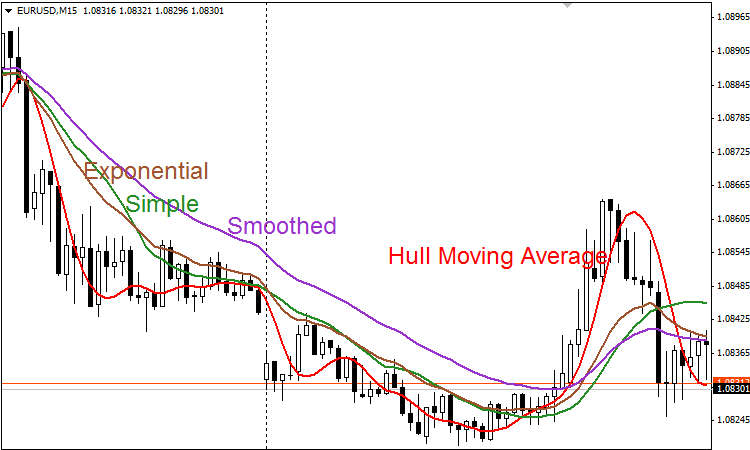
With this clever equation, Alan got a very fast Moving Average that it is much more reactive to the price action.
For a full explanation of how it works you can visit: http://alanhull.com/hull-moving-average
You can use it in two main ways:
- Using only one HMA: When the HMA change its slope, this is a good time to be ready for entry long or short depending of the direction of the slope change. Always look for a good setup, like candlestick pattern or breakout of support-resistance zone.
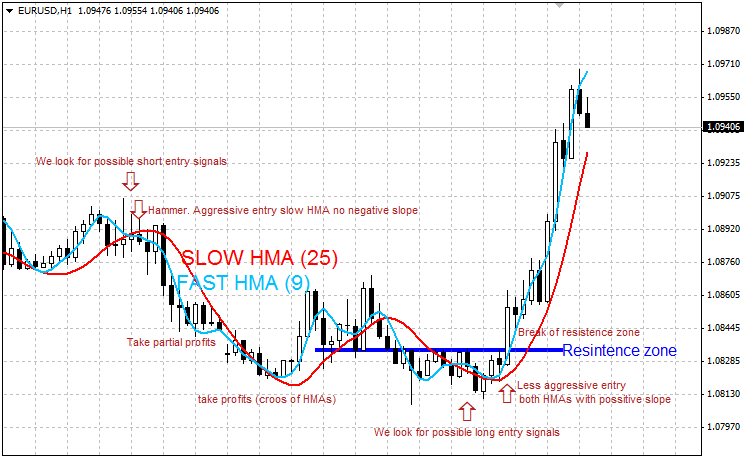
- Using two HMAs: with the typical cross of averages, e.g. HMA(9) and HMA(25). Considering the same that is said above. Also you can use it like out signal when it changes its slope (when you use only one HMA or when you use two with the change in the slope of the fast HMA). Like all moving averages, it does not work well in range markets because it gives many false entries.
I have made the code so you can change the type of Moving Average used in the calculations (but this already would not be a real Hull Moving Average) and the applied price. I like to use the typical price to take into account what has happened in each candle.
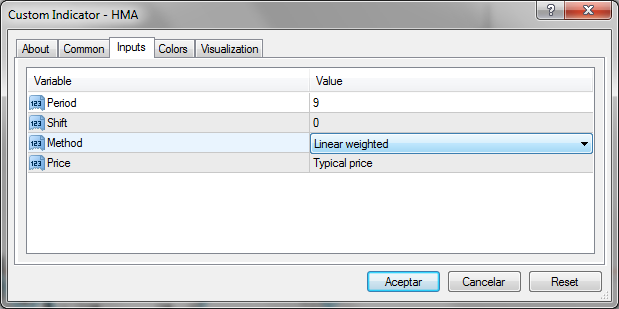
In the code, in the part "Custom indicator initialization function", you will see the line:
SetIndexStyle(0,DRAW_NONE);
If you write DRAW_LINE, you will see another line on the chart that represent this part of the equation:
2*LWMA(period/2, price)-LWMA(period, price)
This is the calculation previous to the HMA calculus, but without the smoothing effect of applying a Moving Average to a Moving Average. You can use these lines like the use of two HMAs of different periods.
 Bounce Strength Indicator 2.0 with Tango Line
Bounce Strength Indicator (BSI) shows the strength of bounce. It now works in trend and uses Tango Line calculations.
Tango Line
This indicator is a sharp turn to the dynamic change of direction. Like tango steps!
 News Hour Trade
Expert Advisor I have developed for News Time Trading (set time and leave it).
PriceHistogram OnClick Event
This indicator shows four price histograms when a chart click event is fired.