당사 팬 페이지에 가입하십시오
- 조회수:
- 52881
- 평가:
- 게시됨:
- 업데이트됨:
-
이 코드를 기반으로 한 로봇이나 지표가 필요하신가요? 프리랜스로 주문하세요 프리랜스로 이동
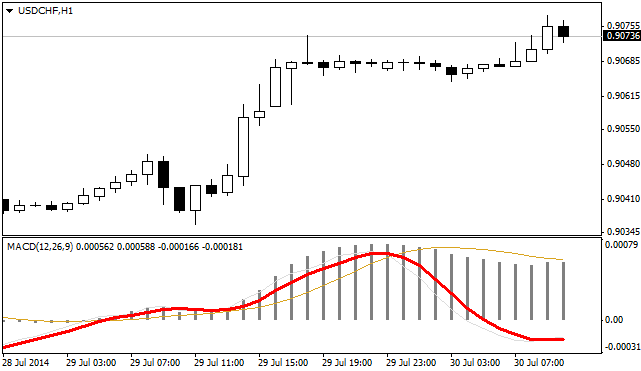
MACD Momentum indicator (The Red line is the Momentum 10 of the histogram MACD, smoothed 3).
From an idea of Tom Aspray, I don't know if this indicator is the same he was thinking about, but it could be usefull.
"In the fall of 1986, Tom Aspray completed work on a new indicator: the MACD Histogram/Momentum. The MACD, or Convergence/Divergence, is an excellent indicator, but its signals often lag when run on weekly data. Convergence/Divergence was developed by Gerald Appel, who has created many excellent technical tools.
Tom first presented his work on the MACD at a CompuTrac conference in 1984. At that time, very few analysts were aware of it, much less using it on the commodity markets. Now it is a widely used technical tool.
Tom did some work on optimizing the MACD by testing various combinations of inputs for the three exponential moving averages. Then, by altering the moving average variables, the results are dramatically different.
For example, the default for silver (12 days, 26 days and 9-period exponential average of the difference) were not always profitable, while the (10, 20, 9) combination was profitable 54% of the time, with an average profit of 67.5 points and an average loss of only 34 points.
After studying and using MACD for almost five years, Tom felt that, besides optimization, a method of anticipating crossovers would be a distinct advantage. After looking at (and testing) several alternatives, he found that by running a 10-day momentum (with 3-day smoothing) of the MACD in histogram form (MACD-H), the results were quite good."

 MTF EMA 20
This indicator helps to find possible support/resistance areas after a trend has developed.
 Oscillators on Chart
A few oscillators (RSI, CCI & PercentRange) drawn in the chart window.
 СloseAll
A collection of scripts for closing various types of orders.
 DonForex MinInfo
Some basic information which every trader needs.