당사 팬 페이지에 가입하십시오
- 조회수:
- 46450
- 평가:
- 게시됨:
- 업데이트됨:
-
 이 코드를 기반으로 한 로봇이나 지표가 필요하신가요? 프리랜스로 주문하세요
프리랜스로 이동
이 코드를 기반으로 한 로봇이나 지표가 필요하신가요? 프리랜스로 주문하세요
프리랜스로 이동
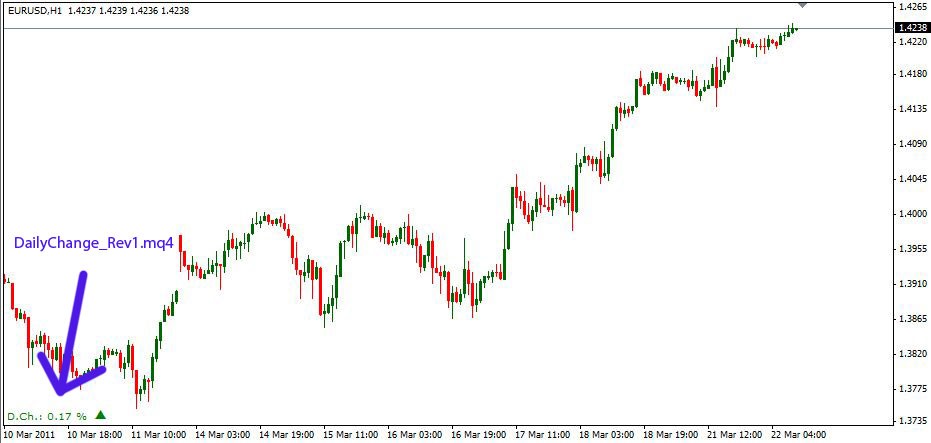
This indicator shows the % Daily Change of yesterday close with respect to actual price (Bid).
It calculates the percentage change between yesterday close price and the actual bid price.
It works on any timeframe.
External Modifications:
You can modify the following settings:
Label_Color = DarkBlue // You can change the font color
Font_Size = 14 // You can modify the font size
X_Position = 3 // You can modify X position (distance) from corner
Y_Position = 3 // You can modify Y position (distance) from corner
Corner_Position = 2 // You cna select the corner position (0: Top Left / 1: Top Right / 2: Bottom Left / 3: Bottom Right)
LAST RELEASE: DailyChange_Rev1.mq4.
Modifications in last release: Color changes automatically when positive or negative. An arrow indicates if movement is up or down.
External Modifications in DailyChange_Rev1.mq4:
You can modify the color and size:
Color: You can change the color for Up Movement, Down Movement and No Movement
Size: You can change the text font size and the arrow size
You can modify the position of text and arrow:
X_Position You can modify X position (distance) from corner
Y_Position You can modify Y position (distance) from corner
Corner_Position You can select the corner position (0: Top Left / 1: Top Right / 2: Bottom Left / 3: Bottom Right)
 Doda-Stochastic Indicator
Variant of stochastic indicator, which filters false signals automatically.
 GoodG@bi Review
Join me to develop this project. It has been my project for 2 years now and running.
X Trail
This EA alerts you whenever there is a MA cross.
ZMFX all pivot levels
Indicator which draws daily, weekly and monthly pivots, support and resistance levels.